Combining Tools in the Performance and Diagnostics Hub in Visual Studio 2013
We have been hard at work on the Visual Studio Diagnostics team building on the Performance and Diagnostics hub. If you pick up Visual Studio 2013 Update 2, you can try out the features shown in this blog post.
We have some great tools in the hub, and as many of you know, performance problems can often be caused by a combination of issues. That is why in this update we have enabled you to run performance tools together for faster and more effective performance analysis (which was always our plan). We have also added a new CPU Usage tool which can be run by itself or combined with other tools in the hub, and helps you to diagnose CPU-related performance issues.
In this blog post we will first look at the overall experience, and then look at how using a combination of tools can help us quickly solve two common types of issues: UI responsiveness and power consumption.
Overall Experience
In this release we have enabled this capability for Windows Store apps, and plan to enable it for more types of apps in the future. The tools that can be combined are:
- The HTML UI Responsiveness tool
- The XAML UI Responsiveness tool
- The Energy Consumption tool
- The CPU Usage tool
Previously, when you went to the Performance and Diagnostics hub (Debug -> Performance and Diagnostics) you could only select one tool at a time. Now, when you select one of the above tools, you can select other combinable tools to run at the same time and the ones that can’t be combined are grayed out:
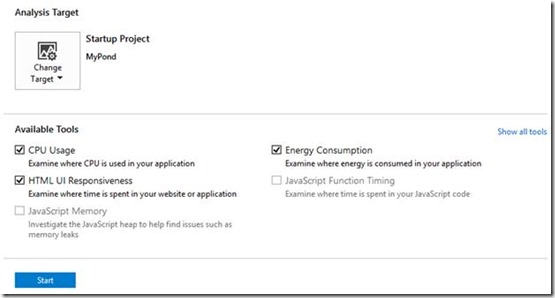
The CPU Usage, XAML and HTML UI Responsiveness, and Energy Consumption tools can be run together in the Update 2 CTP 1
Once you click the Start button, we will start or attach to your app and collect performance data for all three tools. You might be worried about the overhead of running multiple profilers at the same time, but we worked hard to share data and analysis between tools where possible and minimized the overhead of running multiple tools.
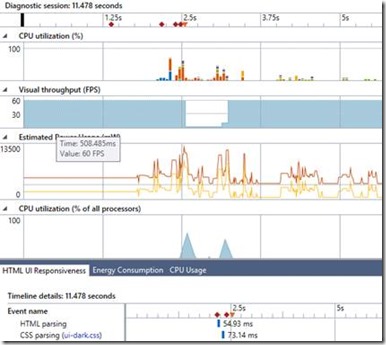
After you click stop, we will analyze the data and show the graphs and details for selected tools in the same report. The graphs from all tools are shown at the top of the report along a common timeline, and the details for each tool are found in the tabs below the graphs . The contents of the tabs are filtered to selected range of time on the graphs, which allows you to correlate activity from one tool with another.
Graphs from all three tools are shown on a common timeline, with details for each tool in tabs at the bottom
So why aren’t all tools combinable? Well, it takes a great deal of common infrastructure and sharing to get tools to run together, so we have started with a few of the tools that help you solve key problems when used together. The key problems we wanted to make easy for you to solve are:
- Diagnosing UI responsiveness or frame rate issues that are caused by heavy CPU usage. Using the HTML or XAML UI Responsiveness tool with the CPU Usage tool will allow you understand what functions were using the CPU on the UI thread during animation frames, click handlers, and other user initiated actions.
- **Diagnosing energy consumption issues where much of the energy is caused by CPU activity. **Using the Energy Consumption tool with the CPU Usage tool will allow you understand what functions were using the CPU when energy consumption is high.
Let’s take a look each of these cases in more detail.
UI responsiveness issues caused by CPU activity
In order for your application to be fast and fluid, you need to keep the UI thread available to do work. Many UI responsiveness issues are caused by too much CPU-bound work being done on the UI thread, which results in fewer frames being drawn and the UI becoming less responsive.
For this reason, we recommend that you run the CPU Usage tool any time you run the HTML or XAML UI Responsiveness. In this section we are showing the HTML UI Responsiveness tool, but the same concepts apply to the XAML UI Responsiveness tool as well.
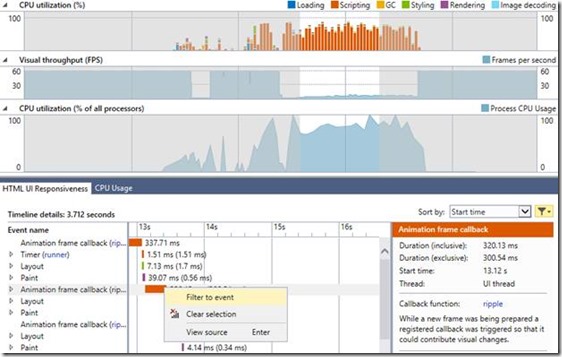
After collection you will see graphs for the HTML UI Responsiveness tool and the CPU Usage tool on a common timeline. For a frame rate issue you will often find a drop in FPS and a corresponding rise in CPU activity. You can simply select this range of time, and then see what activity the UI is doing in the HTML UI Responsiveness tab.
Selecting a range of time updates the details for each tool in the tabs at the bottom
Note that the top graph shows a breakdown of HTML and JavaScript related CPU work, while the bottom graph includes all CPU activity that is happening within the process. You will typically see callbacks and event handlers in the HTML UI Responsiveness tab that take longer than you expect. You can right click and filter to one of these events, which then updates the global time selection to include only that event. You can then switch to the CPU tab to see what functions were using the CPU during that period of time.
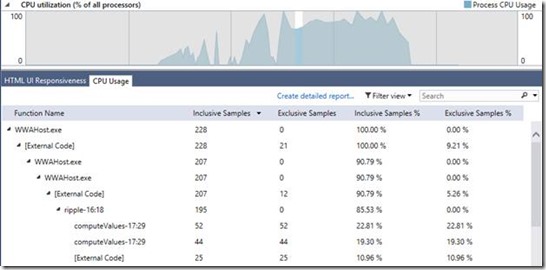
You can see CPU activity that occurred during the event that was selected in the HTML UI Responsiveness tab
If you want to filter out CPU activity on background threads, you can use the “Filter view” menu to filter the CPU Usage view so that it shows only activity that occurred on the UI thread.
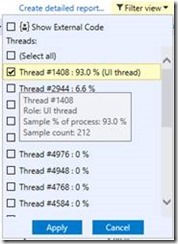
The CPU Usage tool allows you to filter to CPU used by the UI thread
If you want to learn more about analyzing UI responsiveness issues with our tools, be sure to check out Analyze UI responsiveness (XAML) and Analyze UI responsiveness (JavaScript) on msdn.
Energy consumption caused by CPU activity
The Energy Consumption tool in the hub is great at estimating how much energy your app is using. If you have used this tool you would have noticed that a lot of energy can be used by the CPU. If you notice that the CPU is responsible for high power consumption in your app, running the CPU Usage tool in conjunction with the Energy Consumption tool will help you identify which functions are running when your power usage is high.
For this reason, we recommend that you run the CPU Usage tool with the Energy Consumption tool. When you have done so, you can select a range of time on the energy consumption graph that shows energy consumption related to CPU usage. You can then switch to the CPU Usage tab to see a breakdown of the functions that were using the CPU during that time.
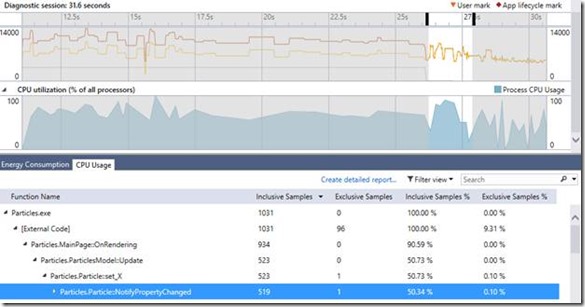
You can see a breakdown of the CPU activity correlated to energy consumption for the selected range of time
Now you can focus your investigation on optimizing CPU activity during this range of time so that you can lower the energy consumption of your app. You can use the call tree in the CPU Usage view to see which functions are using the CPU the most, and look for opportunities to optimize those functions so that your app will use less energy. It can sometimes be more energy efficient to use more of the CPU for a shorter period of time by doing work in parallel, and allowing the CPU to remain idle afterward. In this case, you can use the CPU utilization graph to look for areas where you are not using all of the CPU and may be able to parallelize your code. After you make changes to your code you should re-run the Energy Consumption tool again to validate that you have made an improvement.
Let us know what you think!
We are excited to be making this powerful capability available to you, and we want to know what you think! Download Visual Studio 2013 Update 2, go to Debug –> Performance and Diagnostics, select some tools, and click Start to diagnose performance issues in your app. For more information on how to use each tool you can refer to the links found in this post.
If there’s something that would better help you to diagnose your performance problems, whether it’s a new tool or improvements to existing ones, send us feedback on our MSDN Forum (if you run into issues using the tools), or using Send-a-Smile (if you have feedback and/or suggestions) from within Visual Studio.
Thanks for reading and happy performance hunting ![]()

 Light
Light Dark
Dark
0 comments