Application Insights – instrumentation approaches for running tests
[this summer Beckylin Orooji from the University of Central Florida in Orlando studying Computer Science interned with the Application Insights team in the developer division at Microsoft. Below is a blog she authored based on some end to end scenarios she worked on]
In my scenario today I have a shopping website. I have made some changes to the checkout process and want to see if those changes have resulted in more people checking out. I want to make decisions based on the data I receive; depending on my results I will decide whether or not my changes were successful. Now, imagine you have two different versions of your application running either at the same time with the ability to direct some percentage of traffic to each or at different times and you’d like to compare results between them. Below are some suggestions and patterns on how to best structure your telemetry and usage of the Application Insights SDKs so you can answer the questions you have and make informed decisions about which version is more successful for your customers.
**Step 1: Add New Application in Application Insights
**
Click ‘Add application’ under the OVERVIEW tab.
For a website you should answer as seen in the picture below.

Follow the instructions generated
![clip_image002[5] clip_image002[5]](https://devblogs.microsoft.com/devops/wp-content/uploads/sites/6/2014/08/8816.clip_image0025_thumb_3E926ED8.png)
**Step 2: Send data to Application Insights **
Visit http://msdn.microsoft.com/en-us/library/dn614099.aspx to read more on how to add custom telemetry to your code.
For my website I wanted to know every time a costumer adds something to their cart and checks out.
Below you can see an example of logging an event every time a costumer adds something to their cart.
![clip_image002[8] clip_image002[8]](https://devblogs.microsoft.com/devops/wp-content/uploads/sites/6/2014/08/7848.clip_image0028_thumb_72C6981E.png)
When choosing how to organize your data you can choose different ways. The table below provides a couple different strategies with pros/cons
|
Pros |
Cons |
|
|
2 Separate Applications Add a new application for each version in Application Insights Different Component IDs |
• Information separated • Not cluttered by all the different versions being displayed at the same time |
• Have to go through the process of setting up a new application for each version of website • Have to navigate through different applications to gather all of the information |
|
End log event path with version /…/…/Version1 /…/…/Version2 |
• Able to view every version on the same page in Application Insights |
• Have to expand everything to see the version • If you have many versions this page in application insights can become very text heavy |
|
Lead log event path with version Version1/…/…/ Version2/…/…/ |
• Able to view every version on the same page in Application Insights • Gives you total activities/events for each version |
• If you have many versions this page in application insights can become very text heavy |
|
Enter Version as Parameter /…/…/ {version} {} |
• Organize by version without affecting path • Can search by version • Can view certain graphs based on version when passed as a parameter |
• Not able to pin metrics if using this strategy in Visual Studio Online |
**Step 3: View data in Application Insights **
In Application Insights under Usage Features Events you will see your data
![clip_image002[10] clip_image002[10]](https://devblogs.microsoft.com/devops/wp-content/uploads/sites/6/2014/08/0508.clip_image00210_thumb_35393A55.png)
If you click the expand arrows you will notice the data appears in the path you specified when you logged an event
![clip_image002[12] clip_image002[12]](https://devblogs.microsoft.com/devops/wp-content/uploads/sites/6/2014/08/2063.clip_image00212_thumb_0DFEF120.png)
**Step 4: Set Up a Dashboard **
In Overview Dashboards click the green plus sign ‘+’
You will be prompted to name your new dashboard and select a template
![clip_image002[4] clip_image002[4]](https://devblogs.microsoft.com/devops/wp-content/uploads/sites/6/2014/08/2161.clip_image0024_thumb_429F4D5B.gif)
After creating your dashboard navigate back to under Usage Features Events
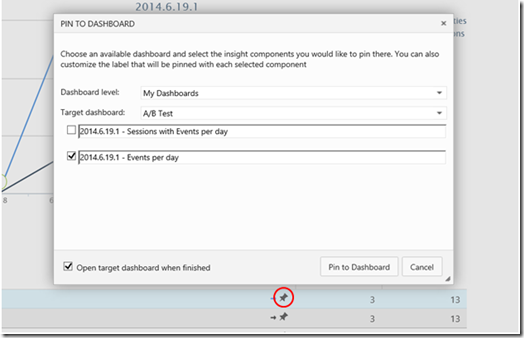
Notice the thumbtack symbol by every line of data (circled in red)
You can click this button and have the data associated with it to appear on your new dashboard

|
|
After pinning some of the data you can organize your dashboard. Below is a side by side comparison of two different versions of my application
![clip_image002[16] clip_image002[16]](https://devblogs.microsoft.com/devops/wp-content/uploads/sites/6/2014/08/1512.clip_image00216_thumb_0FCF46E7.png)
You now have a side by side comparison of how each version is being used. Use this data when considering how much traffic should be sent to each version of you application.

 Light
Light Dark
Dark
0 comments