

Reflecting on the past year’s journey, our team was on a mission to enhance debugging tools, ensuring they became more efficient and user-friendly. We dedicated our efforts to boosting inner-loop productivity, making external source debugging more seamless, improving overall performance, and optimizing memory analysis. And, of course, we were eagerly listening to the valuable feedback from you, our fantastic Developer Community!
Based on the invaluable feedback we received from our customers like you, it’s clear that the outcome is a noticeably smoother and more intuitive debugging experience in Visual Studio. This post offers an overview of the 2023 updates, allowing you to catch up on any enhancements you might have missed. Join us in celebrating the strides made in refining and optimizing the debugging journey throughout the past year!”
All features listed below are included in our latest Visual Studio version and are available for both managed and native debugging scenarios unless specified otherwise.
Contents
- Boosting inner-loop productivity
- External Sources Now Smarter and Faster
- Cross-Platform Debugging Support
- Inside Our Latest Performance Upgrades
- In Summary
Boosting inner-loop productivity
Over the past year, we have dedicated substantial efforts to introducing features that not only enhance the ease of your debugging but also significantly boost productivity.
Breakpoint Groups
You can easily improve your debugging efficiency in complex scenarios by using Breakpoint Groups, which minimizes the need for repetitive scrolling and toggling of individual breakpoints. You can create, organize, and toggle breakpoint groups to enable/disable.
Explore further details in our earlier blog post and demo: Breakpoint Groups in Visual Studio
This feature was inspired by the Developer Community suggestion: Allow creation of breakpoint groups – Developer Community
Enhanced Text Visualizer
The upgraded text visualizer is now loaded with extra tools for string manipulation like URL Encode/Decode, Base64 Encode/Decode, JWT Decode.
Non-modal Visualizers
Managed Tabular Visualizers (DataSet and IEnumerable) and String Visualizers (managed and native) are now non-modal, letting you interact with the Editor concurrently. You can have multiple visualizers open at once and choose to float or dock them as you like.
This feature was inspired by the Developer Community suggestion: Make IEnumerable Visualizer window non modal – Developer Community
This feature is currently only available in our latest Preview version Download Visual Studio 2022 Preview
Call Stack Search
You can find relevant call stack frames fast by typing search terms in the top-left corner of the call stack window. The matching frames will be highlighted for easy identification.
Explore more: View the call stack in the debugger | Microsoft Learn
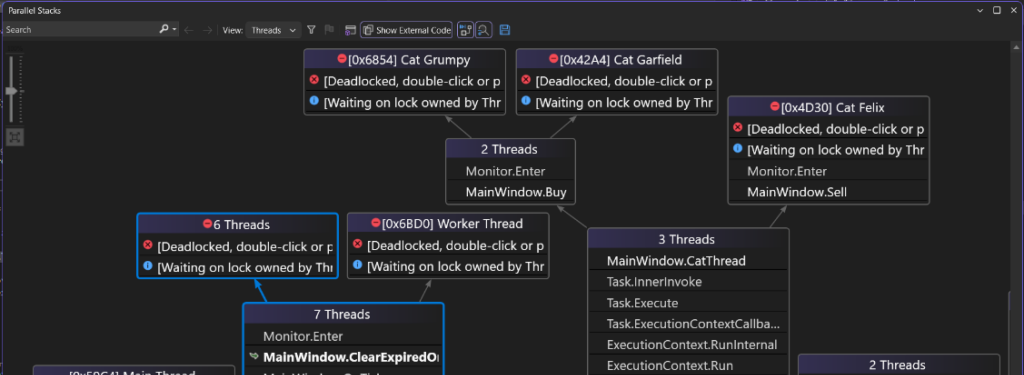
Parallel Stack Window Improvements
The Parallel Stack Window introduces filtering options for focused frames and threads, enhancing clarity and efficiency. Additionally, you can now drag select frames, enabling easy batch operations like copy/paste, flag/unflag, or freeze/thaw.
Furthermore, both parallel and call stack windows show indicator icons for critical scenarios such as deadlock or blocked threads.
Explore further details in our earlier blog post: Parallel Stack Window tips you need to know
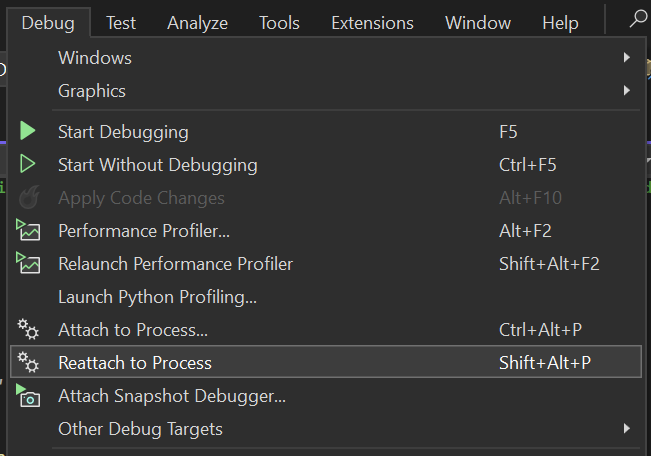
Persistent Reattach To Debugger Process
The reattach to debugger process is now persistent to the solution/project across sessions. So, you can reattach to processes that you were previously attached to, even after you open a new VS session.
Debugging with Step Filters on a Project Level
We added project-wide support for .natstepfilter and .natjmc files, in addition to the existing support for .natvis. This means you can seamlessly integrate native step filter files (.natstepfilter) into your C++ project. As a result, sharing your debug setup becomes a straightforward process.
Learn more: Debugging with step filters on a project level
Cmake Debugger
In version 17.6, we introduced a CMake debugger that will assist you in debugging your CMake scripts and CMakeLists.txt files for any CMake project.
Read more about this in our previous blog: CMake debugger allows you to debug your CMake scripts and more
External Sources Now Smarter and Faster
VS Debugger now seamlessly auto-decompiles external .NET code, allowing easy navigation, debugging, and setting breakpoints in the decompiled code, enhancing your development experience. As an added benefit you will also notice that de-compilation of large modules is up to 10 times faster.
- Explore further details in our earlier blog post: Elevating Debugging with Auto-decompilation and External Sources
Additionally, external source debugging now supports automatic de-optimization of release binaries and external code as you set breakpoints and step through the code. Only the code that you stop will be deoptimized, so the rest of the application should run speedily This brings advantages like reduced errors in locals, watch, and immediate windows, along with a smoother code navigation experience while stepping through the application.
Cross-Platform Debugging Support
We also added some additional support for cross-platform debugging scenarios.
Debugging Linux apps in VS Integrated terminal
You can now debug your C++ Linux Console applications from the Integrated Terminal. With the Linux Console embedded in the Integrated Terminal, you can seamlessly debug your applications, enjoying a fully functional terminal-like experience. Read more about this in our previous blog: Debug Linux Console Apps in Visual Studio’s Integrated Terminal
Deploying and debugging on remote targets
From version 17.5 we added the ability to deploy and debug on remote Linux targets. A typical use case for this is building an application on your development machine, and then deploying and debugging it on a less capable target machine. For example, you can build an application locally within a Dev Container for either a Raspberry Pi, and then easily deploy and debug the application on a Raspberry Pi. This functionality is also supported if the build machine is running on native Linux or WSL. Read more about this in our previous blog: Deploy and debug apps on remote targets
Additional Linux Debugging Features
Our Tabular Visualizers like IEnumerable and DataSet are now supported on Unix via SSH, Docker, or WSL.
You can now use Edit and Continue for F5 (with debugger), and Ctrl-F5 (no debugger) scenarios when diagnosing and debugging apps hosted on Linux containers or in Windows Subsystem for Linux (WSL). You can also debug .NET processes in Linux App Services through “Attach to Process.”
Inside Our Latest Performance Upgrades
Lastly, we’ve gone the extra mile to boost our debugging performance. The F5 experience, especially the initial F5 (cold F5), now shows a substantial 5-10% improvement in debugger start-up and process launch time. Read more about this: Visual Studio 2022 – 17.7 Performance Enhancements
There’s a noticeable performance boost for Unreal Editor projects. F5 performance for native projects is substantially improved by optimizing breakpoint setup. Optimizing the PDB loading process for Windows applications results in a remarkable 20% speed improvement in our testing for Unreal Editor projects. Read more about this: Visual Studio 2022 – 17.8 Performance Enhancements
From version 17.5 (Download Latest) onwards, we also introduced the on-disk miss cache for symbols. That means there are no unnecessary symbol server pings for pdb files if the initial search is empty. This enhancement significantly boosts F5 performance if you have symbol servers enabled.
In 17.5 we also introduced “Build Acceleration” which improves incremental build performance. Enabling Build Acceleration can reduce incremental build times by up to 80% for SDK-style .NET projects. Read more about this: Visual Studio 2022 – 17.5 Performance Enhancements
You will also notice a substantial improvement in the debugging experience and performance for std::move and analogous constructs. We achieved this through modifications to the MSVC compiler, aiming to enhance the code generation quality of applications in debug mode. Read more about this: Improving the State of Debug Performance in C++
In Summary
Please explore the latest Visual Studio versions and enjoy all these updates! We’re proud of our progress and can’t wait for what the future holds.
As we keep improving our debugging tools, we’re here to listen to your feedback and add features that make your development experience better. Excited for another year of breakthroughs and increased productivity, thank you very much for joining us on this journey. If you have any thoughts or suggestions, please share them with us on the Developer Community site. Your input is highly valuable to us!
Learn more about these and other features in Visual Studio by checking out additional resources.
- Debugger documentation – Visual Studio (Windows) | Microsoft Learn
- Visual Studio 2022 Release Notes | Microsoft Learn
- Debugging and Diagnostics – Visual Studio Blog (microsoft.com)
Stay connected with the Visual Studio team by following us on Twitter @VS_Debugger, Twitter @VisualStudio, YouTube, and LinkedIn.
I am really wondering what caused the devs to show the current set of information in the Parallel stacks window. Space is taken up by redundant text, the important part of the information is hidden. Those widgets show “[Deadlocked, double click or” and “[Waiting on lock owned by Thr”, what I want to know is the thread id without having to click on the item or hover over it. The “waiting on lock” could be an icon or an symbol.
“external source debugging now supports automatic de-optimization of release binaries and external code as you set breakpoints and step through the code. ”
This sounds amazing. Something I did not believe was technically or theroretically possible…
Does this obviate the need for creating symbols, pdb-files, symbol servers and all that tricky stuff when creating Nuget packages?
If not, could you enhance the debugger to report exactly why it falls back on decompilation some times? It can be very hard to figure out why the symbol files are not being used.
FYI, not all of the links in the table of contents are working.
Thanks for the heads up. They are fixed now.