

There are a number of ways that Visual Studio and Visual Studio Code enable you to interact with remote machines. Both can enable you to connect to a remote machine and use it as a build machine and debug your applications there. Sometimes though your target is not the same as your build machine. For example, for embedded Linux devices you will likely want to cross compiler the application on a more powerful build machine then deploy to the device for debugging. This post is going to demonstrate how to build an application locally in a Dev Container for either a Raspberry Pi 3 or 4, then deploy and debug the application on a Raspberry Pi. The techniques shown here will also work if the build machine is natively Linux or WSL, but to make setup easier we will use a Dev Container.
Raspberry Pi project
For this article we have prepared a simple C++ project that can run locally on Linux, on a Raspberry Pi 3 or 4.
git clone https://github.com/robotdad/raspi-cpp-devcontainer.git
The main.cpp simply prints the name of the host system to the output and waits a few seconds before continuing. Using CMakePresets.json we have provided a linux-debug configuration for building the app to run on the Linux host machine. There are also pi3-debug and pi4-debug configurations that use the cross compilers for those devices. The output from those configurations will only run on the Raspberry Pi they are configured for.
To ensure the correct compilers are available the Dockerfile used with the Dev Container has all of the dependencies specified. It also uses Ubuntu 20.04 as the Raspberry Pi OS we are using is based off of Debian Buster. This ensures that we have a glibc version for our build machine that matches the target machine which is necessary to debug the application.
Using Visual Studio to target a Raspberry Pi
From Visual Studio 2022 17.5 open the folder where you cloned the project locally. Visual Studio will prompt you to reopen in a Dev Container, do so unless you are configuring your WSL or Linux environment with the prerequisites found in the .devcontainer\Dockerfile.

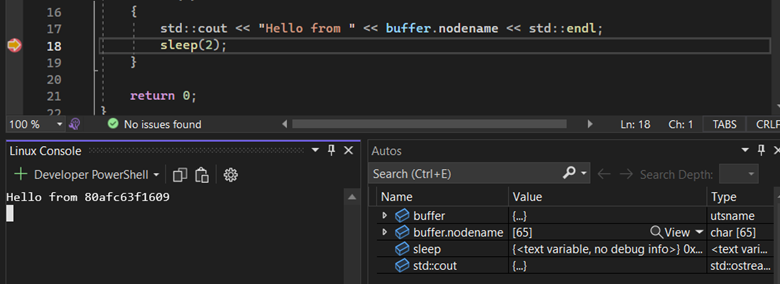
Once the Dev Container is up select the Linux Debug preset configuration and the Debug target “Hello build machine” in the toolbar. The debug configuration is provided by the .vs/launch.vs.json that is part of the project.

This will build the application to target the local build environment, then launch the application under debug. You can set a breakpoint on the sleep statement. The Linux Console will open for output, and for a Dev Container the output will be similar to the below.
Now change your preset configuration to be either Linux Pi 3 Debug or Linux Pi 4 Debug depending on which device you have. Select the “Hello Pi” debug configuration that is provided by the .vs/launch.vs.json that is part of the project.

Before debugging add your Raspberry Pi to the Connection Manager. From the toolbar select the Target System dropdown and select Manage Connections.
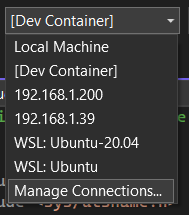
Here you can add your Raspberry Pi or remote Linux connection (note that IP address is more stable for the Raspberry Pi 3). Once this information is saved you need to set the remoteMachineName option to the connection you just added in the launch.vs.json. You can get to this file from Debug menu or right clicking the CMakeLists.txt in the Solution Explorer and selecting Debug and Launch Settings.
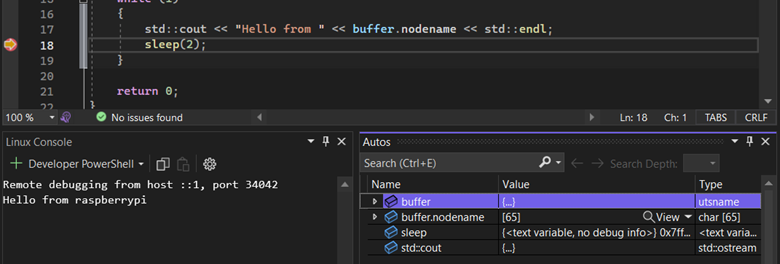
Once your remote target is configured start the Hello Pi (Remote Debug) target. The build will run in the Dev Container, the output will be deployed to the target, and a gdb connection will be established. The Linux Console will open to display output and will appear similar to the below.
Using Visual Studio Code to target a Raspberry Pi
In VS Code you will want the CppTools and Remote Containers extensions installed, they will likely be suggested if not installed already. From open the folder where you cloned the project locally. VS Code will prompt you to reopen in a Dev Container, do so unless you are configuring your WSL or Linux environment with the prerequisites found in the .devcontainer\Dockerfile.

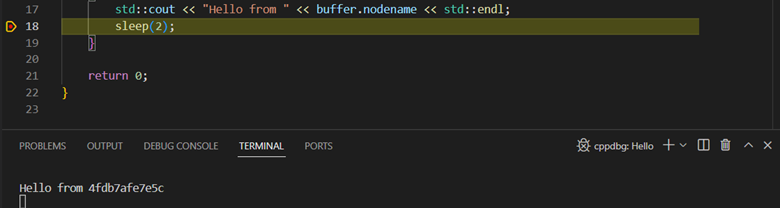
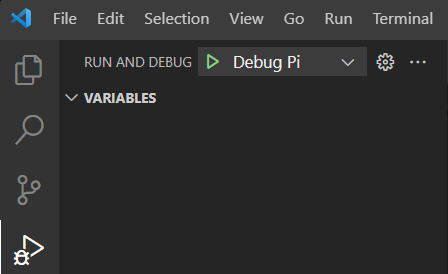
Once the Dev Container is up select the Linux Debug configuration, then you select the Debug target. You can do this from the status bar or the Debug pane.
![]()
Selecting debug will build the application to target the local build environment, then launch the application under debug. You can set a breakpoint on the sleep statement. Output from the application will be in the terminal. For a Dev Container the output will be similar to the below.
Now change your configuration to be either Linux Pi 3 Debug or Linux Pi 4 Debug depending on which device you have.

From the Debug Pane change the configuration from “Debug” to “Debug Pi”. These options are preconfigured in .vscode/launch.json of the project.
When you start the debug session you will be prompted to select a SSH Target.
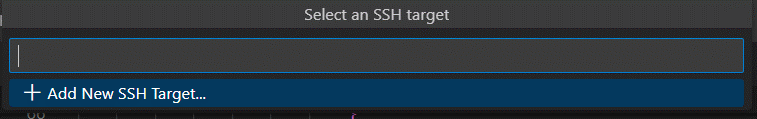
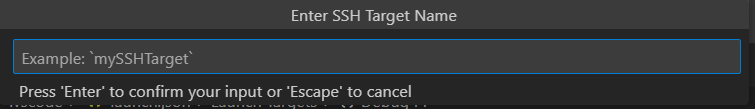
Since this is our first SSH target we need to select the option to add a new one. The first step is to give it a name.
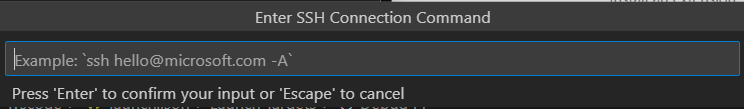
Next provide the SSH command to connect to your Raspberry Pi, for example ssh user@host.
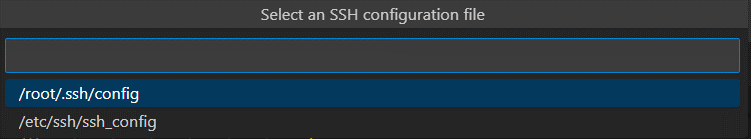
You’ll then be prompted for where to store the SSH connection, either in the user or a global location. In a Dev Container root is the user.
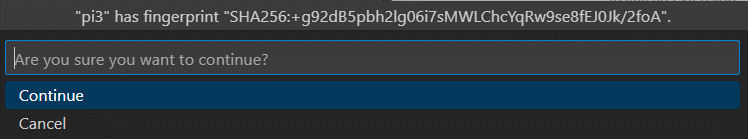
The first time you connect to the device you will be prompted to accept the fingerprint.
Finally, you will need to authenticate the user you selected for the connection.
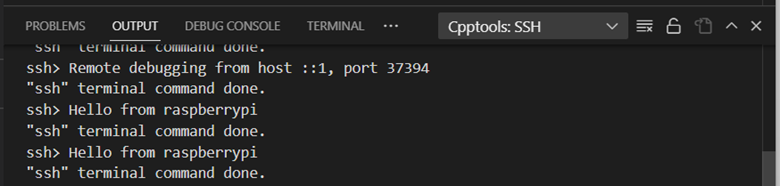
When the debug session starts the output for the remote SSH connection is in the output pane for Cpptools:SSH.
The SSH connection can be found in the Debug panel CPPTOOLS: SSH TARGETS. If you have more than one they will be enumerated here and you can change which one is active. You can also start a terminal session to the SSH connection.

Send us your feedback
We hope that these new capabilities will enable you to choose Visual Studio and Visual Studio Code for your C++ development needs and make you more productive. We are very interested in your feedback to continue to improve this experience. The comments below are open, or you can find us on Twitter (@VisualC), or via email at visualcpp@microsoft.com.
I love the ability to remotely debug my program running on a Raspberry Pi4 from the Visual Studio environment on my windows machine.
The problem I've not figured out is when my program needs to run with elevated privileges. I'm writing a program that needs to enable Bluetooth LE scanning and to do that requires root privileges or at least elevated network access.
I can assign the needed privileges to the executable as part of the build step by having a remote Post Build Event "sudo setcap 'cap_net_raw,cap_net_admin+eip' $(RemoteTargetPath)" but while that works for explicitly running the program after it's built,...
To run with elevated privileges the debug process is also going to need to be elevated. Not great for a shared system, but you could try creating a new connection manager entry for the target that authenticates as root.
Thanks for the suggestion. It’s all part of why I have a “development” Pi that’s separate from where I run most things I want on a Pi. In theory I can trash the system easily and rebuild it fresh. In reality it’s just like any other system that’s been running for a while. I’ve forgotten what changes were made to get it to the current state.
If I further understood the black magic that makes remote debugging possible, I might be able to give the right privileges to the debugger but that’s probably an involved post in itself.