Visual Studio has been supporting external sources debugging and decompilation for some time now. However, with the release of Visual Studio 17.7, the debugger took a significant leap forward by introducing Auto-decompilation for .NET libraries making the external code debugging in Visual Studio much more streamlined and effortless. Its integrated decompiler, it decompiles external code in real-time and seamlessly incorporates it into the debugger as needed.
In this article, we’ll investigate the Auto-decompilation feature of Visual Studio, highlighting its significance in debugging and engineering external code.
Exploring Auto-decompilation and Its Inner Workings
Visual Studio’s debugger leverages the ILspy decompiler engine. It helps to transform compiled binary code (machine code) back into a higher-level programming language, such as C#. This means developers can examine, troubleshoot, and fix issues in the external code with ease, as if they’re working with their own code.
Imagine Auto-decompilation as a backup plan for Visual Studio’s debugger when it comes to External Source code: it first searches for local external sources on your machine, then uses Source Link or Source Server info from PDB files to load the source code. If all else fails, the debugger decompiles the code for presentation.
While the auto-decompilation feature in Visual Studio boosts productivity for debugging, .NET package authors have total control over whether they want their work decompiled. This can be accomplished by implementing the SuppressIldasmAttribute attribute within an assembly or module, effectively preventing Visual Studio from initiating the decompilation process. Although the attribute is obsolete in .NET 6+, Visual Studio honors the attribute.
Even the best things have certain limitations. It’s not uncommon to encounter restrictions when trying to decompile .NET assemblies to gain insights. If you’d like to learn more about these please see Decompile .NET code while debugging – Visual Studio (Windows) | Microsoft Learn.
Leveraging Auto-decompilation for External Code
Remember the days when loading external code in Visual Studio was a bit like solving a puzzle? You had to manually figure out how to do it from the “No Source Page “. But now, with Auto-decompilation, the debugger does the thinking for you. You can focus on perfecting your code, and the debugger ensures you have the external code pieces you need, right where they should be in the solution explorer.
Now let’s see the ways we can make the most of decompilation scenarios to boost our efficiency and productivity.
To illustrate this, let’s consider this trivial WPF application. I want to direct your attention to the call stack window located at the bottom. Currently, the call stack within this window is originating only from my local code related to the highlighted line 29 from my code.
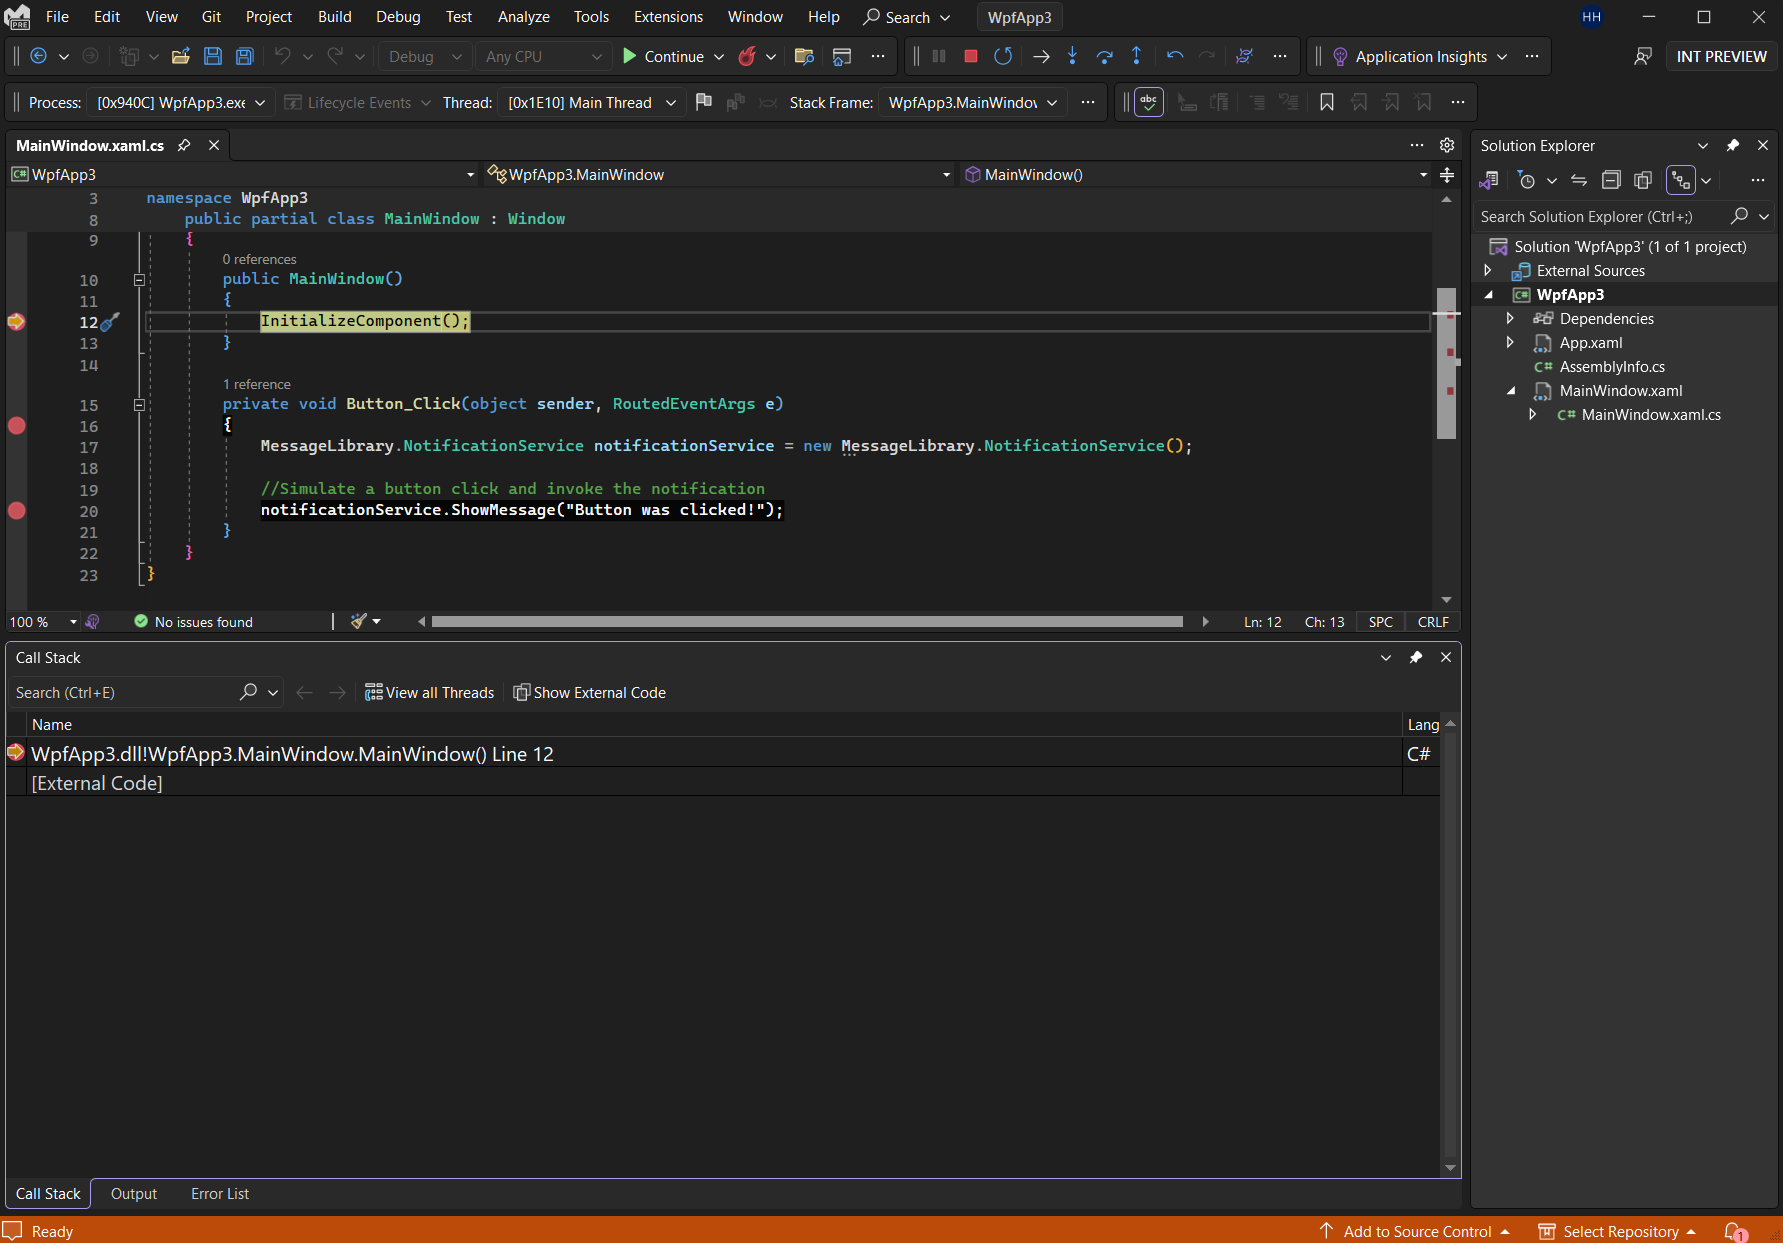
Now, here’s where the exciting part comes in. Up at the top menu of the call stack, you will see an option labeled “show external code.” When this option is selected, the call stack will reveal not just my local code stacks but external code components as well. This external code here is mainly the framework code like PresentationCore.dll , WindowsBase.dll etc.
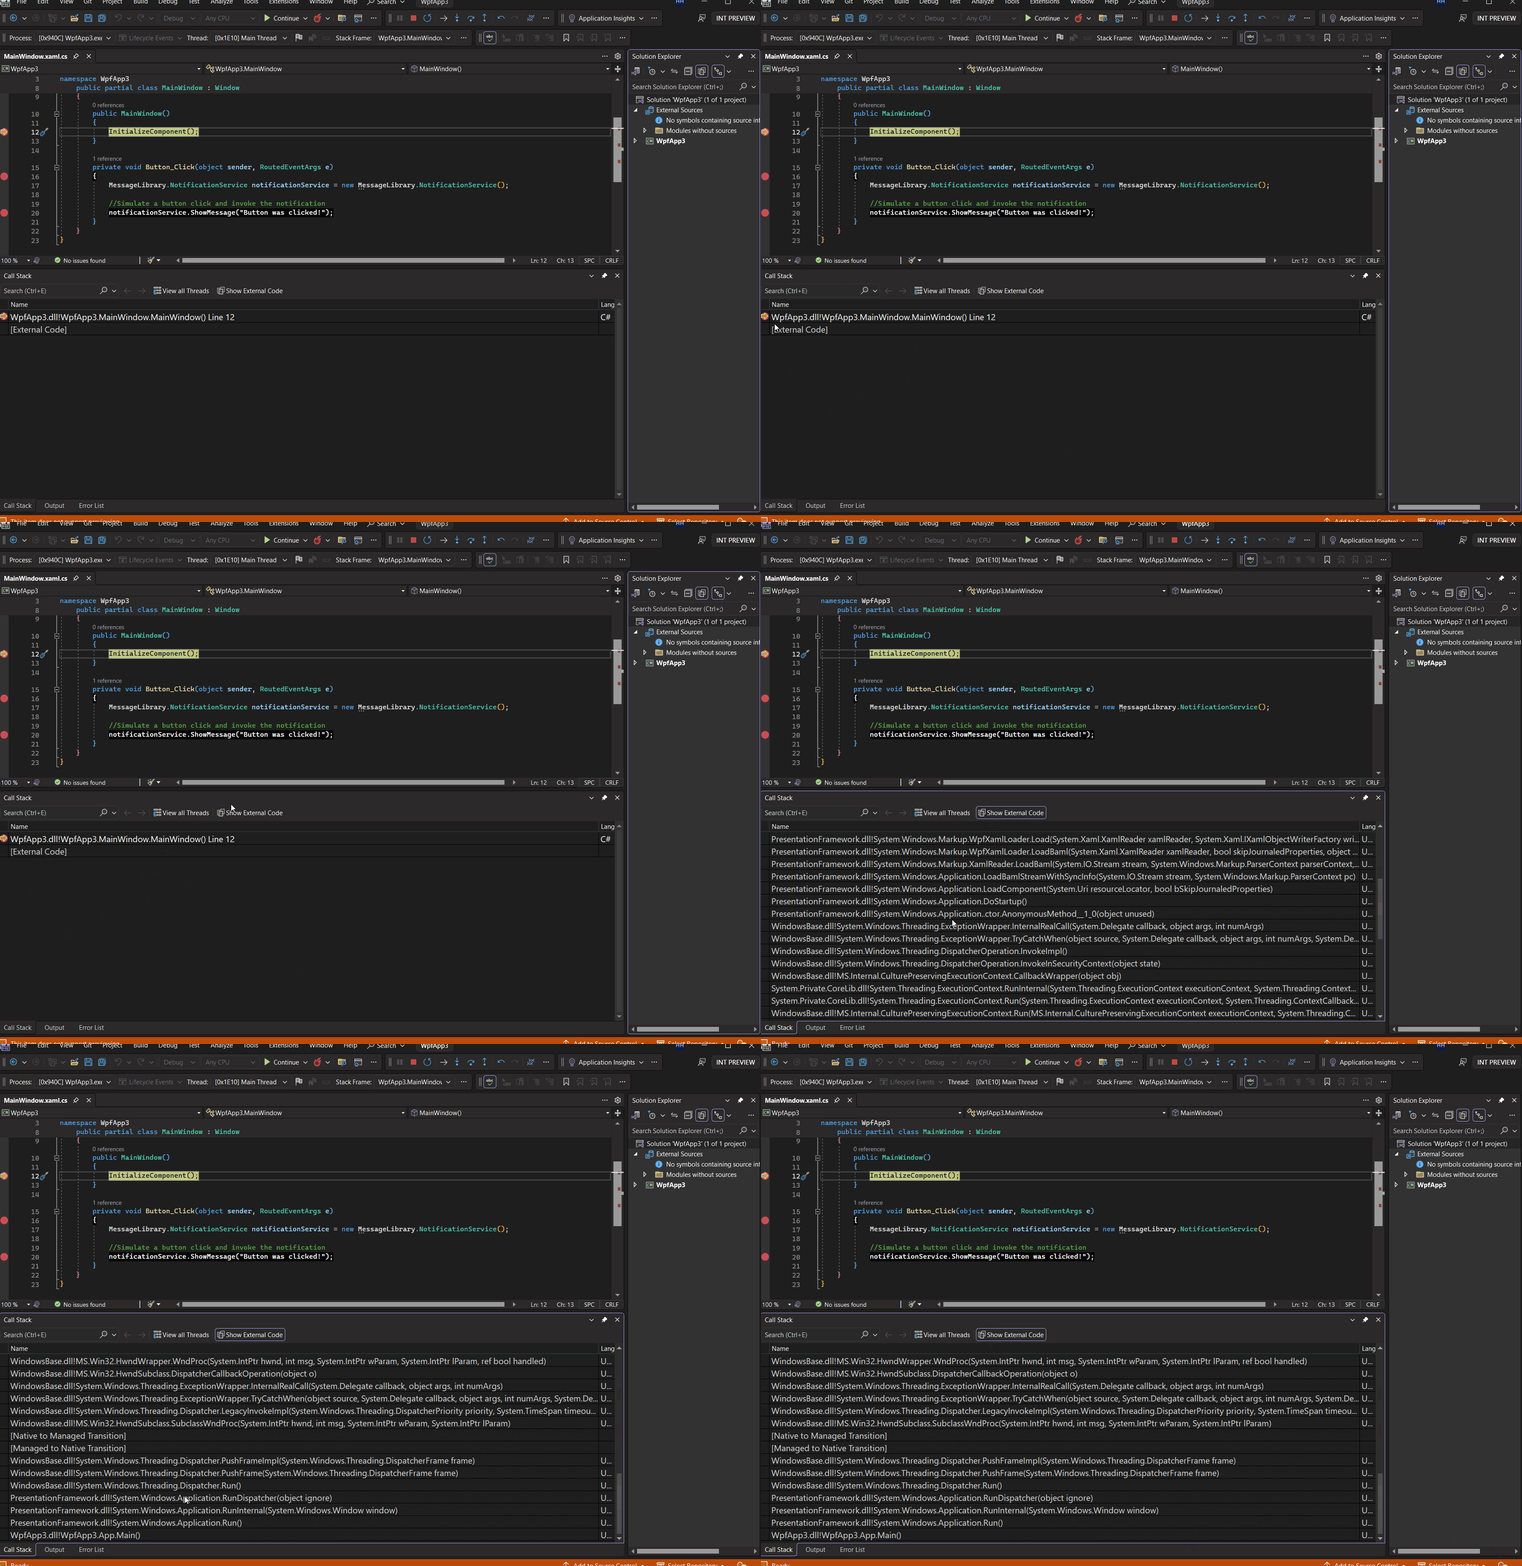
As I click through these call stacks from external code it’s automatically decompiling it for me in a split second. The decompiled code, although not identical to the original source, still offers insights into how various functions and components work.
Navigating and debugging through external code
Continuing our journey, this process goes beyond its initial capabilities. Let’s shift our focus to the solution explorer, where a special node called “External Sources” stands out at the very top when you are in debug mode.
This node acts as a virtual file browser, neatly organizing decompiled external code modules from different call stacks.
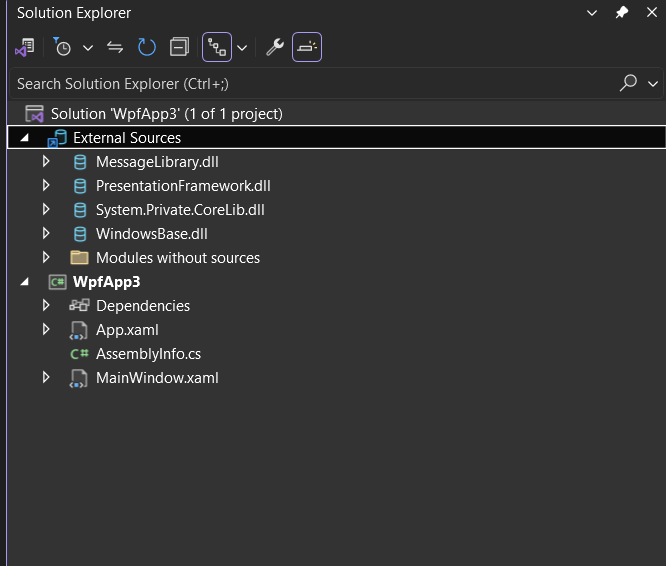
This setup allows me to investigate these external modules and inspect specific sections of code. I can take another significant step forward by placing breakpoints within this external code. This means that, if necessary, I can pause the code’s execution at specific points, just like I would with my own code making the external code debugging as seamless as possible.
For instance, In my WPF app, I use my “MessageLibrary” to show notifications when clicking a button. As shown in the video below, I can smoothly move through the external code, like how I’d work with my own code in the solution explorer. If necessary, I can also set breakpoints and debug through these files.
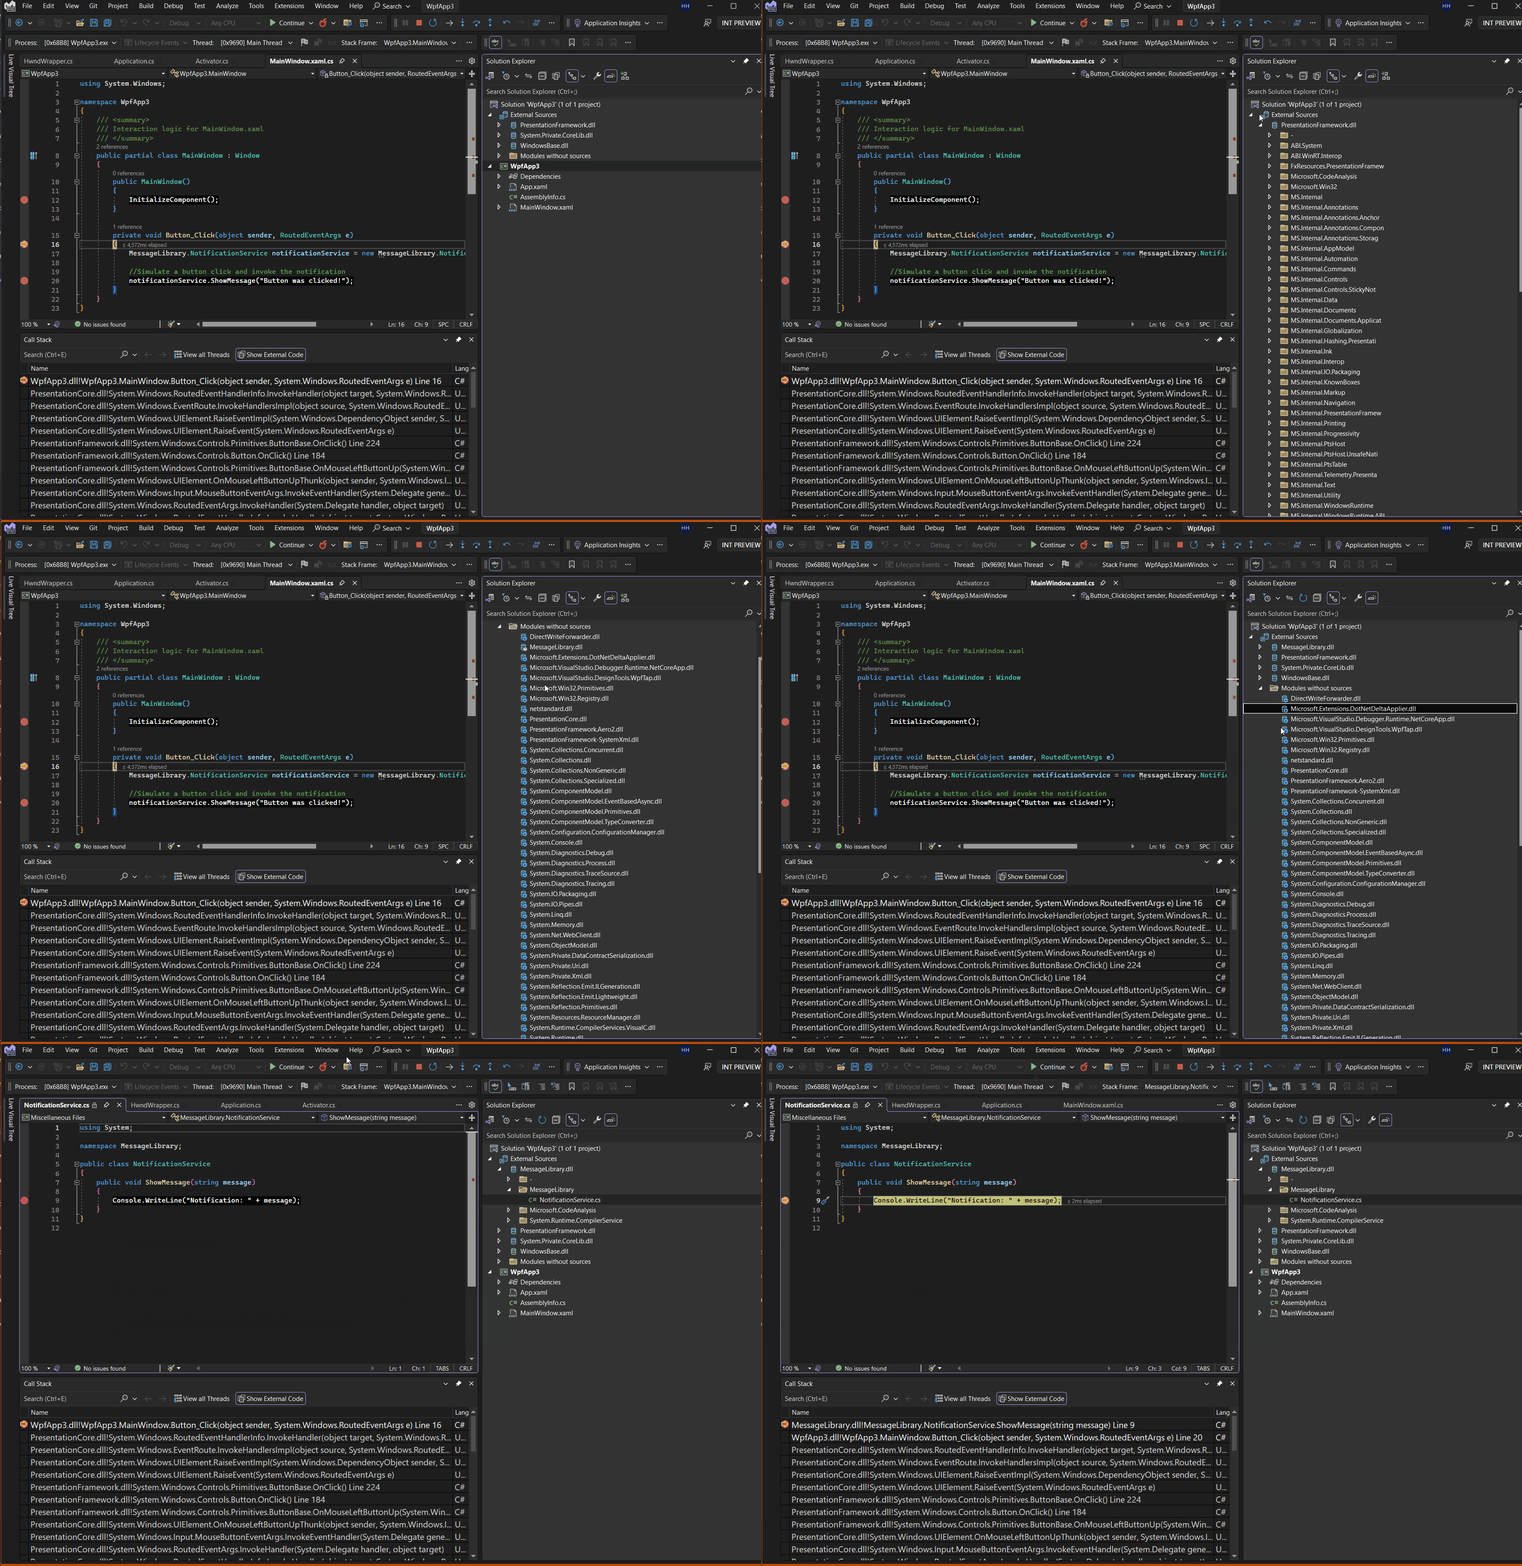
This is especially handy when you’re working with an app that relies heavily on external packages and DLLs. Imagine you’re dealing with a tough bug, and it might be hidden within those external parts. In such cases, having insight into these external pieces becomes a game-changer for effective debugging.
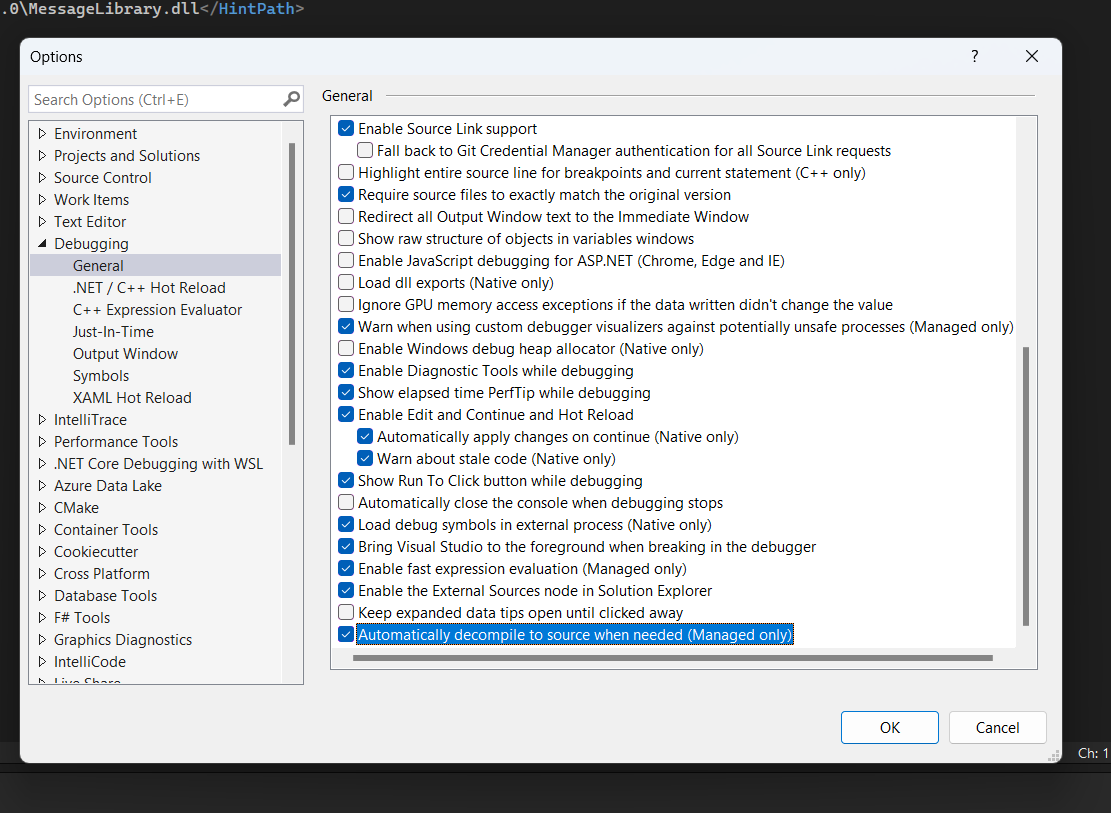
Auto-decompilation is quite useful and can boost your efficiency. But, if for any reason you want to turn off this automatic feature, you can easily do that through the settings option Debug > General> Automatically decompile to source when needed. (Managed only)
Conclusion
To sum it up, the introduction of Auto-decompilation in Visual Studio has completely changed the way we debug external code. We’re really curious to know what you think about this new experience. If you have any thoughts or suggestions, please share them with us on the Developer Community site. Your input is highly valuable to us!


I consider automatic decompilation a nice fallback when nothing else works.
But for Nuget package debugging, I wish there was a way to switch to projects on the fly, so you could debug and change code in one go. Then switch back to packages when you are done (I am aware of DotNetTools, but that solution is outside VS and does not work perfectly.)
Also, I would like more help from the IDE when debugging Nuget source code (from .pdb or SourceLink) fails, and it falls back on decompilation.
It is really difficult to figure out, and seems fickle in general....
This is a pretty cool feature that I like. It is much simpler than the old process of loading the .NET source from symbol servers.
While I understand that it is disassembling the underlying code and so it is not a 1:1 mapping to the real codebase I do wonder if this is the start of the end for SourceLink. The whole purpose of SourceLink is to give the debugger access to the source to make stepping into the code easier. But if the decompiler can generate the equivalent code then SourceLink becomes redundant. It isn't exactly easy to set...
amen
Awesome
I use this feature all the time… and thankfully, it stopped decompiling the reference assemblies…
often it’s easier and faster to check the source of an assembly function instead of checking the sparse and incomplete documentation