Have you ever encountered an exception in your application while debugging, and wanted to know exactly what the state of the app was at that point in time? Or, you’re debugging async code and you want to know the context in which an exception was thrown? Now, with a new feature in IntelliTrace step-back, you can!
Starting in Visual Studio Enterprise 2017 version 15.7, IntelliTrace will now automatically take snapshots on exception events, in addition to breakpoints and debugger steps. This enables you to go back to a previous exception event and see the state of the application at the time the exception was thrown.
Exception events are the most widely used IntelliTrace event, and we’re excited to be able to address a top customer ask.
Enabling snapshots on exception events
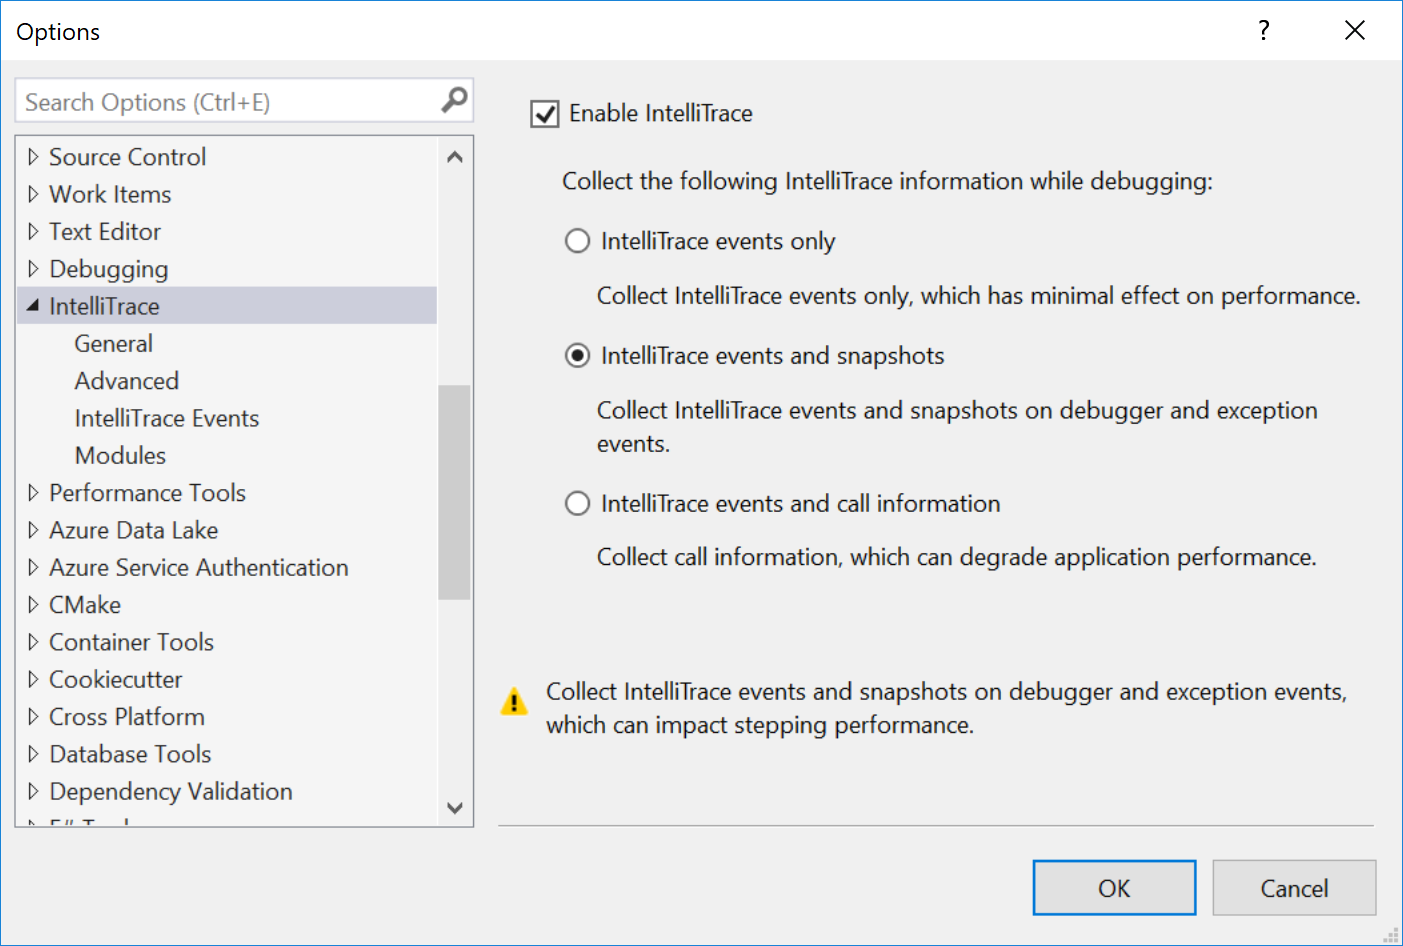
To enable this feature, go to Tools -> Options -> IntelliTrace settings, and select the option “IntelliTrace events and snapshots.” By default, IntelliTrace will collect a maximum of five snapshots on exception events between break states – e.g. between debugger steps or breakpoints. This number can be configured in IntelliTrace advanced settings.
Debugging with snapshots on exceptions
Let’s walk through an example of how we can use this feature while debugging an application.
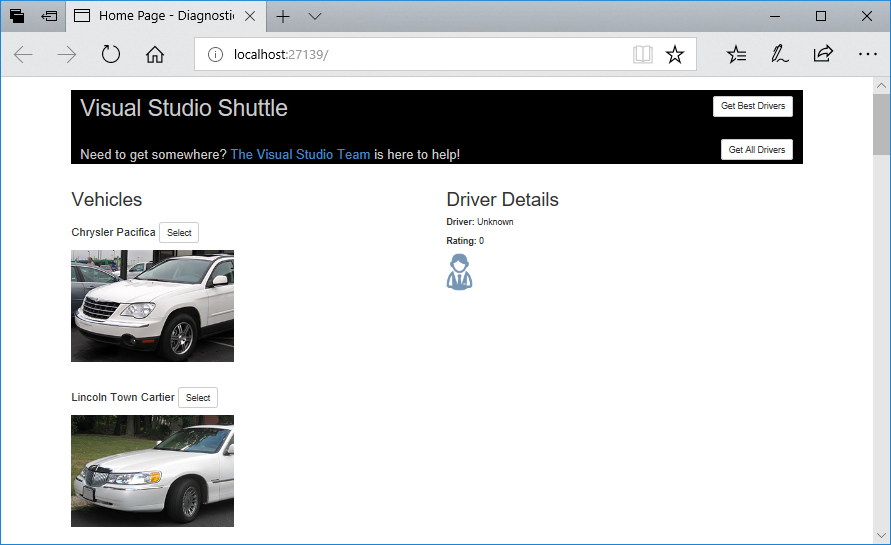
In my shuttle application, I see that when I F5 to debug it, I get an error. The driver details are not appearing as expected.
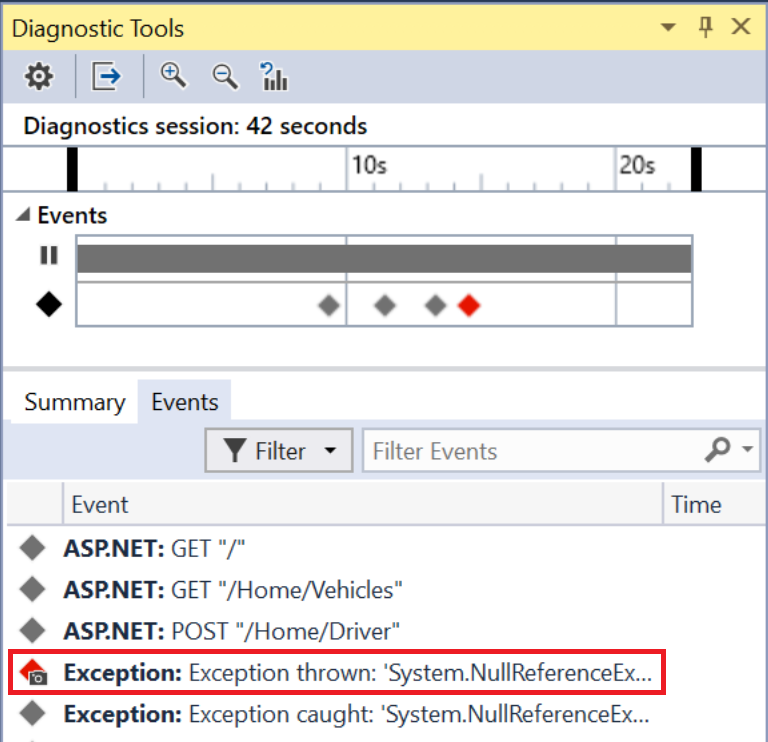
In Visual Studio, IntelliTrace has recorded an exception event in the Diagnostic Tools window. The camera icon indicates that there is a snapshot available.
To view the snapshot, double-click on the event, or select the event and click the ‘Activate Historical Debugging’ link.
Visual Studio is now in Historical Debugging mode at the line of code where the exception was thrown.
From here, you’ll be able to see the historical values of your Call Stack, Locals, and Watches, just as you would in regular, live debugging. You can also evaluate expressions in the Watch Window and hover over variables to see data tips. All these values are populated using the data from the snapshot.
Using this information, I can see from the Locals window that the exact value of driver.name was null. In this query, we should have done the comparison on driver.id.
By changing the query to in line 161 to:
selectedDriver = drivers.Where(d => driver.id.Equals(d.DriverId)).FirstOrDefault();
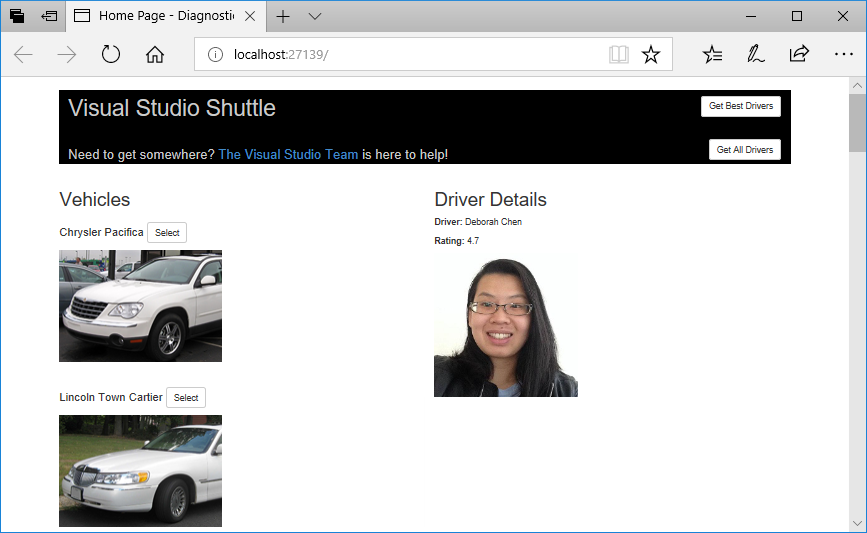
the issue is fixed. Now, the driver shows up!
To minimize redundant snapshots and improve performance, IntelliTrace will only take snapshots on exception ‘thrown’ events under certain conditions. The first time an exception is thrown, IntelliTrace will take a snapshot and mark it accordingly. If this exception is caught and then rethrown or wrapped as an inner exception to another thrown exception – no snapshot will be taken on these events, nor any exception events associated with the original exception. Additionally, IntelliTrace will not take snapshots on exceptions with the same type and call stack as an existing exception event that already has a snapshot.
Try it out
The IntelliTrace snapshots on exceptions feature is available in Visual Studio Enterprise 2017 version 15.7 and requires Windows 10 Anniversary Update or above. The feature is currently supported for ASP.NET, ASP.NET Core, .NET Core, WinForms, WPF, managed console apps, and managed class libraries.
We’d love to hear your feedback. To report issues, use the Report a Problem tool in Visual Studio. You’ll be able to track your issues in the Visual Studio Developer Community where you can ask questions and find answers. You can also make a product suggestion through UserVoice, or email the team directly at stepback@microsoft.com.


Great and useful post.
Thanks for sharing
طراحی سایت