Timing Captures
PIX timing captures record information about when each piece of work was carried out by the CPU and GPU. This data is gathered while the game is running, and with minimal overhead, so you can see things like how work is distributed across CPU cores, the latency between graphics work being submitted by the CPU and executed by the GPU, when file IO accesses and memory allocations occur and so on.
Timing captures display time-oriented data from a variety of sources both from within your title and from the system itself. Data from the instrumentation you’ve added to your code using PIX events and PIX markers will always be displayed. PIX can also be configured to collect and analyze data additional data, such as CPU samples, memory allocations, file accesses, GPU timings and counter data. These additional types of data enable more profiling scenarios, but also increase the overhead of collection.
This implementation of Timing Captures offers several advantages over the deprecated, legacy Timing Captures, including:
- Longer capture durations. Existing Timing Captures allow you to view a maximum of 2 seconds of profiling data. Capture durations are significantly extended in the new implementation. Capturing for durations on the order of hours is now supported.
- Faster capture opening times. New Timing Captures open much more quickly than existing Timing Captures. With larger captures, it’s not practical for PIX to show all the data immediately, but the goal is to show you enough data to get started within a few seconds.
- Improved analysis tools. A Metrics View has been added to Timing Captures to help you analyze the large volumes of data present in larger captures. This new view allows you to graph metrics such as event durations and counter values. Graphing multiple metrics together allows you to see correlations between the performance characteristics of different PIX events and counters in your title.
- Integration of additional data sources. The addition of counter data (both system-defined and title-defined) to Timing Captures enables you to correlate the value of various counters with the code that is executing in your title at any point in time. For example, you can correlate the value of title-defined metrics like “NumEnemies” with the PIX events in your title. Other data types, such as information on memory allocations and file accesses are also provided.
- Numerous improvements to the Timeline. The Timeline view includes numerous usability and navigation improvements. For example, you can now see Core and Thread activity together in one view, and context switches are easier to find and analyze.
Taking a Capture
The Device Connection tab currently includes two buttons for taking Timing Captures. One button is used to take a legacy Timing Capture (deprecated) while the other button is used to take the Timing Capture described in this documentation topic. The ability to take either a legacy or a new capture will remain in PIX until the new Timing Captures contain more of the features the current captures do.
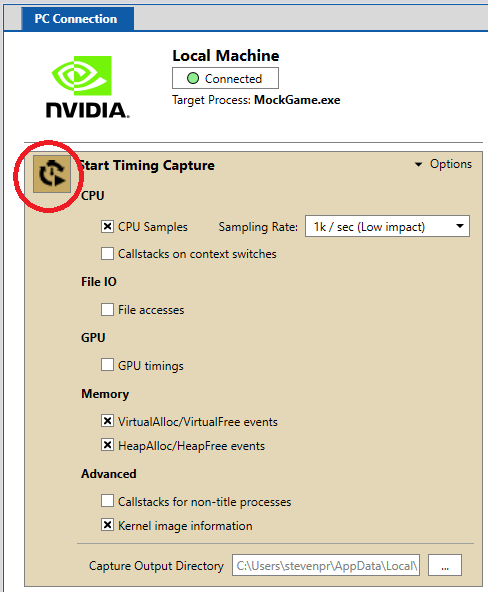
Before starting a new capture, select the types of data to collect in addition to PIX events and PIX markers using the Options pane on the button labeled Start Timing Capture. Options include the collection of:
The Capture Output Directory on your development PC can also be customized. While a capture is running, PIX stores the capture data in a file on your PC’s hard drive. Changing the default Capture Output Directory is useful for a few reasons. The first is available disk space. The size of the capture data can be quite large for long running captures. It’s not unusual to see capture files in the 10’s of GBs or more, for example. If the drive on which the Capture Output Directory is stored may be too small, you may want to change the Capture Output Directory such that it’s on another drive. You may also want to change the storage directory based on the type of disk hardware you have. While not, required, using an SSD to store capture data is desirable from a performance perspective.
PIX requires access to your title’s PDBs to display function information in Timing Captures. See Configuring PIX to access PDBs for CPU Captures for information on generating PBDs and configuring PIX to access them.
After you’ve set your capture options and configured PDB access, select Start Timing Capture to start the capture.
While a capture is running, the graphs in System Monitor are shaded green and the Start button changes to Stop. Pressing the Stop button causes the capture to complete and to open.
Timing Capture Views and Panels
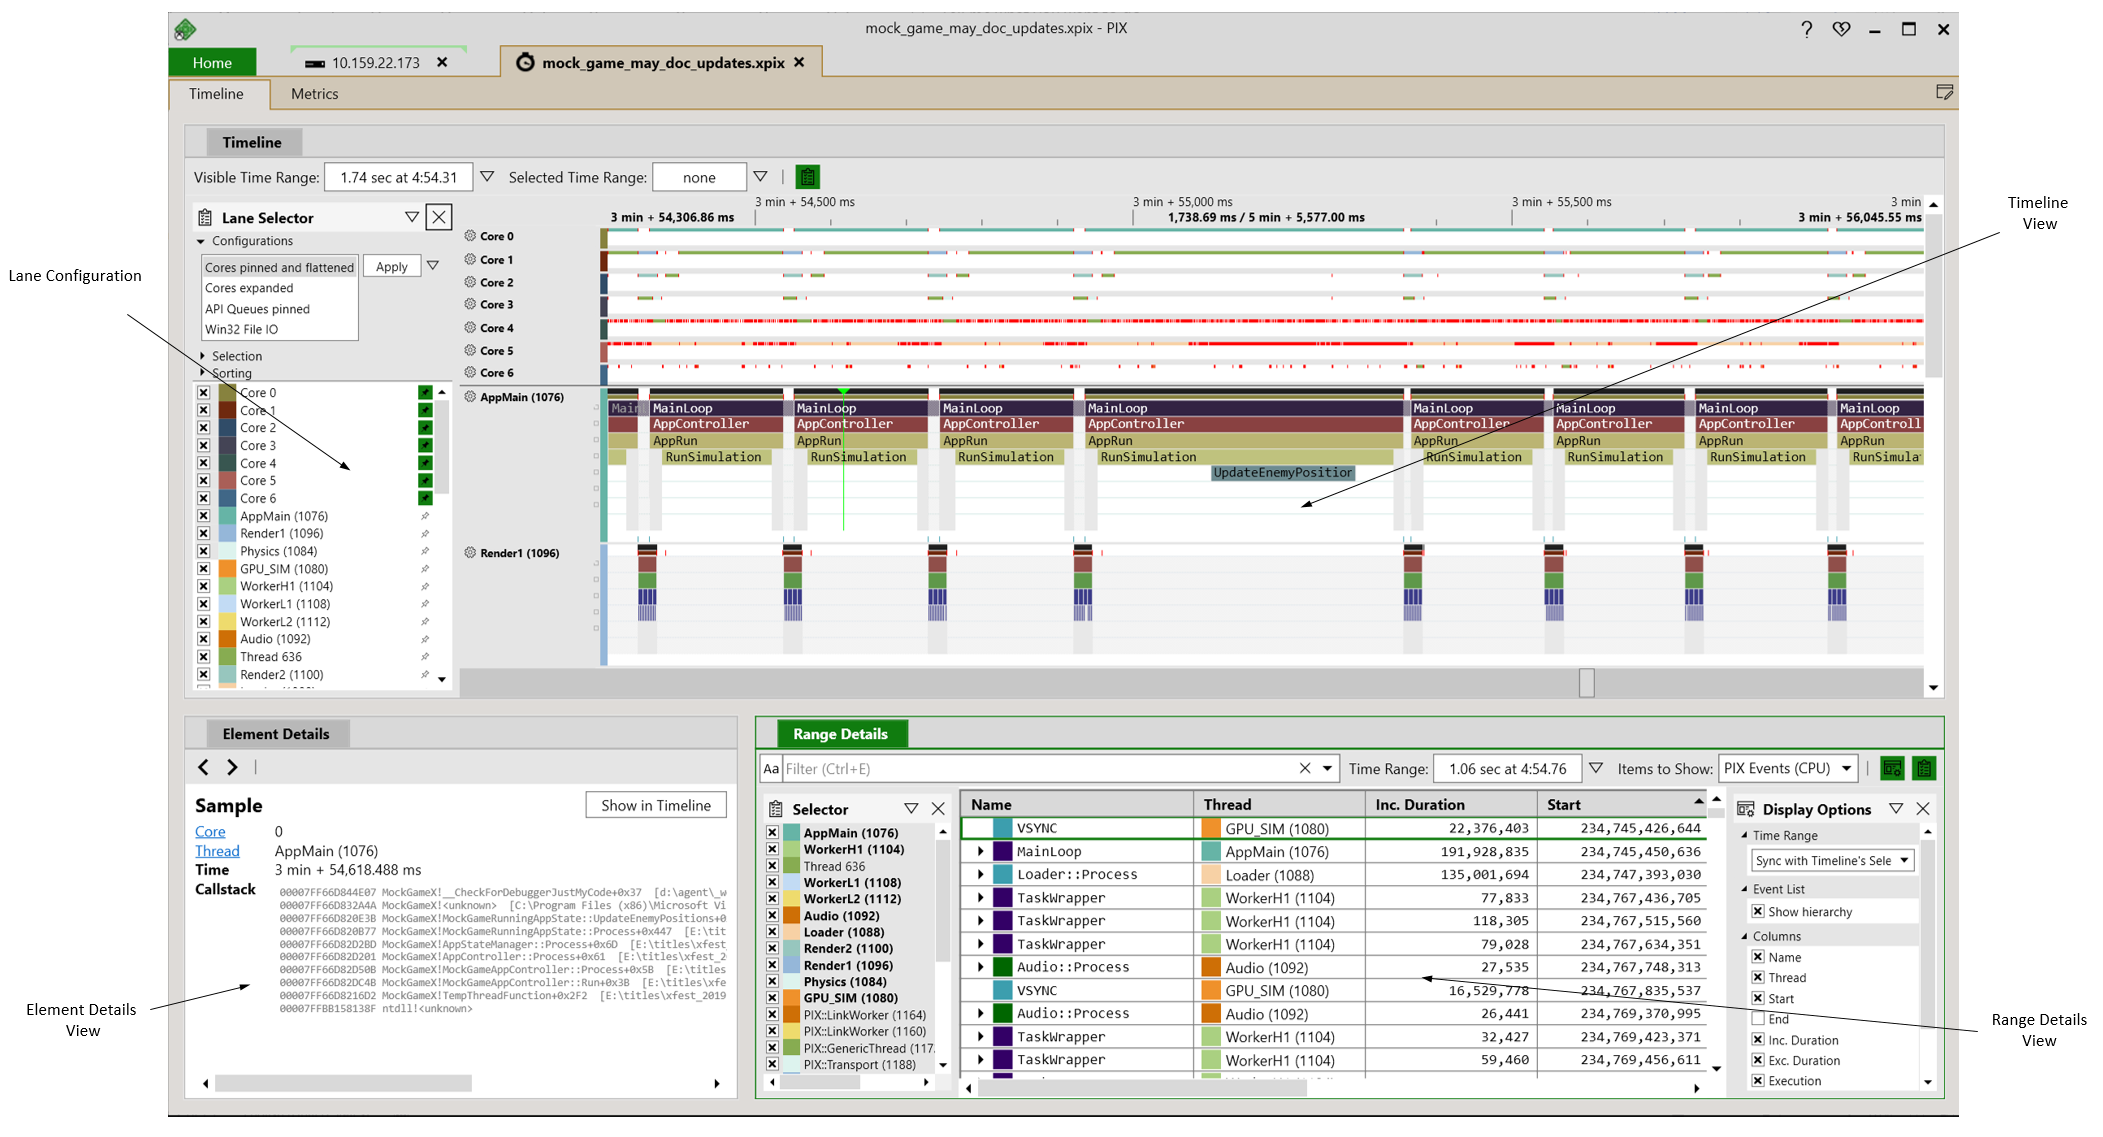
The default layout for a Timing Capture contains several UI views and panels. The Timeline Tab contains the Timeline View, Range Details, Element Details, and Lane Configuration.
- The Timeline View shows a graphical representation of title activity over the duration of the capture. The Timeline displays the profiling data in a series of lanes, each of which is optimized to show a particular type of data. For example, the Core and Thread lanes are optimized to show CPU activity appear, while the API Queue lanes are tailored to show GPU events, GPU work and command list executions, for example.
- The Range Details View shows the data displayed graphically in the Timeline in tabular form for a time range you specify. The Range Details View is useful for sorting by metrics like duration and for quickly navigating through all instances of a particular type of data in a time range.
- The Element Details View provides details about the element that’s currently selected in the Timeline or in Range Details. For example, when a CPU sample is selected, Element Details displays the full call stack for the sample. The Element Details View also allows you to navigate to the selected element in the Timeline or to graph the element in the Metrics View.
- The Lane Configuration Panel is used to customize how the various lane types are displayed in the UI. Several aspects of the UI can be configured, including the ordering of lanes, and how the data in each lane is presented..
The Metrics Tab contains the Metrics View.
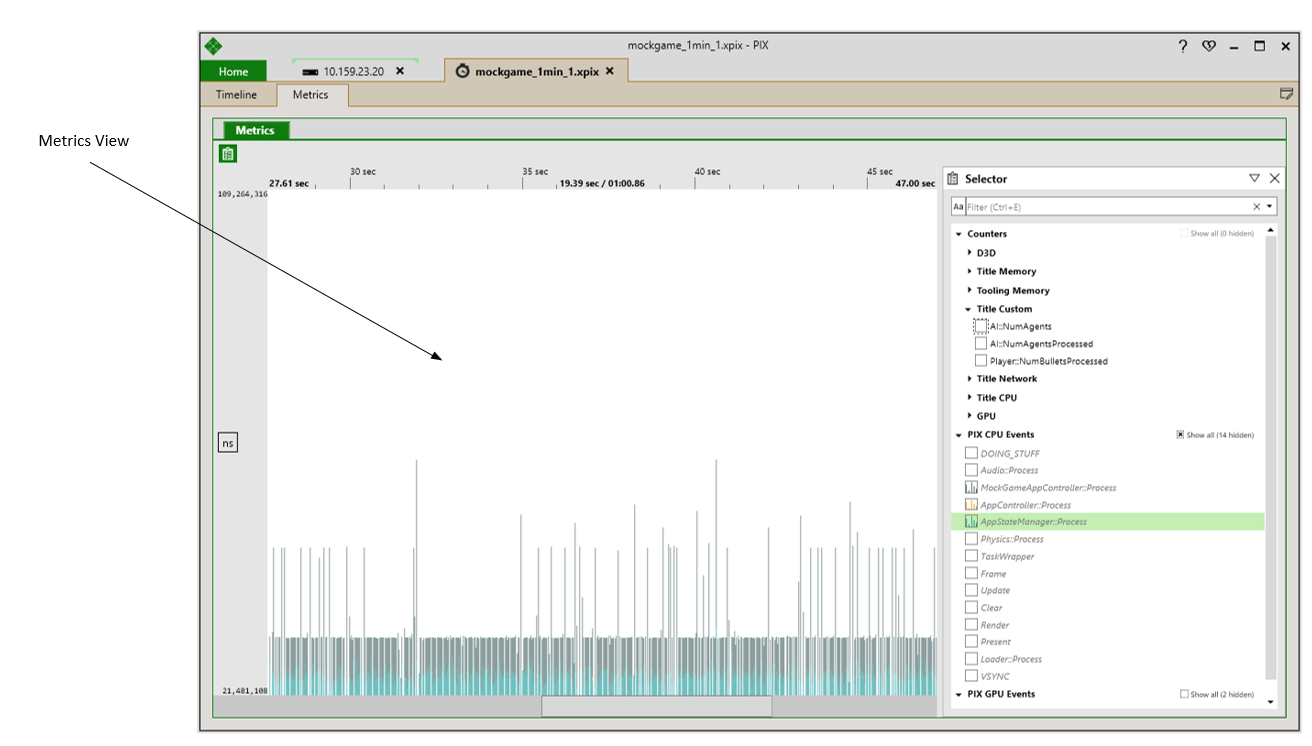
- The Metrics View is a graphical analysis tool aimed at helping you navigate large amounts of data to quickly find and diagnose anomalies in title behavior. The duration of PIX events, and the values of title-defined counters can be graphed to more quickly spot correlations between different aspects of your title.
Timeline View
The Timeline View provides a graphical representation of title activity over the duration of the capture. Time-oriented data is shown in a series of lanes, each tailored to show a particular type of data. The lane types are:
- Core
- Thread
- API Queue
- Win32 file accesses
A ribbon displayed at the top of the Timeline shows the time range of the capture from beginning to end. The following Timeline figure shows a capture that’s just under 59 minutes in duration.
![]()
As you zoom in and out by using Ctrl+mouse wheel button, or scroll horizontally, the ribbon updates to show the portion of the capture you’re currently viewing.
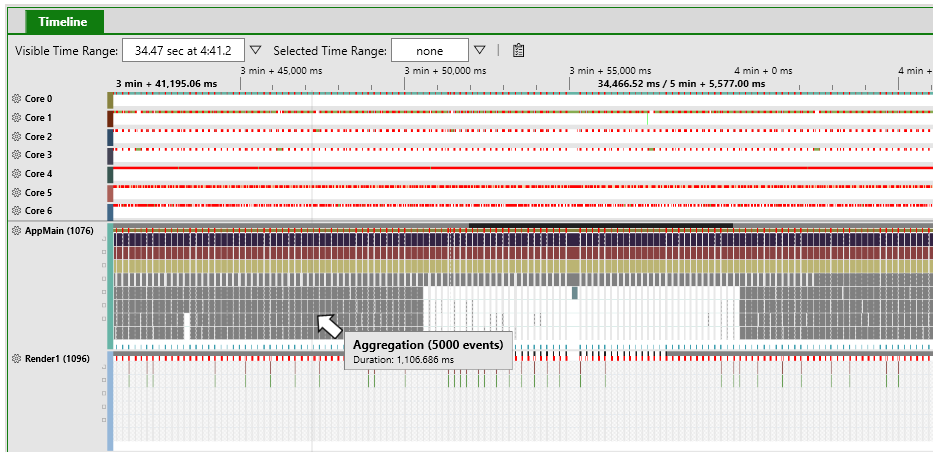
Timing Captures are zoomed all the way out when opened. At this zoom level, PIX might not be able to show all the details, such as every event, context switch, and sample. When this happens, PIX aggregates the data and displays a tooltip, showing you the amount of data that has been aggregated as shown in the following figure.
Zoom in using Ctrl+mouse wheel until you reach the desired zoom level.
Core Lanes
PIX automatically creates one Core lane for each CPU on your PC. Core lanes allow you to see:
- which thread is running on each core at any point in time
- when context switches occur
- CPU events (created by calling PIXBeginEvent)
- CPU markers (created by calling PIXSetMarker)
- CPU samples
- API Markers used to populate GPU command lists
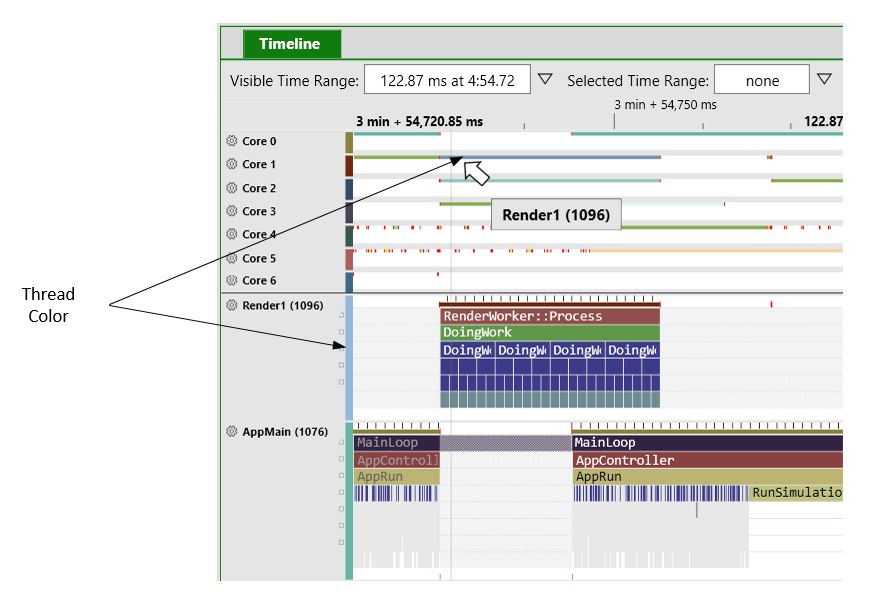
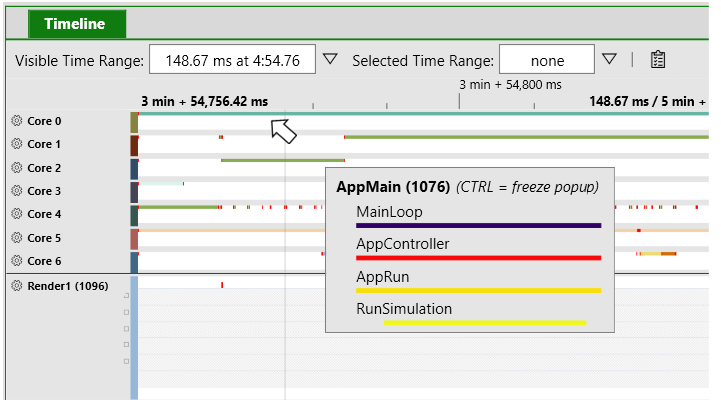
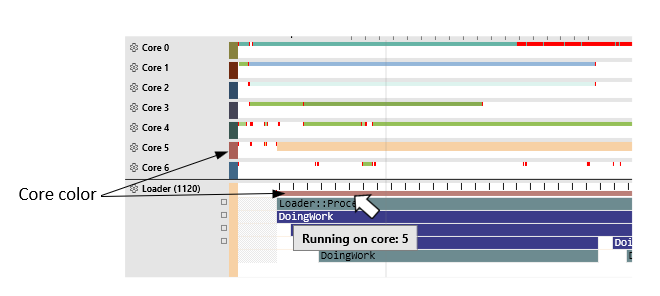
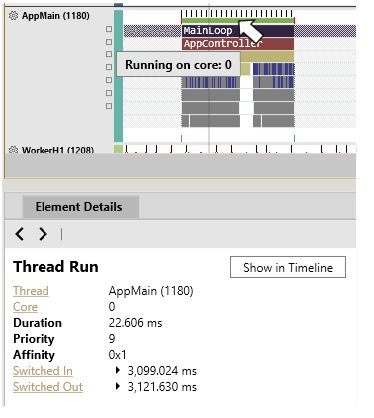
PIX assigns colors to Core and Thread lanes, and uses those colors to help you visualize which thread is running on each core. Hovering over a colored portion of a Core lane causes PIX to display a tooltip that identifies which thread is running. The color displayed on the Core lane matches the color of the Thread lane for the thread that is running on the core.
Sections of the Core lanes that are white indicate that no title code is running at that time. In this case, the tooltip will display the name of the process that is running.
Selecting a colored section of a flattened core lane populates the Element Details view with details about the thread that is running. These details include the name and id of the thread, along with it’s affinity settings and priority.
Hovering just below a colored section of a Core lane displays a tooltip that shows the stack of PIX CPU events running at that time. The colors of the events in the tooltip match the colors that were assigned to the event when PIXBeginEvent was called.
Context switches are identified by red vertical lines on the Core lanes. The following picture shows the context switch on Core 4 from thread LD1 to thread WL2. The tooltip displays some basic information about the context switch. More detailed information is provided in the Element Details view.
Context switches are identified by red vertical lines on the Core lanes. See Analyzing stalls and context switches for more information on identifying when context switches have occurred and what has caused them.
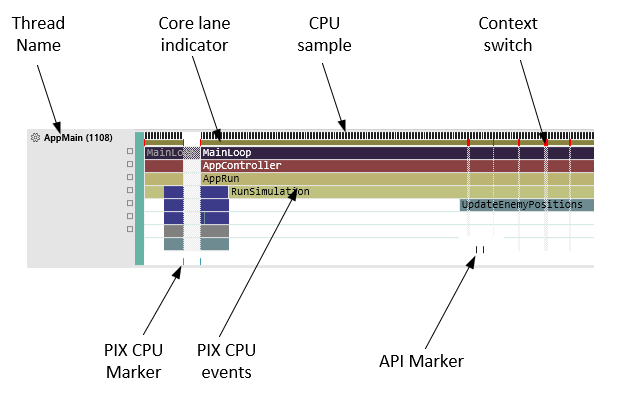
Several aspects of how the Core lanes are displayed can be configured using the Lane Configuration panel. You can choose which types of data to display, whether to display events as expanded or flattened and so on. In the following picture, the Core lanes have been configured to display all PIX events, PIX CPU Markers, API Markers and CPU samples. CPU Markers are drawn as vertical blue lines at the bottom of the Core lane. API Markers are drawn as vertical black lines at the bottom of the Core lane. CPU samples are drawn as vertical black lines at the top of the Core lane and context switches are drawn as vertical red lines.
If a core lane is configured to show PIX events, additional boxes are drawn on the timeline to indicate periods of time when title code is running but is not bracketed with a PIX event, or when another process is running. Title code outside of a PIX event is shown as a white box with crosshatches. Non-title processes are shown as black boxes with crosshatches. The name of the non-title process is shown in box if the zoom level is such that the box is big enough to display the process name.
Thread Lanes
PIX creates one thread lane for every thread running in the title process. Threads are identified in the UI by either their ID or their name. If you name your threads using the SetThreadDescription API, PIX will display the thread’s name in the UI. Unnamed threads are identified by their ID. Assigning names to your threads makes it significantly easier to find them in the capture.
By default, PIX sorts threads for display in the Timeline by the amount of activity occurring on the thread. Threads with a large number of PIX events are sorted above those with relatively few events, for example. You can change this default sorting, along with several other aspects of how the thread lanes are displayed, using the Lane Configuration panel.
Thread lanes show you:
- Which core a thread is running on at any point in time
- When context switches occur
- CPU events (created by calling PIXBeginEvent)
- CPU markers (created by calling PIXSetMarker)
- CPU samples
- API Markers used to populate GPU command lists
The following picture shows how these various types of data are displayed in the lane:
An indication of which core a thread is running on is displayed in a few different ways. First, when hovering over the Core indicator on a Thread lane, a tooltip is displayed identifying which core the thread is running on. The color of the core indicator matches the color of that core in the Core lane.
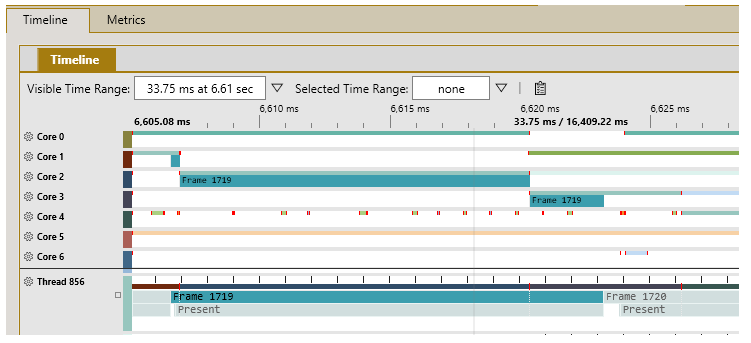
Core information is also shown when you select a PIX event in the Thread lane. When an event is selected, the Core lanes are updated to show where the thread is running. This visualization makes it easy to spot threads that aren’t affinitized to a single CPU core. In the picture below, an event named Frame 1719 is selected in the lane for Thread 856. The Core lanes show that the Frame event starts on Core 1 but also switches to Cores 2, and 3 while it’s executing.
Unscheduled time (time when the thread isn’t running) is shown in the Thread lane using a shaded cross-hatched pattern. Periods of unscheduled time always begin and end with a context switch. Note that the periods of unscheduled time align with periods where the Core lanes indicate that the thread isn’t running as shown in the following figure. See Analyzing stalls and context switches for more information on identifying when context switches have occurred and what has caused them.
The visualization that shows unscheduled time is on by default. The Lane Configuration panel allows you to turn off this visualization.
Selecting the core indicator lane for a period of time in which a thread is running will populate the Element Details view with details about the thread. These details include the thread’s name and id, along with it’s priority and affinity settings.
API Queue lanes
PIX creates one API Queue lane for every DirectX 12 command queue in your title process. API Queue lanes contain three types of data. The top part of an API Queue lane displays PIX GPU Events. These are the events created by calls made to PIXBeginEvent when a context is passed. The middle part of the lane shows the DirectX 12 command list executions that contain the GPU commands. The bottom portion of an API Queue lane shows the GPU work that’s executed on the command lists.
Thread lanes show the API Markers that cause GPU work to be added to the command list as shown in the following figure.
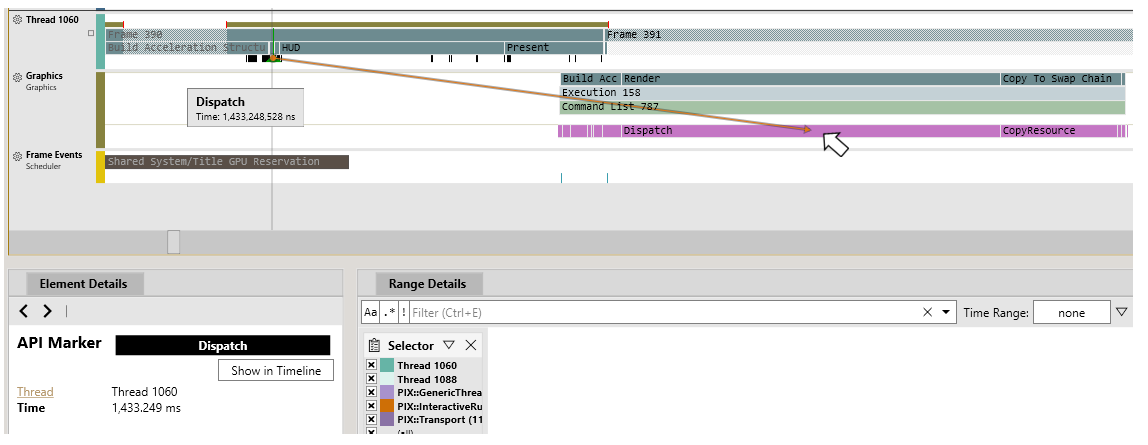
Selecting a PIX GPU event, a command list execution, or a piece of GPU work will cause a correlation arrow to be drawn to the related element in a thread lane. For example, the following figure shows the correlation between an API marker on a thread lane, and the corresponding piece of GPU work on the API Queue lane.
The types of data to display in API Queue lanes can be configured using either the gear icon next to the name of the queue, or by using the Lane Selector Panel. Use these controls to specify which types of data to display. Options to control how the data is display are also provided.
Range Details View
The Range Details view displays a tabular representation of all timing data within a selected time range. Viewing data in a table is convenient for sorting the data based on criteria like start time or duration. The Range Details view also allows you to copy the contents of the table so it can be pasted into other analysis tools like Excel.
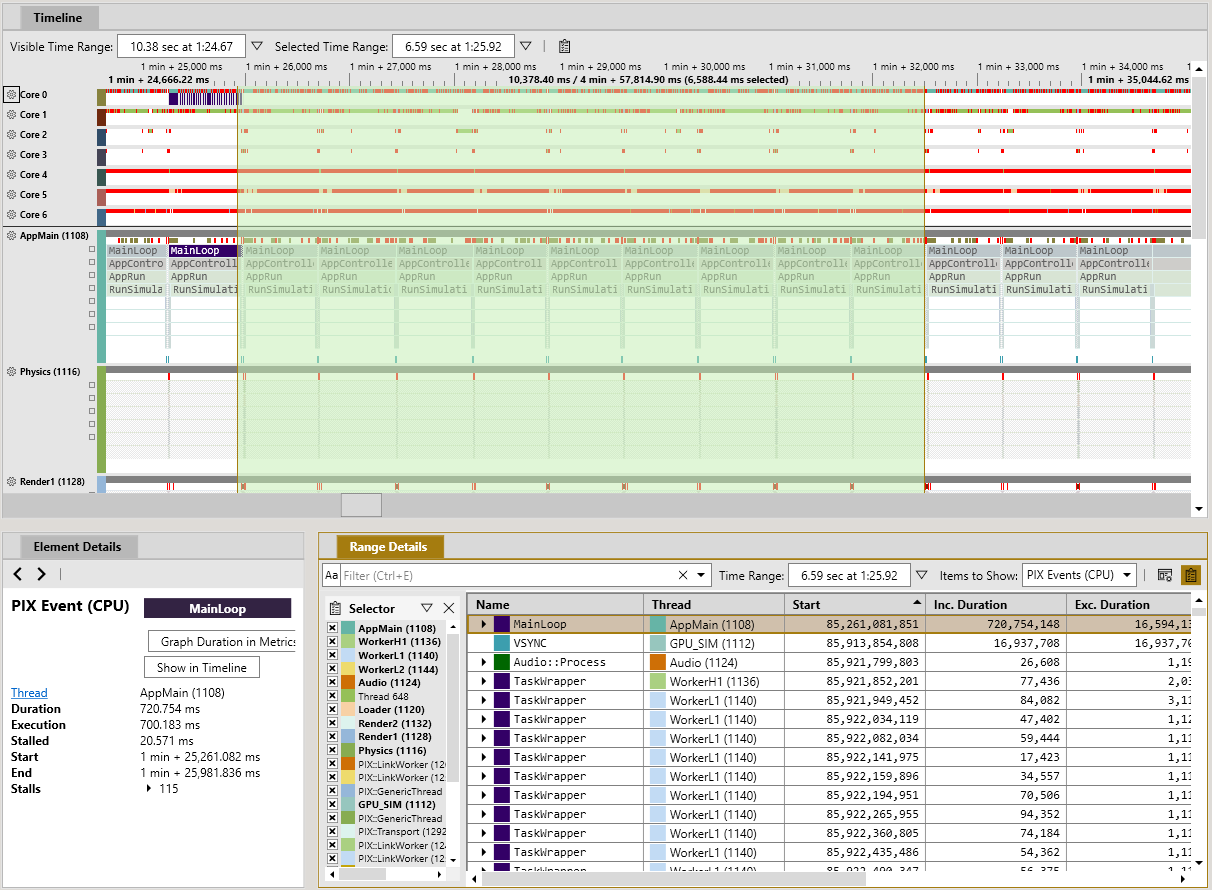
To select a time range, left click an area of the timeline and drag to the right while holding the mouse button down. A green highlight appears to track the range you’re selecting. The ribbon across the top of the capture also updates to show you the duration of your selected range. After releasing the mouse button, the Range Details view is populated with the data from all lanes in the range you selected as shown in the following figure.
A time range can also be specified in various other ways using the options provided on the Time Range dropdown. Options include the ability to enter a time range manually, or to specify a time range as defined by the start and end times of a selected PIX event.

PIX places a limit on the amount of data that Range Details can hold for some data types, such as PIX events. If you select a time range that contains too much data, Range Details will prompt you to select a smaller time range.
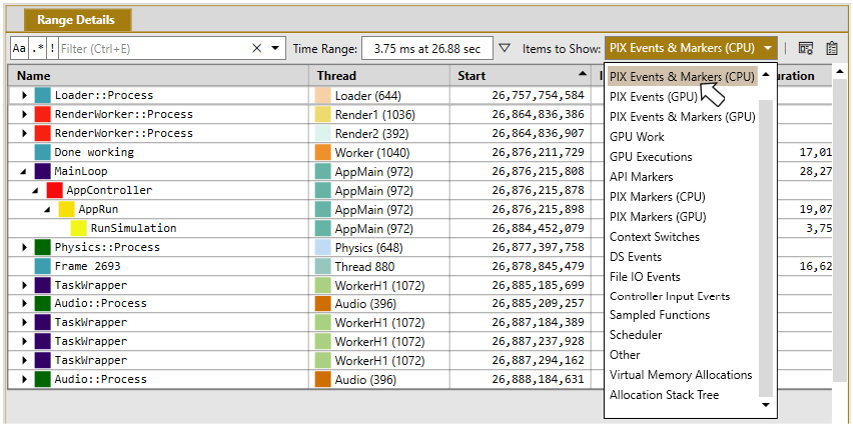
By default, Range Details displays data for PIX CPU events. Other types of data, such as GPU work, file accesses, memory allocations, and others can be viewed by choosing the type in the drop-down list box in the upper-right corner of the view as shown in the following figure.
The following topics provide more detail on some of the more complex data types displayed in Range Details:
- Context Switches. Analyzing stalls and context switches
- File IO Events. Analyzing Win32 file IO performance
- Allocation Stack Tree and Virtual Memory Allocations. Analyzing Memory usage and performance in Timing Captures
The contents of the table can be sorted by clicking on one or more column headers. To sort by more than one column, hold down the Ctrl key while selecting. When sorting by multiple columns, PIX displays a number in the column that identifies the sort order. In the following picture, the table is sorted first by Thread and then by Duration.

The Selector pane on the left side of the view can be used to restrict the data displayed in the table to particular lanes. The contents of the Selector pane changes based on the type of data you’re viewing. For example, when viewing PIX events, use the Selector pane to filter by threads. When viewing GPU work, use the Selector pane to filter by API Queues.
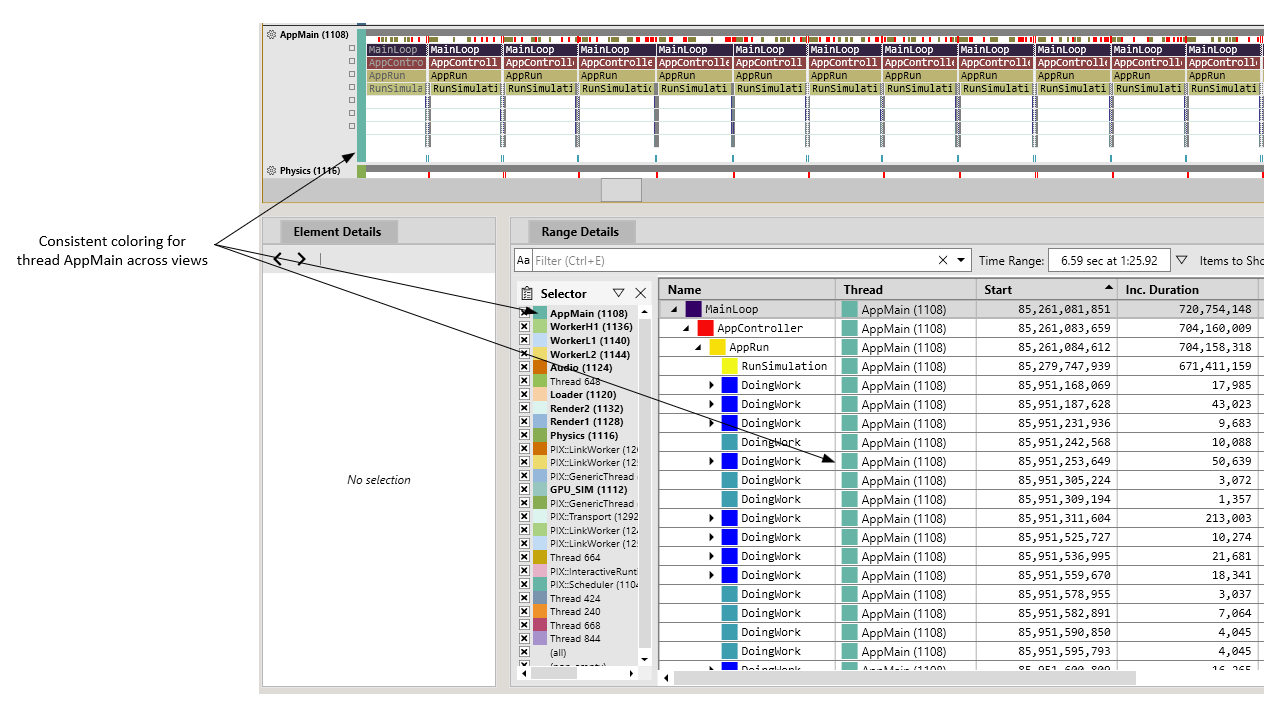
The colors in the selector pane and in the table match the colors of the threads and cores in the timeline. This visualization helps you see the relationships between the data displayed in Range Details and that displayed in the Timeline.
By default, the contents of Range Details remains synchronized with your selection in the timeline. There may be cases where you’d rather keep the contents of Range Details fixed, regardless of the range you have selected. To enabled this behavior, uncheck the Sync with timeline selection checkbox in Display Options.
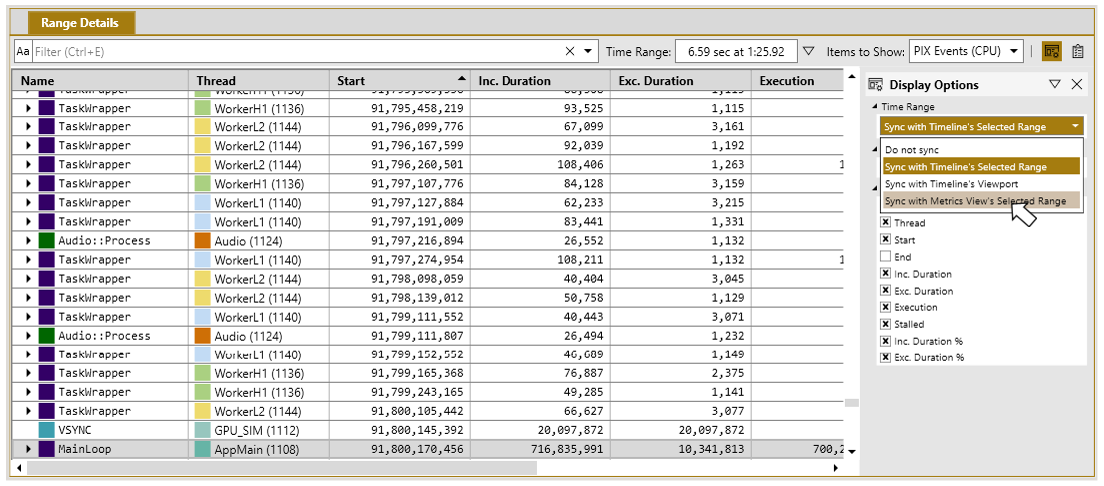
By default, the contents of Range Details remains synchronized with your selection in the timeline. There might be cases where you’d rather synchronize keep the contents of Range Details fixed, regardless of the range you have selected. There may also be times when you’ like to synchronize Range Details with something other than a timeline selection, such as a Metrics view selection. The options for synchronizing the Range Details view are available in the **Time Range** dropdown as shown in the following figure.
Element Details
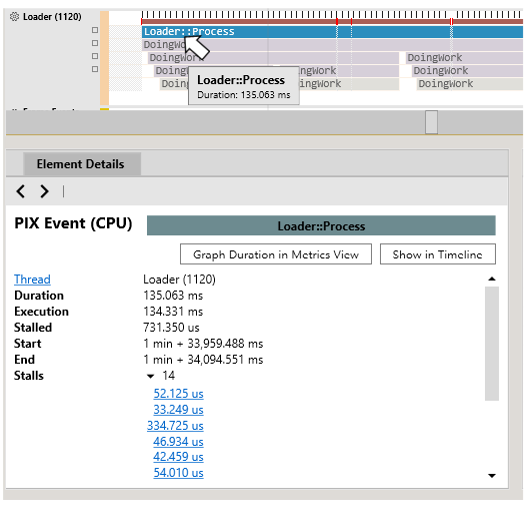
The Element Details view provides detailed data on the currently selected item. The data shown in the Element Details view varies, based on the type of element that is currently selected. For example, Element Details displays data including the thread, start time, duration and number of stalls when a PIX event is selected. A full callstack is shown when a CPU sample is selected, and so on.
Element Details also includes buttons to graph the duration of the selected element in the Metrics view or to jump to the element in the timeline, if applicable.
Metrics View
The Metrics view is a graphical tool that helps you analyze large volumes of data to quickly find areas of interest as they relate to performance, such as outliers in frame time or correlations between different portions of your title.
Various types of data can be graphed in the Metrics view, including the duration of CPU and GPU PIX events, the values of counters reported through PIXReportCounter, and the values of various system-defined counters.
The Metrics view can be accessed in a few different ways. First, various places in the Timeline allow you to graph the duration of a PIX event in the Metrics view. The context menus in the Thread lanes, Core lanes and Range Details provide this capability as does the Graph in Metric View button in Element Details. When one of these options is chosen, the focus switches to the Metrics view and the duration of the selected PIX event is graphed.
The Metrics View can also be accessed by directly selecting the Metrics tab in a Timing Capture. When accessing the Metrics view in this way, the Metrics to graph are typically added using the Selector panel at the right hand side of the view.
Metrics added to the graph using either the Timeline or the Selector panel are considered “active” metrics. The list of active metrics is displayed in the Active Metrics panel located at the bottom of the view. The Active Metrics panel can be used to customize various aspects of how a metric is graphed, including it’s line style and color.
The x-axis in the Metrics View represents time. The ribbon across the top of the view marks time from the beginning of the capture to the end.
The y-axis is the value of the currently selected metric. The units on the y-axis vary, based on the type of data you’re graphing. For example, when graphing a counter such as CPU Usage (Sampled), the units are percentages. When graphing the duration of a PIX event, the units are nanoseconds.
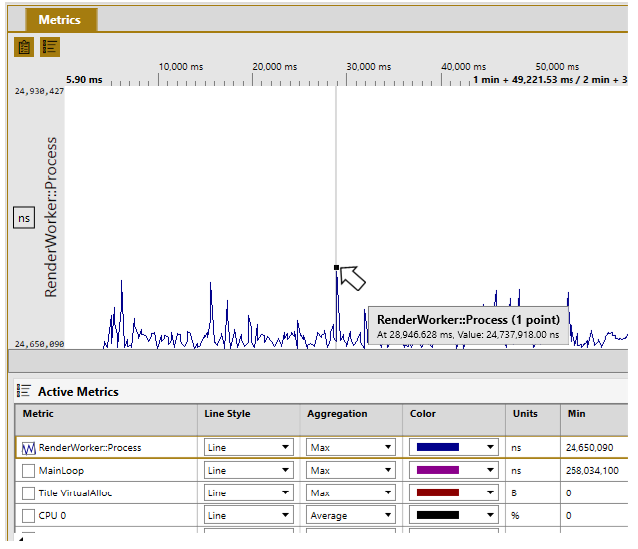
When hovering over a metric in the graph, a tooltip is displayed that shows the name of the metric along with the values of the x and y axes. The min and max values of the y-axis are also updated when hovering over a metric.
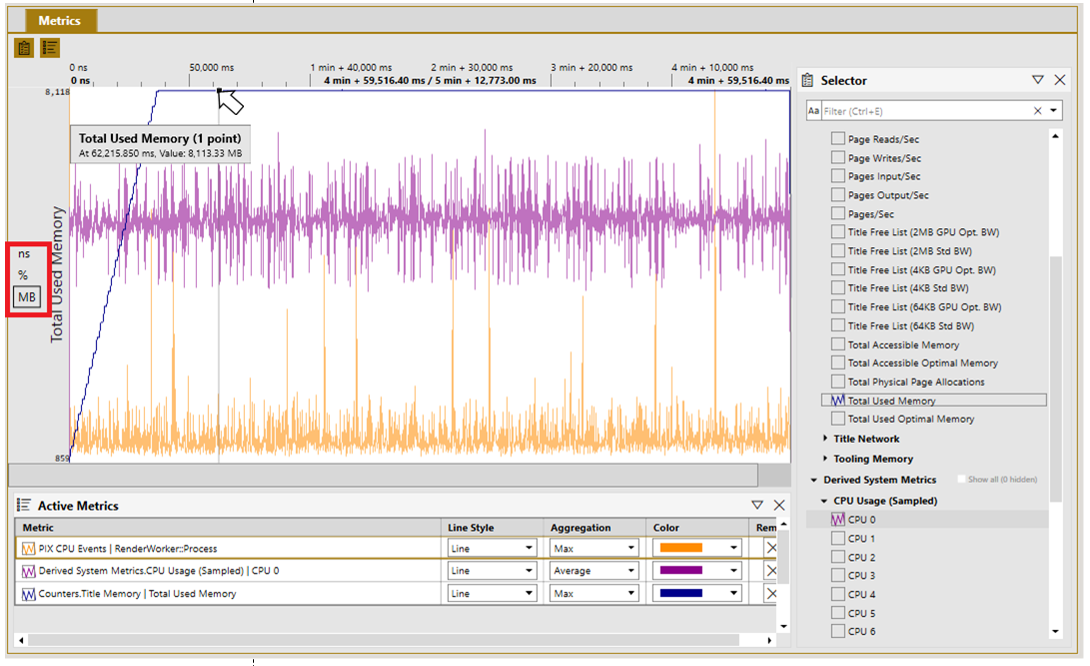
If multiple metrics are graphed, and some of those metrics have different units, the names of the various units are displayed in a panel on the left hand side of the view. As you hover over various metrics, a box is drawn around the units that correspond to the metric under the current mouse cursor. The following figure graphs three metrics with different units: nanoseconds (ns), percentage (%) and megabytes (MB). While hovering over the Total Used Memory metric, a box is drawn around the corresponding unit (MB in this case).
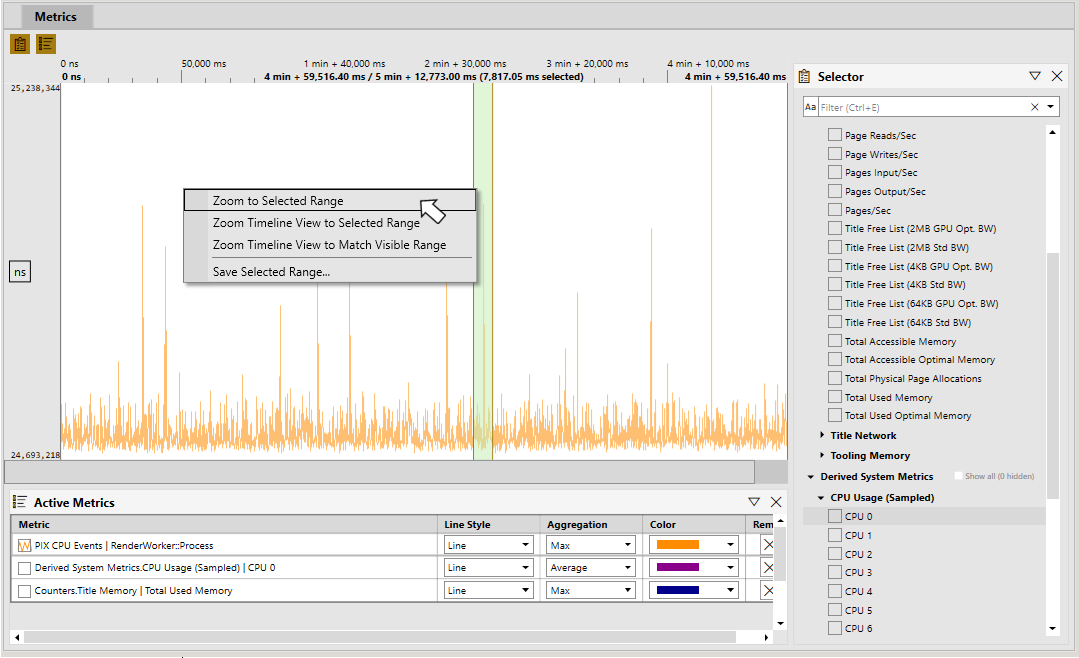
The Metrics view provides the ability to zoom in and out using Ctrl-Mouse Wheel in the same way that the Timeline does. Also, a context menu is provided that allows you to zoom the Metrics view to a selected range, or to zoom the Timeline to a selected range.
A typical use of the Metrics view is to find areas of interest using the graph, then zoom the Timeline to that range to see more detail about what is happening in your title at that point in time.
Selector Panel
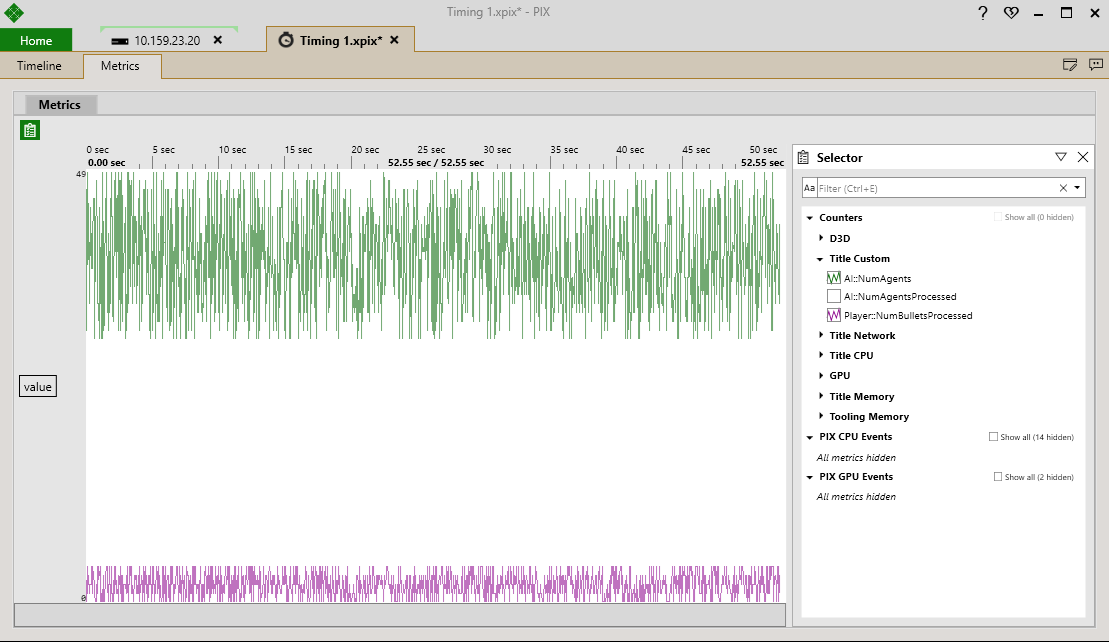
The Selector Panel is used to choose the set of events and counters to graph. The available Metrics are grouped into four categories: Counters, Derived System Metrics, PIX CPU Events, and PIX GPU Events. Title-defined counters (created through calls to PIXReportCounter) are under a node entitled Title Custom in the Counters group. The Metrics in the Derived System Metrics are values that PIX computed as the capture was running. These Metrics are currently focused on memory event rates and CPU utilization.
No Metrics are graphed by default (unless you’ve selected an event to graph in the Timeline).
To graph counters, either find the counter you want to graph by expanding the Counters tree or by typing the name (or partial name) of the desired counter in the filter bar at the top of the panel. Once you’ve found the Counters you’d like to graph, select the checkbox next to the name of the counter with either the mouse or the spacebar to add it to the graph.
By default, the Selector panel shows only the top level PIX CPU and PIX GPU events. The rest are hidden by default. The potential for a large number of PIX events makes it impractical to list them all by default from a UI navigation perspective. The easiest way to find particular PIX events that aren’t at the top level is to use the filter bar at the top of the panel. After entering your search text and selecting Enter, the Selector panel is populated with all events and counters that matched the search criteria. The following figure shows set the of events that were found when searching for the string RunSimulation.
Select the checkbox next to the name of the events you’d like to graph. Toggling the checkbox will cause an event to be removed from the graph.
Selecting the Show all checkbox next to CPU or GPU events will display the full set of events available to graph.
Consolidated Events
A common practice is to name the PIX events that represent a frame of CPU work (or any other repeated set of work) with a sequential number pattern, as shown in the following figure:
In this case, using the Metrics View to analyze an individual frame event isn’t useful, but analyzing the set of events as a group can be used to find outliers in frame time.
When populating the Selector panel, PIX will look for events whose names follow a particular pattern and groups, or consolidates, them. The individual events that fit the patterns will be treated as the same event for purposes of graphing and analysis.
Events that start with the same string, followed by one or more spaces, followed by a number will be consolidated. For example, from the picture above, the events “Frame 334”, “Frame 335”, “Frame 336” and so on, will be consolidated and graphed as a single event in the Metrics view.
The number at the end of the pattern may be either an integer or a decimal number. If the number is a decimal, it must have values on both sides of the “.”. For example, the events “Render 10.987” and “Render 12.789” would be consolidated.
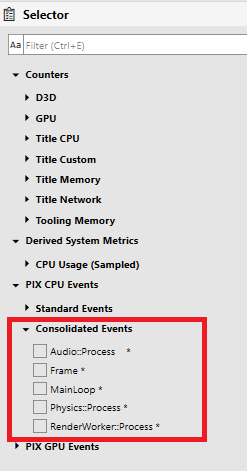
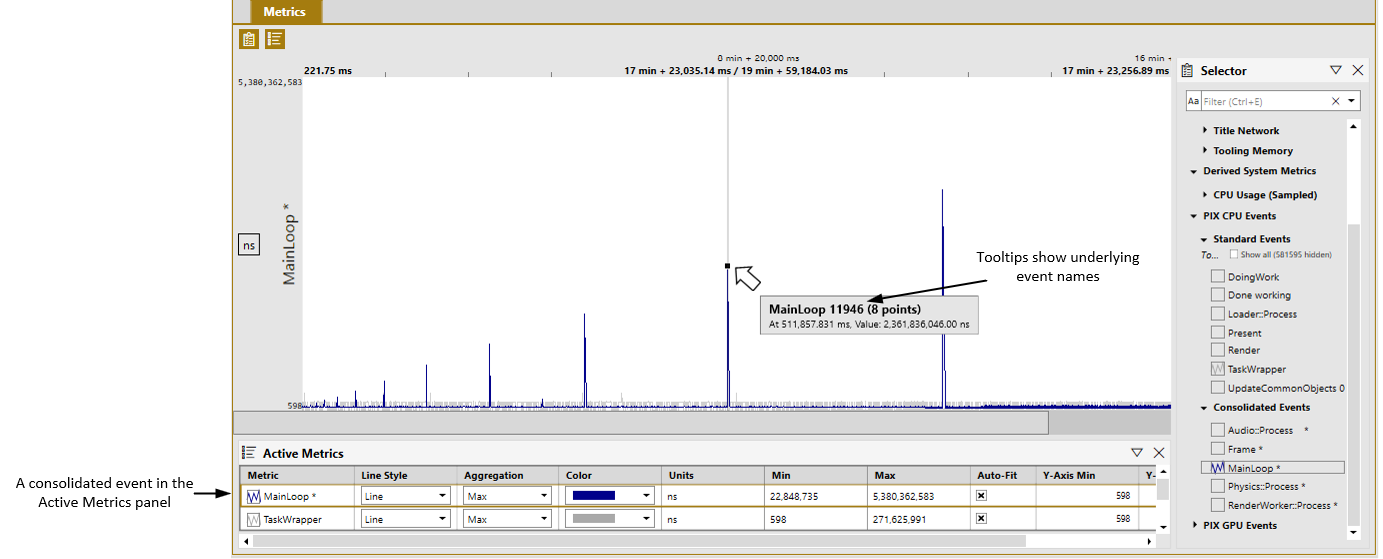
The consolidated events are shown in a separate node in the Selector panel tree under PIX CPU Events, as shown in the following figure.
Note that events are only consolidated for PIX CPU events. PIX GPU events do not currently support consolidation.
Clicking the checkbox next to a consolidated event will add the group of events to the Active Metrics panel just as with a standard event. Hovering over a point in the graph will show the name of the underlying event, as shown in the following figure.
The consolidating of events also occurs when the Metrics View is navigated to from the Timeline view. In the following picture, graphing the event MainLoop 7769, which matches the consolidation pattern, will cause the consolidated event MainLoop * to be added to the Active Metrics panel.
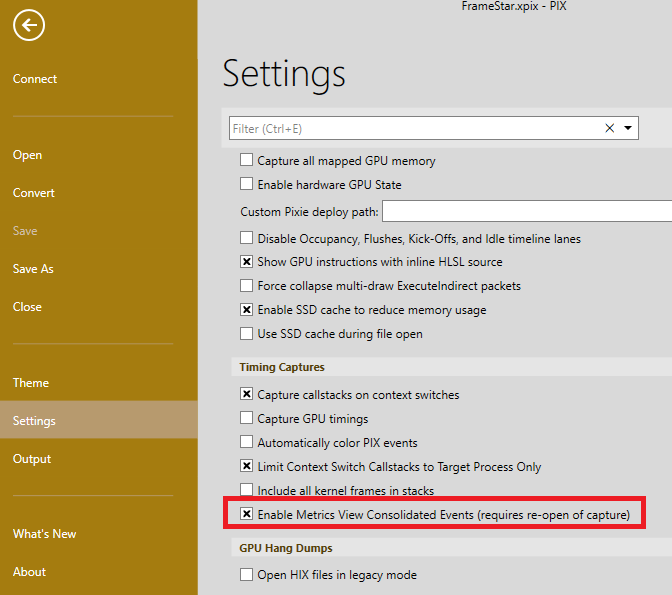
There may be times when the algorithm PIX uses to consolidate events results in grouping a set of events together that should instead be kept separate. If this occurs, uncheck the Enable Metrics View Consolidated Events (requires re-open of capture) checkbox in the Settings view.
The Active Metrics panel
The Active Metrics panel lists all metrics that have been added to the graph from either the Selector panel or the Timeline view. The table of graphed metrics includes a checkbox that can be used to toggle whether a given metric is currently graphed. The Active Metrics panel also includes a number of controls that can be used to customize the following aspects of how a metric is graphed:
- line style
- color
- aggregation mode
- minimum and maximum values of the y-axis
The ability to remove a metric from the active list is also provided.
Given the volume of available metrics in a typical title, grouping all active metrics together in a single table makes it easier to manage the set of metrics that are currently graphed.
Use the checkbox to the left of a metric to toggle the graph state. Pressing the spacebar while a row is selected also toggles the graph state. The up and down arrow keys can be used to navigate between rows.
Use the Remove button, or the delete key, to remove a metric from the active metrics panel.
Ctrl-A will select all metrics in the table. Using Ctrl-A along with the space bar or delete key is a fast way to toggle the graph state or remove all metrics.
Aggregation Mode
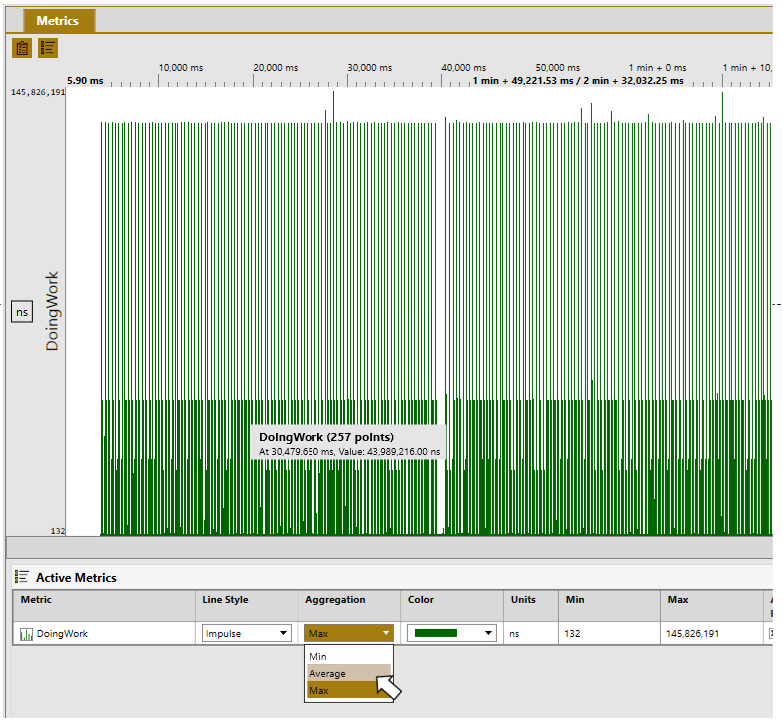
Depending on the volume of data in the capture, the Metrics View may not be able to draw a single point for every value of a metric that was captured. When this occurs, a number of data points will be aggregated together. The tooltip will include the number of points that have been aggregated.
By default, the maximum value of the aggregated metrics will be graphed. This aggregation mode can be changed using the dropdown in the Aggregation column as shown in the following figure.
Customizing the minimum and maximum values for the y-axis
In most cases, the default min and max values of the y-axis are the minimum and maximum values for the metric as seen over the duration of the capture. However, there are some cases, such as CPU Usage (Sampled), in which the default minimum and maximum values are known ahead of time. In these cases, the min and max values of the y-axis are fixed. In the CPU Usage (Sampled) example, the default min and max values would be 0 and 100 respectively.
The default min and max values of the y-axis are also influenced by the set of graphed counters that have the same units. In this case, the min value is the minimum value from across all of the metrics and the max value is the maximum value from across all metrics. For example, consider the following example in which three PIX events are graphed, all will different minimum and maximum nanosecond values.
In this case, the minimum value across all three metrics is 132 (from DoingWork) and the maximum value across all three metrics is 1,078,765,734 (from MainLoop). These two values define the default min and the max values for the y-axis for these three metrics.
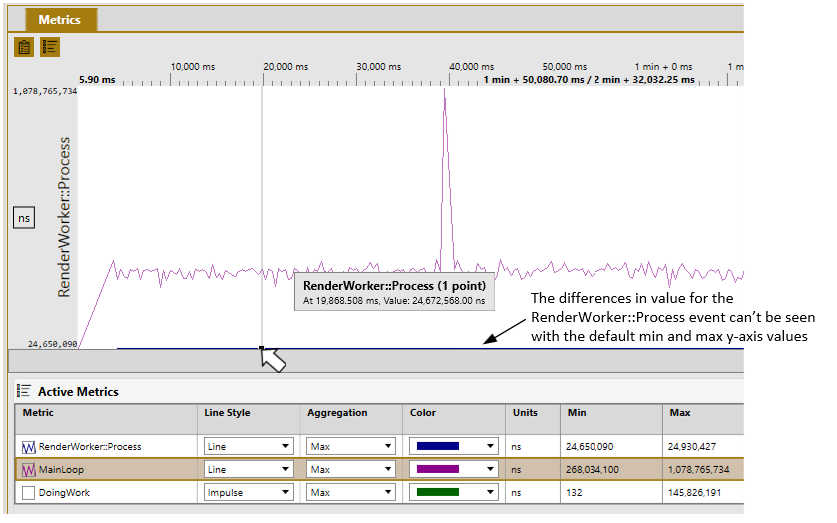
There are cases in which the default min and max values for the y-axis may not be optimal. One such example occurs when the ranges of two or more graphed metrics differ significantly. In this case, the default min and max y-axis may make it impossible to differentiate individual values for some of the metrics. In the following figure, the graph of the MainLoop metric is easily readable, but the graph of the RenderWorker::Process metric appears as a single line at the bottom of the graph.
The min and max values of the y-axis can also be customized for each metric to make analysis easier in cases like this. To set custom values for the y-axis, uncheck the Auto fit checkbox. Doing so causes the Y-axis min and Y-axis max fields to be editable. Enter the custom values directly in the edit boxes. In the following figure, the max y-axis value for RenderWorker::Process has been customized such that the graph for that metric is now readable alongside the graph for MainLoop.
Select the Auto fit checkbox to restore the default min and max y-axis values for a metric.
Graphing the duration, execution and stalled time of PIX CPU events
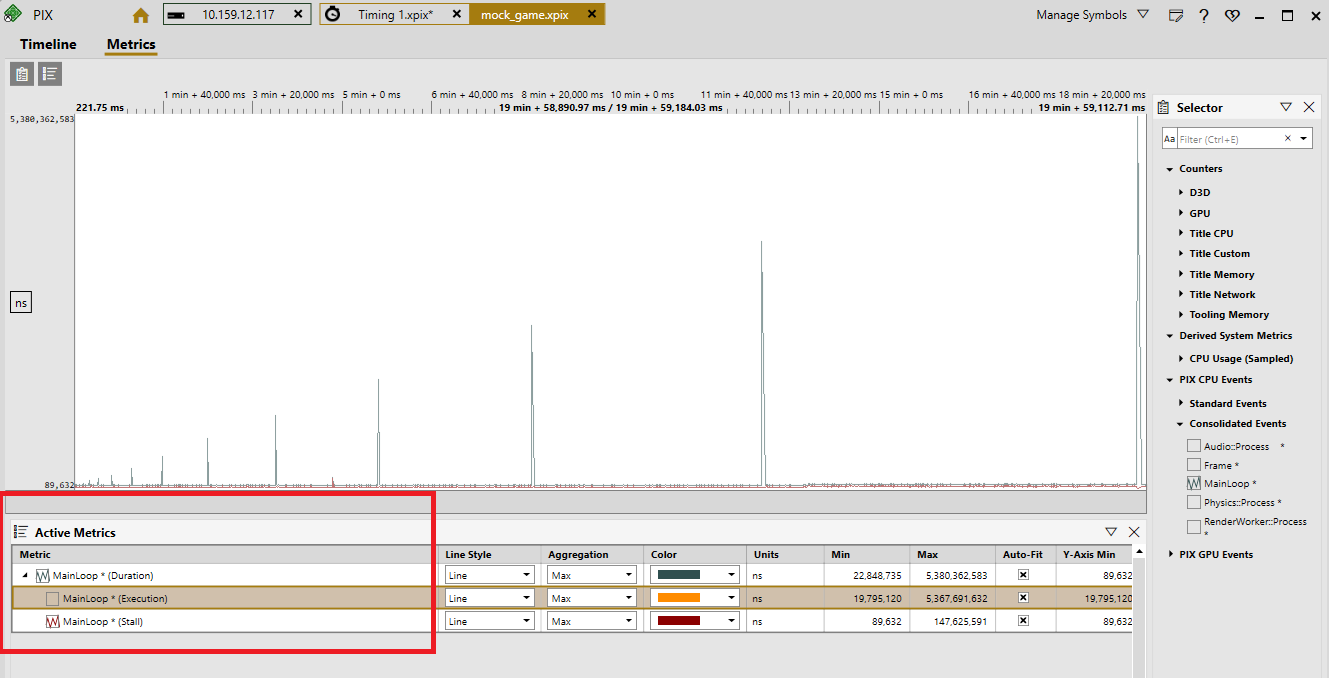
When a PIX CPU event is added to the Active Metrics Panel, the duration of the event is graphed by default. The duration is the amount of time taken from the time the event started running until the time the event stopped running. This time includes any time that the event was not running due to a context switch. The amount of time the event was not running is the stalled time. The duration minus the stalled time is the execution time, or the amount of time the code in the event itself ran.
The execution time and stalled time can be graphed in addition to the duration. Graph the stalled or execution time by expanding the row containing the name of the event in the Active Metrics Panel as shown in the following figure.
Lane Configuration Panel
Several aspects of how PIX displays data in the Timeline lanes can be configured. For example, the color assigned to the lane, the types of data that are displayed, and the pinning behavior can all be changed either on a temporary or a more permanent basis.
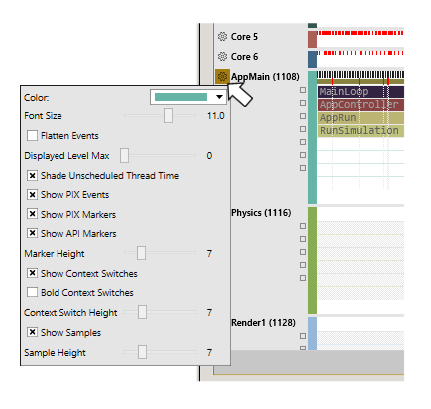
To change the configuration for a single lane, select the gear icon next to the name of the lane. This brings up a panel you can use to change the display settings for that lane as shown in the following figure.
Note that changing lane settings in this way applies only to the current UI session and the current capture. The updated settings are not preserved if you close and re-open PIX, or switch to a different capture.
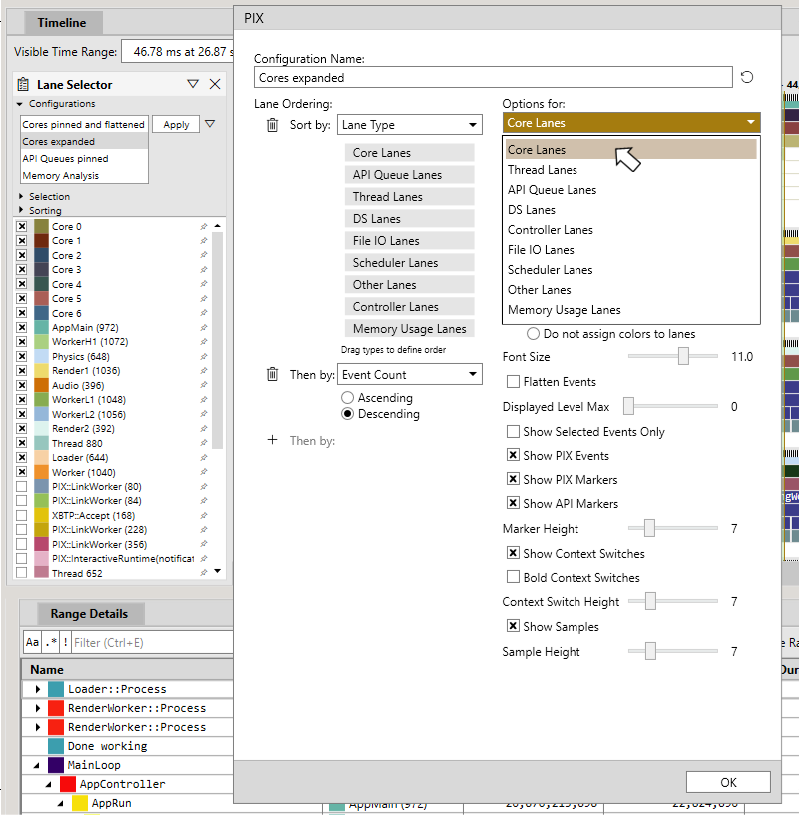
PIX supports more permanent changes to the Timeline display settings through the concept of Configuration. A Configuration is a group of settings that are applied to all lanes in the Timeline. The settings for Thread lanes and Core lanes are configured separately.
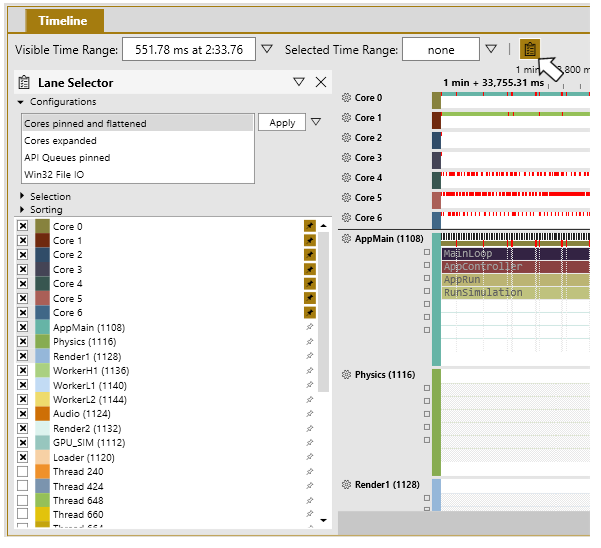
Configurations are edited using the Lane Selector. To bring up the Selector, click on the Lane Selector icon in the upper left corner of the Timeline view.
PIX includes three configurations by default: Cores pinned and flattened and Cores expanded, and API Queues pinned. These default configurations are oriented around the type of data that is your primary focus when looking at a capture. If your focus is on GPU data, for example, the **API Queues pinned** Configuration is likely the Configuration you’d like to start with.
These built-in configurations can be edited, and new configurations can be created. Configurations can also be deleted.
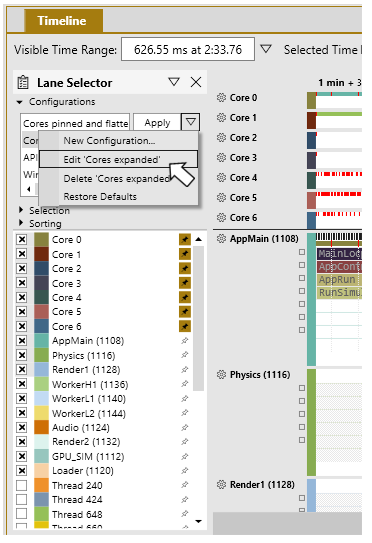
To edit a configuration, select its name in the listbox and choose Edit … from the drop down menu.
The settings that can be configured are displayed in a dialog box. The settings on the left hand side of the dialog control the sort order of lanes in the capture. The settings on the right hand side of the dialog control the settings for the various lane types.
To create a new configuration, select New Configuration… from the drop down next to the Apply button. The same configuration editing dialog appears, allowing you to name your configuration and to customize the various settings.
To switch between configurations, select the configuration you’d like to use and hit the Apply button.
To restore the default configurations to their original state, select the Restore Defaults option from the dropdown menu next to the Apply button.
PIX remembers the configuration that was in use when you close a capture or close PIX itself. The next time you open a capture, the previous configuration is restored.
The Lane Selector panel also allows you to choose which specific lanes to display, to change the order in which they are displayed, and to specify whether an individual lane should be pinned.
Extracting Portions of a Capture
Sharing a timing capture, or a portion of a capture, is a common workflow in many studios. It may be that one person narrows in on a performance issue that he wants another developer to investigate further. Given the size of a long timing capture, it may not be practical to easily share the entire file. Sharing the entire file also requires the person receiving the file to know exactly where to look in the capture to find the issue to be debugged.
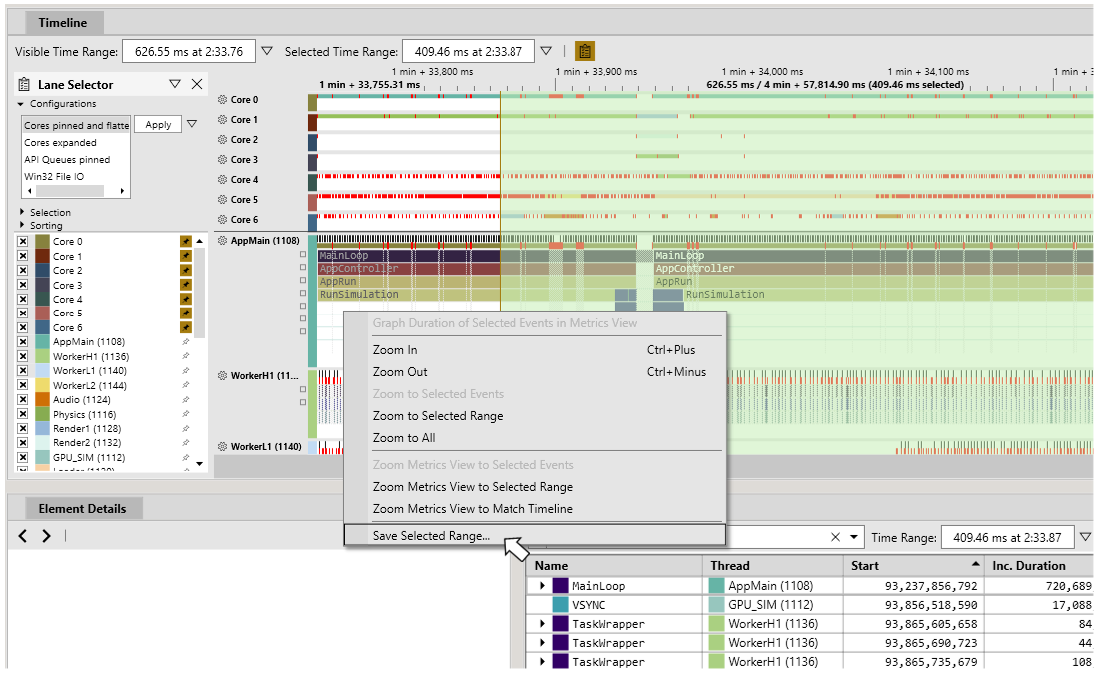
To facilitate sharing within a studio, PIX allows you to extract sections of larger captures. Extracting from a capture creates a new capture that contains only the selected time range. To extract a capture, select a region of time in either the Timeline or the Metrics view, right click, and choose Save Selected Range… from the context menu.
A File Save dialog will appear prompting you for the file name of the new, extracted capture. The new capture will be automatically opened in PIX.

