
PIX Timing Captures include an option to collect data on your title’s use of the Win32 file IO APIs to access files. The data collected for calls to APIs such as ReadFile and WriteFile include the name of the file being accessed, and the offset, size and duration of the access itself. Full callstacks for each file access are also recorded. If your title packages individual assets into a composite archive file, PIX can show which assets within the composite file were accessed if a mapping file is provided.
When file IO data is collected, PIX also computes drive bandwidth and utilization metrics. File IO data is displayed in the Timeline, Range Details, Element Details, and Metrics views in Timing Captures.
Capturing Win32 File IO data
To capture data on Win32 file accesses, select the File accesses check box when starting a Timing Capture as shown in the following figure.

Analyzing Win32 File IO accesses in the Timeline
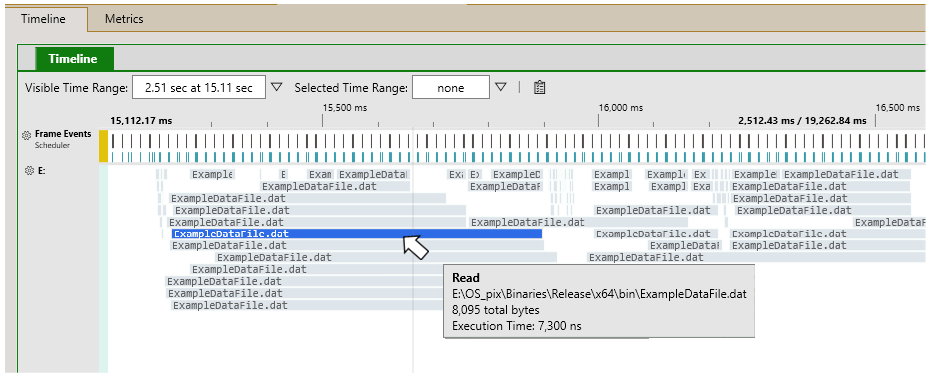
PIX creates an IO lane in the Timeline for each drive on the PC from which files were read. Individual file access are represented by a colored rectangle that contains the name of the file that was accessed. The start of each rectangle and it’s length represent the start time and duration of the access. Details of each access are provided in a tooltip.
The following picture shows several reads of a file named ExampleFileData.dat on the E: drive. Note that several rectangles indicating accesses of ExampleFileData.dat overlap in time and are stacked on top of each other in the lane. This visualization represents several concurrent reads of the file.
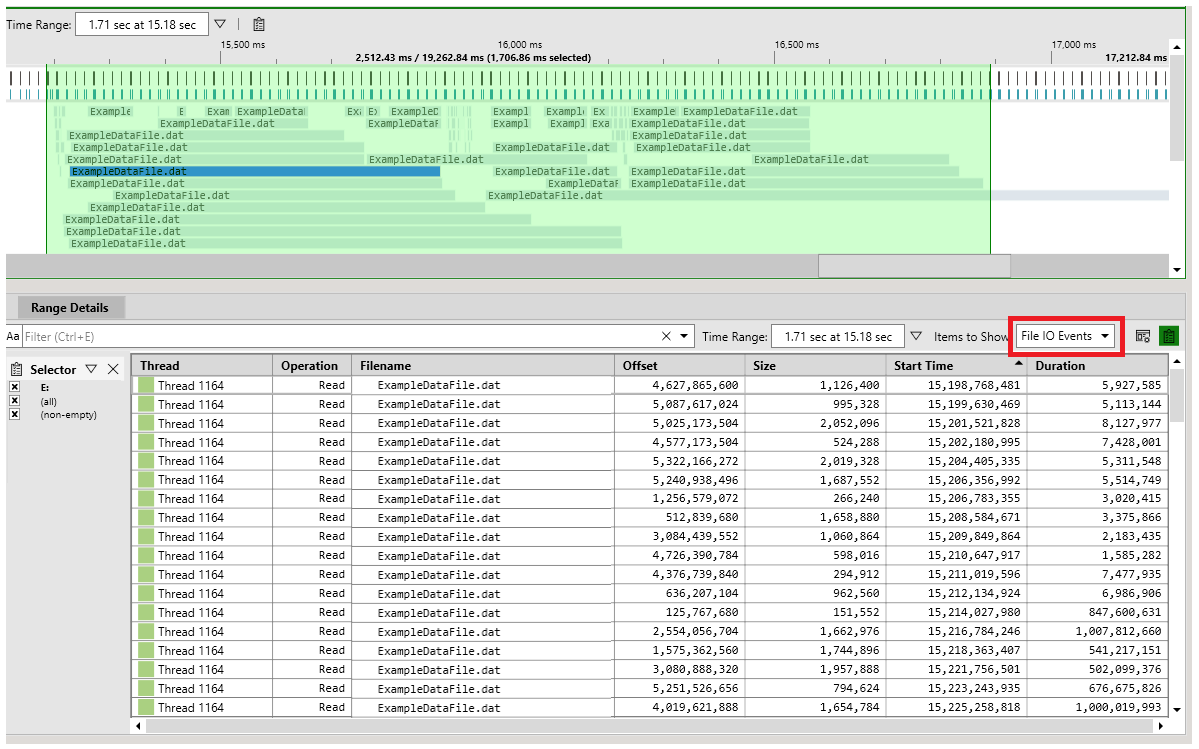
To view Win32 File IO data in a tabular form, select a range of time in the Timeline and choose the File IO Events item from the Items to Show dropdown in the Range Details view. Viewing timing data in a table is useful for certain scenarios such as sorting the table by the file accesses that took the longest time to complete.
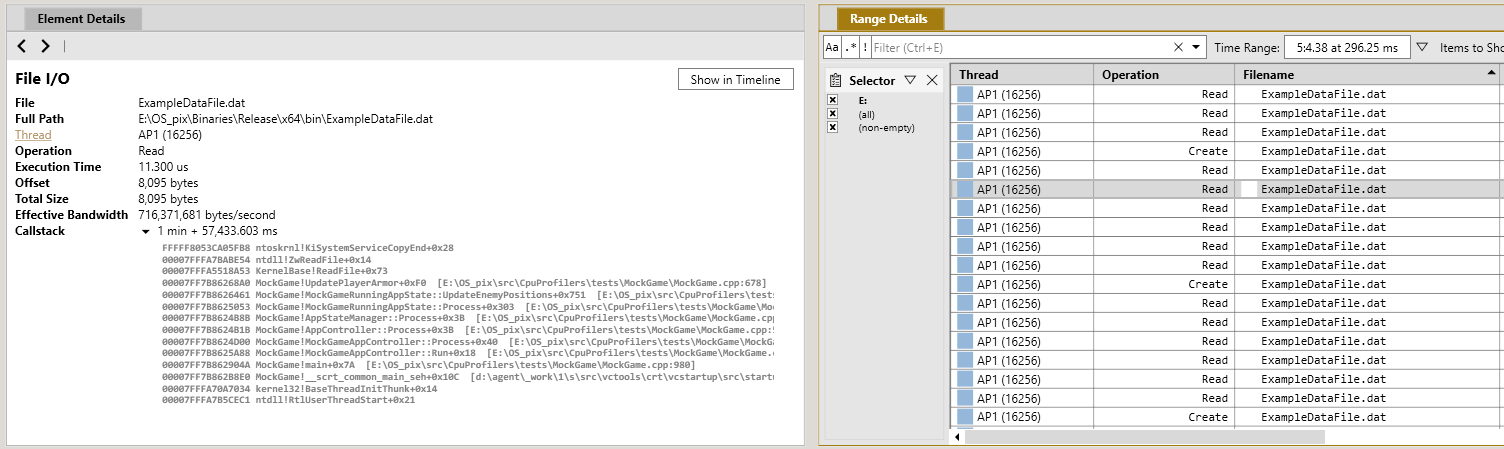
Selecting a row in Range Details populates the Element Details view with more detailed data about the file access, including the callstack in your title that initiated the access. Use the Show in Timeline button to scroll the Timeline to the point in time when the access occurred.
Analyzing file accesses that occur within archive files
By default, PIX shows file accesses as seen by the underlying file system. If your title packages individual assets into a composite archive file, the file io profiler built into Timing Captures can now show which assets within the composite file were accessed, but it requires extra information from you, the title developer, to do so. The extra information you supply is in the form of a Mapping File that PIX uses to decode accesses that occur within archive files. A mapping file consists of a list of entries, where each entry specifies the size of a specific asset, along with its offset from the beginning of the archive file. A description for each asset must also be provided. PIX uses this offset and size information to map accesses that occurred within the archive to the specific asset, or set of assets, that was read. It then uses the description supplied for each asset to identify it in various places in the Timeline, Range Details, and Element Details views.
Mapping File Format
Mapping files are in .csv format. The format should be easily producible either manually or from the portion of your build system that composes the archives.
The first line of the mapping file must be the file name of the archive file that the entries in the rest of the mapping file apply to.
Example first line:
c:\MockGame_PC\assets\armor_assets.packed
The remaining lines in the mapping file identify the individual assets within the archive. Assets are identified by the byte offset within the archive file where the asset is stored, the size of the asset in bytes and a description of the asset. The format of an asset line is
<offset>,<size>,<description>
Example asset line:
0x000000000001FA0, 8096, armor\body\helmet.s
The offset and size values on an asset line can be specified as either hex or decimal numbers.
Mapping files may also contain lines that are comments. PIX will ignore these lines when processing the mapping file. Comments lines start with a #.
Example comment line:
# this line is a comment. Ignored by PIX.
An example of a complete mapping file follows:
armor_assets.packed
0x000000000000000, 8096, armor\weapons\sword.s
0x000000000001FA0, 8096, armor\body\helmet.s
0x000000000003F40, 8096, armor\weapons\sabre.s
# this line is a comment, ignored by PIX
0x000000000005EE0, 8096, armor\body\mail.s
0x000000000007E80, 8096, armor\body\gloveR.s
0x000000000009E20, 8096, armor\weapons\chain.s
Working with Mapping Files
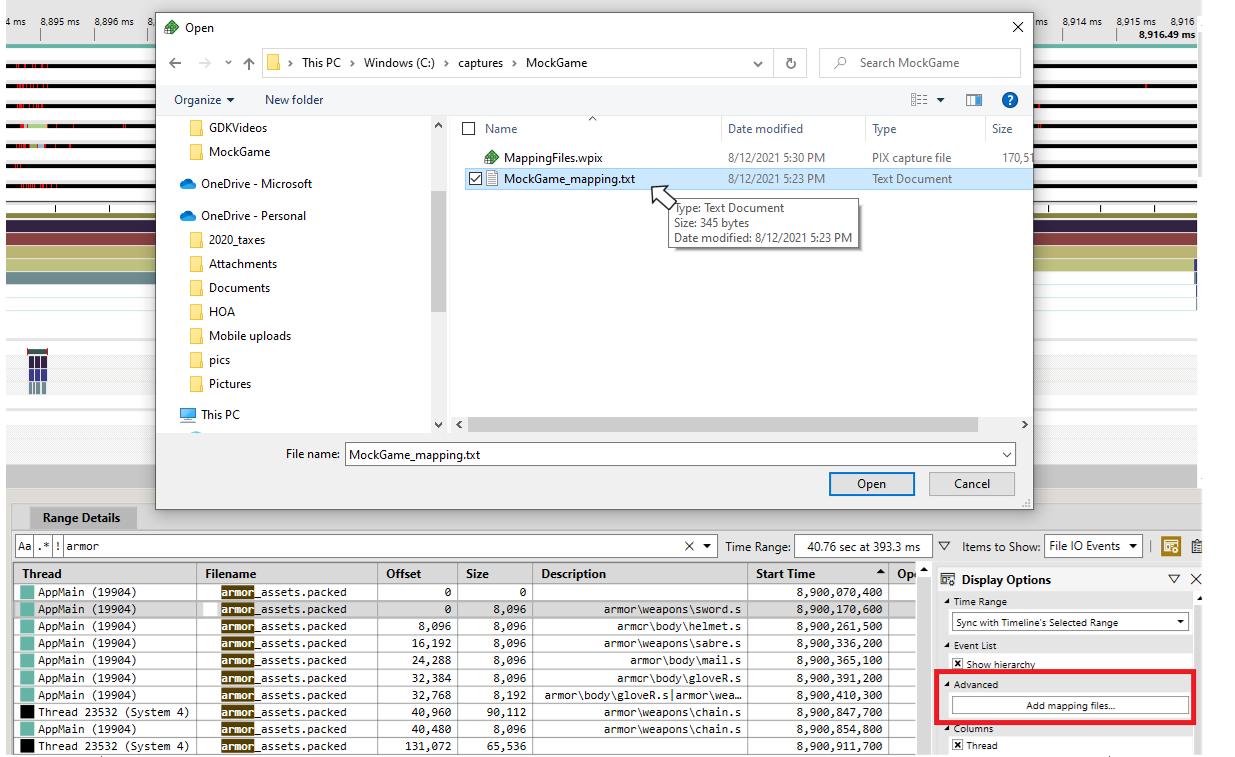
The Display Options panel in the Range Details view includes an Add Mapping Files… button when File IO Events is selected from the Items to Show dropdown. Clicking Add Mapping Files… brings up a dialog you can use to select your mapping files(s).
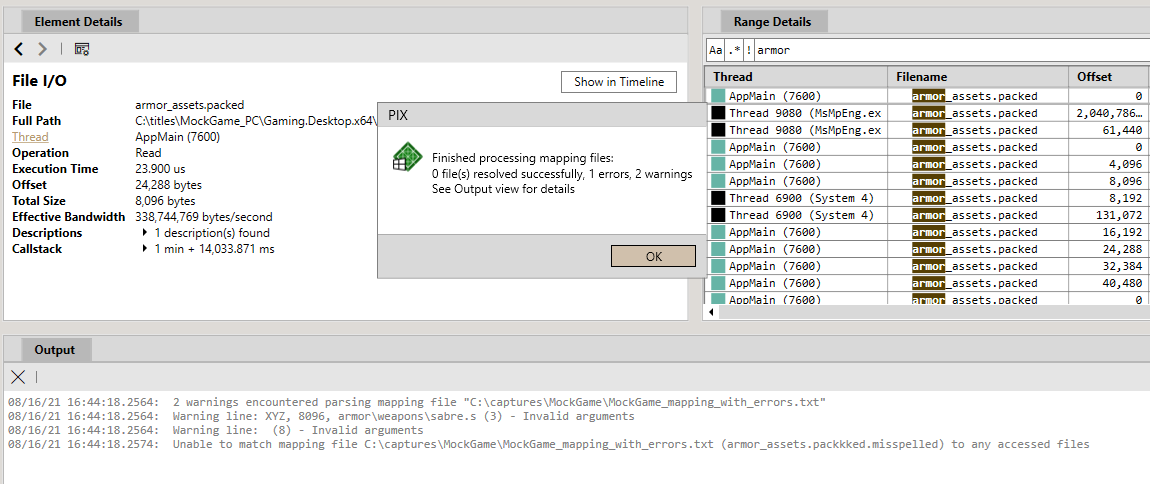
After processing the mapping file(s), PIX displays a dialog indicating whether any warnings or errors were encountered. A description of each warning and error is contained in the Output view. Note that malformed lines in a mapping file are considered warnings, not error. PIX will skip any malformed lines and continue processing the mapping file. The following picture shows the status dialog and contents of the Output view when errors and warnings are found.
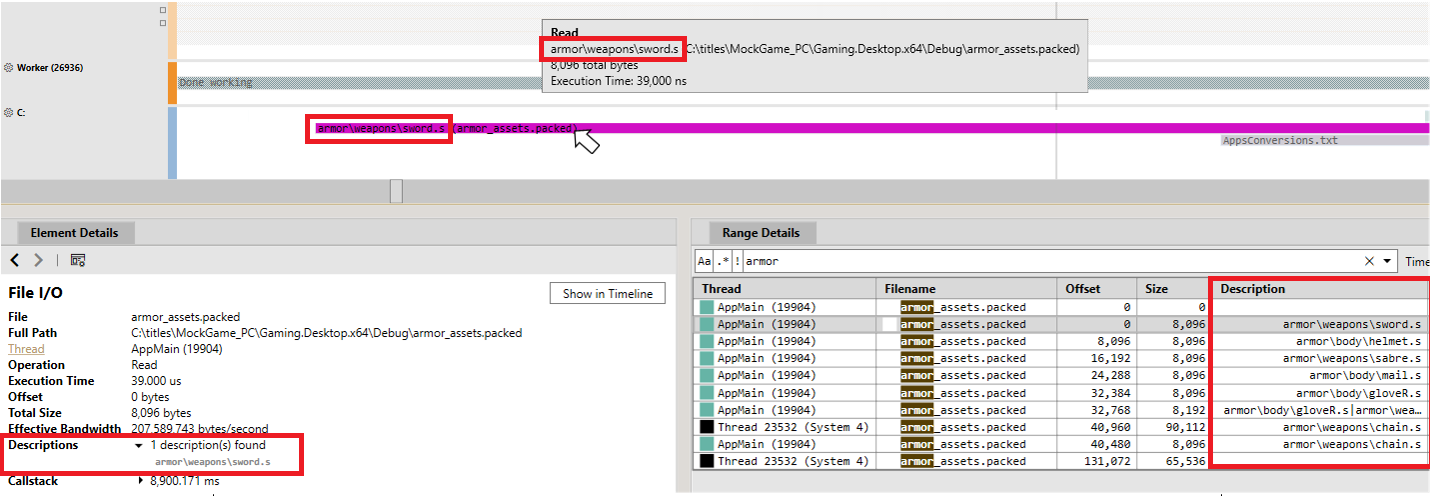
The UI is updated with the asset names for each line in the mapping file in which the offset and size match a file access that occurred when the capture was running. The Range Details, Element Details, and Timeline views are all updated with asset names.
Drive Bandwidth and Utilization Metrics
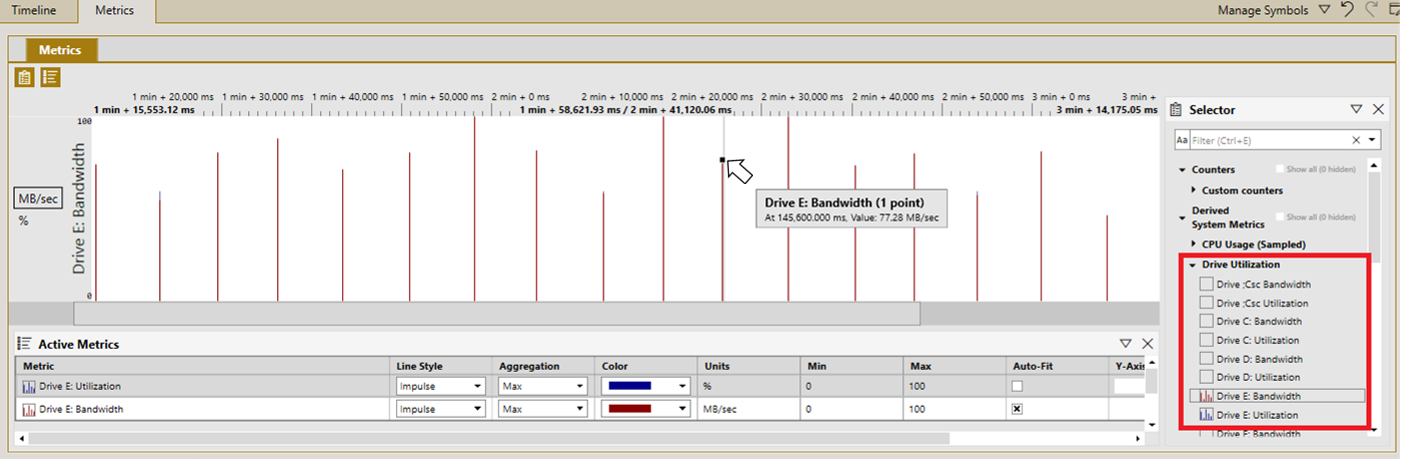
When file io data is collected, PIX computes drive utilization and bandwidth counters for each drive on your PC. These counters can be found under the Derived System Metrics/Drive Utilization node in the Metrics View Selector Panel.
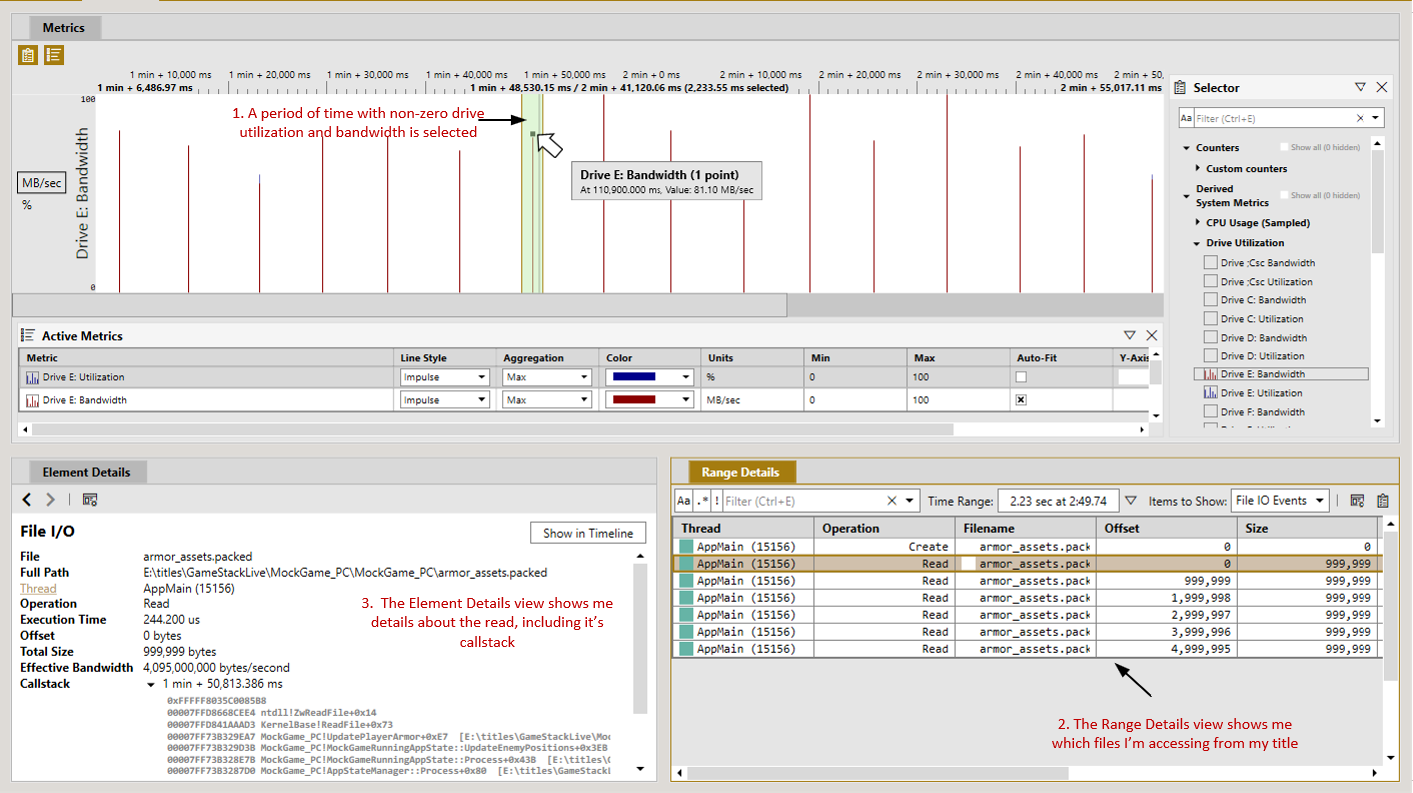
The integration between views in PIX makes it easy to draw correlations between the disk metrics and the data on individual reads. The following picture shows a custom layout comprised of a Metrics view, a Range Details view, and an Element Details view. The Range Details view is configured to display data corresponding to the selected time range in the Metrics view.
A period of time is selected in the Metrics view that corresponds to spikes in drive utilization and bandwidth. Selecting File IO Events from the Items to Show dropdown in Range Details, populates the table with the set of file accesses made by the title during that period of time. Selecting an individual access populates the Element Details view with details about that access, including the callstack of title code that initiated the access.
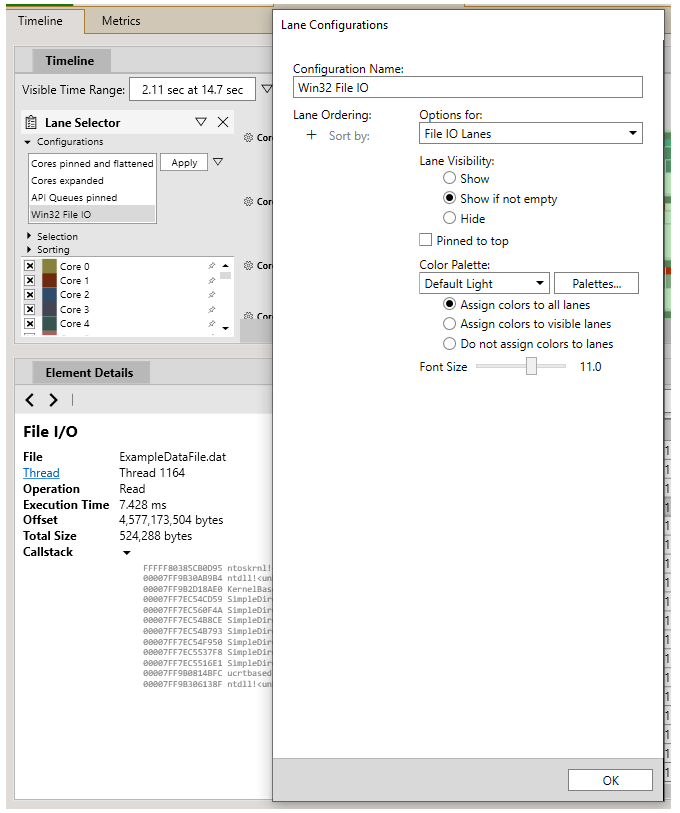
Win32 File IO Lane Configurations
The Lane Selector panel and the Lane Configurations list box can be used to customize the appearance of IO lanes as shown in the following picture. Options to reorder lanes, to display or hide specific lanes, to adjust the color and marker height, and other options are provided.
0 comments