
A context switch occurs when a CPU core switches from executing code on one thread, to executing code on a different thread, or going to idle. When the OS switches the thread that is running on a CPU, it must save and restore state, both for the thread that is being switched out, and for the thread that is being switched in. This state, or context, includes data such as the current value of all registers, the program counter and so on. Saving and restoring this state is an expensive operation from a performance perspective, so reducing the overall number of context switches is often key to achieving predictable, consistent frame times.
Context switches can happen when a thread waits on a synchronization object, when the OS scheduler determines a thread’s quantum has expired (and another thread is ready to run on that core) and so on.
Timing Captures in PIX have several features to help you determine when context switches occur, and to analyze what caused each switch.
Collecting context switch data
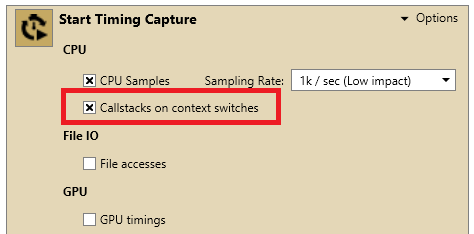
If you intend to analyze context switches, you’ll want to collect callstacks for each context switch. To collect callstacks, ensure that the Callstacks on context switches checkbox is selected before starting a capture. The checkbox is selected by default.
Finding stalls and context switches
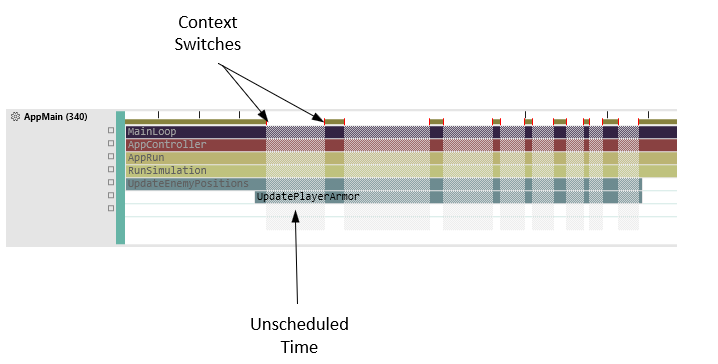
By default, context switches are displayed as small, vertical red lines in the thread and core lanes in the Timeline. Periods of time when a thread is not running, known as stalled or unscheduled time, are drawn by default using a cross hatched pattern. Every period of unscheduled time is bordered by a context switch out at the beginning, and a context switch back in at the end. The default visualization for context switches and unscheduled time is shown in the following figure.
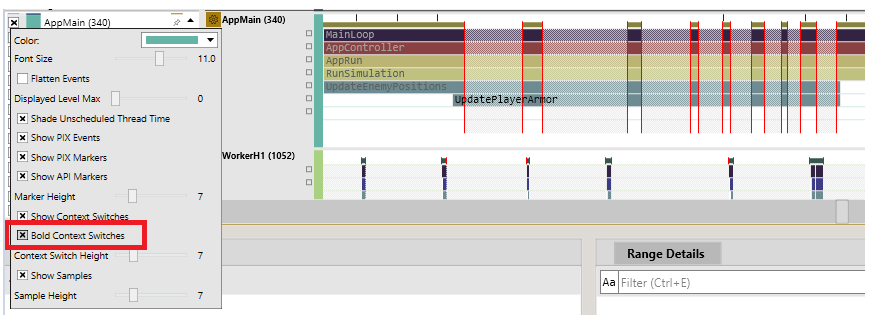
If you’re looking at a timing capture specifically to find and analyze context switches, you can change the default visualization so that the switches stand out more. The Bold Context Switches option in the lane configuration extends the vertical red lines that identify a context switch the full height of the thread or core lane.
Often times it’s useful to be able to quickly identify the stalls and context switches that have occurred during the execution of a particular PIX event. When an event is selected in the Timeline or Range Details views, the information displayed in the Element Details view includes a list of all the stalls in time order. For example, the following figure shows an instance of an event named UpdatePlayerArmor that had 8 stalls.

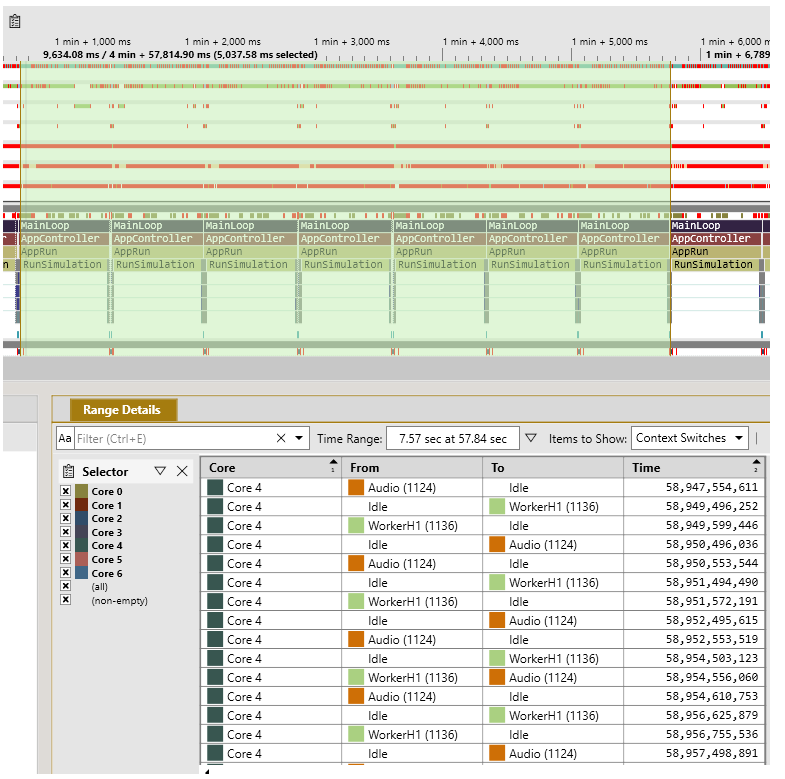
Context switches can also be found using the Range Details view. Select Context switches from the Items to show dropdown to see a list of all context switches for a selected time period. The list of context switches displayed in Range Details can be filtered by core using the Selector panel on the left-hand side of the view.
Analyzing stalls and context switches
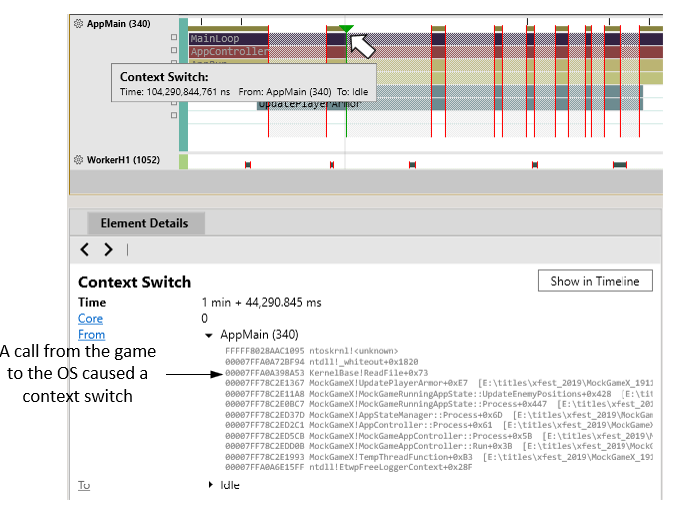
Selecting a context switch in the Timeline or Range Details view populates the Element Details view with information about the context switch. Element Details shows which core the switch occurred on, the time at which the switch occurred, and the callstacks for the thread that was running before and the thread (if any) that was running after the context switch. The following figure shows that a call from a title’s AppMain thread to the Win32 API ReadFile caused a context switch. After the call, AppMain transitioned from running to Idle.
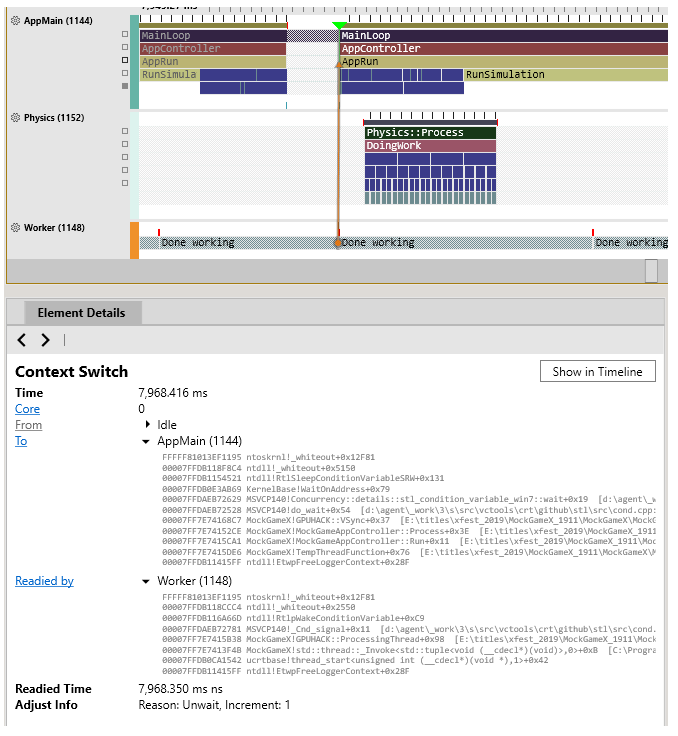
If a thread begins to run because of an action that occurred on another thread, information from the readying thread is displayed in both the Timeline and in Element Details. The context switch in the following figure shows that Core 0 goes from Idle to executing thread AppMain, and that AppMain was readied by a thread named Worker. The Element Details view includes the callstack for the readying thread, the readying time, and the readying reason. In the Timeline, an arrow is drawn from the readying thread (Worker) to the thread that is now running (AppMain).
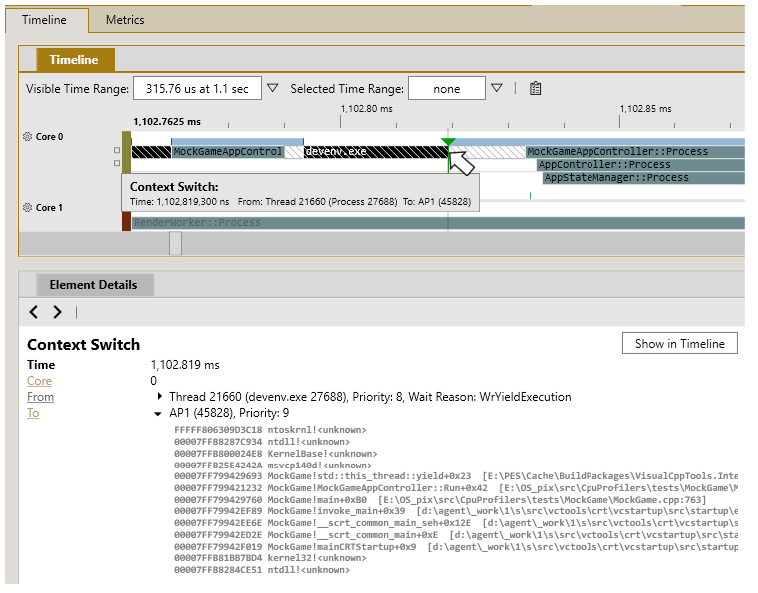
If a context switch involves a non-title process, PIX will show the process name and id in Element Details. The following figure shows that Core 0 switched from running the non-title process devenv.exe to running a title thread named AP1. In this case, the wait reason tells us that this switch occurred because of the operating system’s thread scheduler.
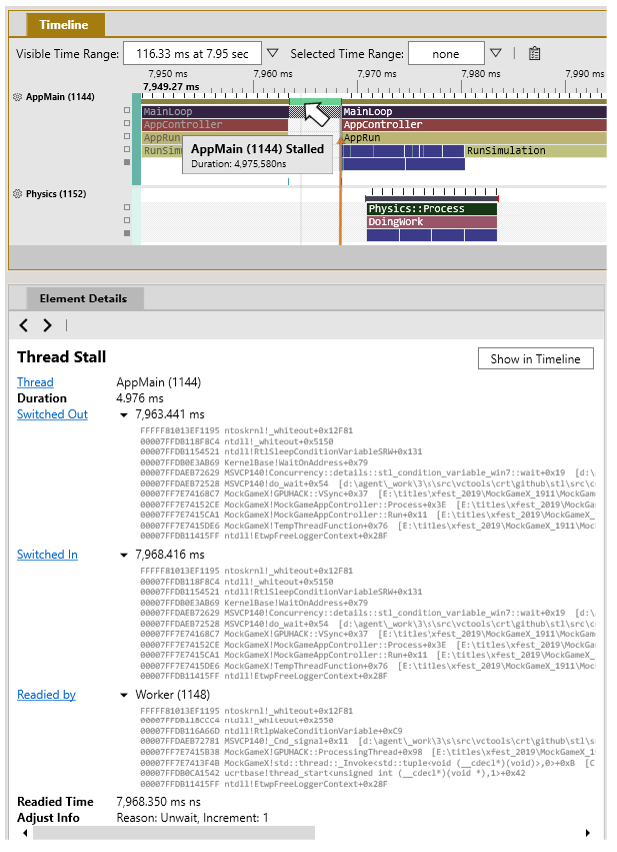
In addition to selecting individual context switches, an entire stall can also be selected. Selecting a stall gives you quick access to all three callstacks related to the stall: the callstack on the switch out, the callstack on the switch back in, and the readying thread callstack, if any. These callstacks are shown in Element Details along with other information about the stall including it’s duration as shown in the following figure.
0 comments