
Today, we’re releasing Visual Studio 2022 17.1 Preview 2. We’ve continued to iterate on the themes of the Visual Studio 2022 release and have enhanced existing features, brought new productivity improvements, and made it easier for you to make Visual Studio your own. In this blog post, we’ll talk in detail about changes in the Git, Search and Navigation, C++, and .NET experiences as well as some new capabilities for personalizing colored tabs. For more information on everything in this release, see the Visual Studio 17.1 Preview 2 release notes. To try out everything we’re writing about today, download the Visual Studio 2022 Preview:
In addition to these new experiences, we’ve also paid special attention to feedback from you, our community members, and have addressed over a hundred customer-reported issues via Developer Community so far in 17.1. We truly appreciate the time you’ve spent reporting issues and encourage you to continue doing so to help us make 17.1 the most performant, reliable IDE yet. We’re aware many of our users wait for the next release after a major one before updating and there is no better time to download the fastest version of Visual Studio to date.
Performance work is never done and we strive to do better every release. In 17.1, we’ve optimized Find All reference searches in C++ projects with up to a 22% improvement. As we move forward, we’ll continue our investments in performance throughout the IDE to bring you an overall more responsive experience.
Be more productive with Git
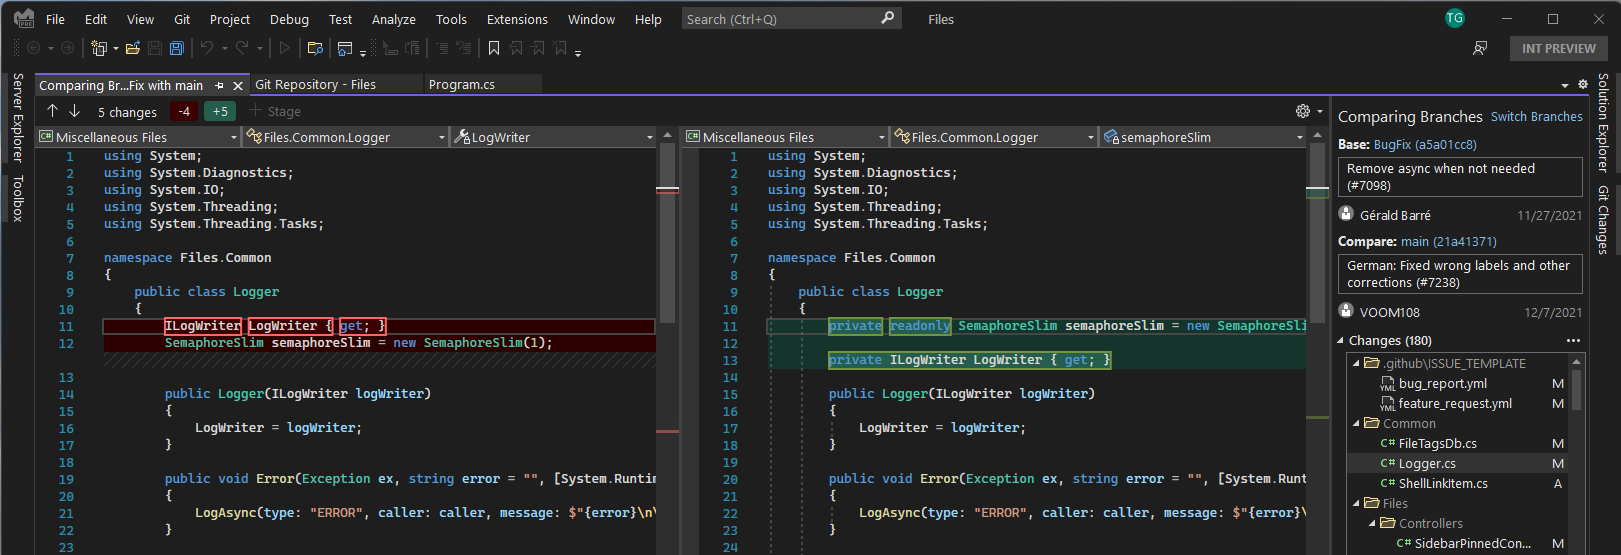
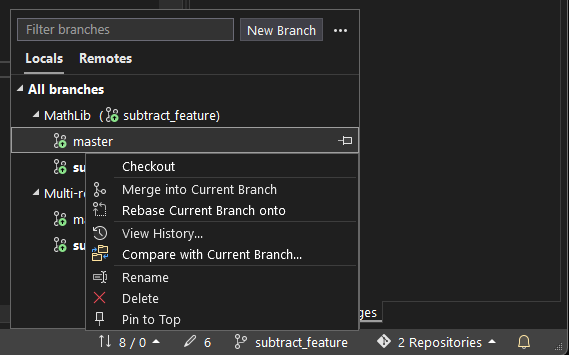
We’re very excited to announce that 17.1 preview 2 comes with long-awaited Git features to enhance your productivity and make your day-to-day work easier! Now, it’s easy to compare your current branch with other branches in your repository, which can be very helpful when you’re preparing for a pull request or even before you delete a branch.
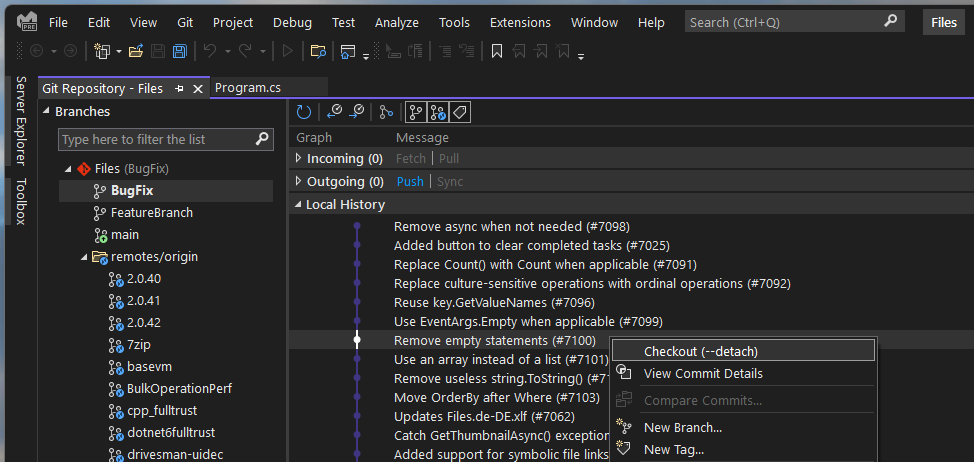
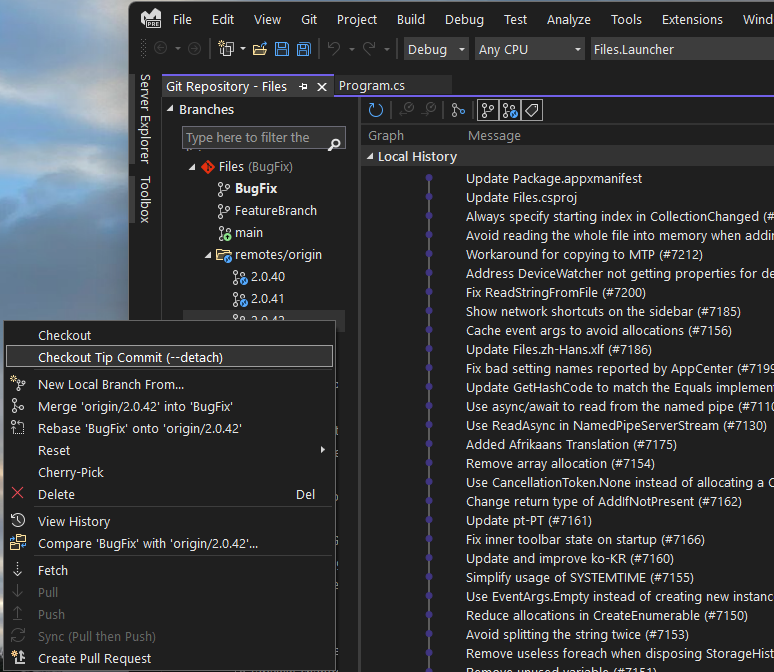
This preview comes with enhanced detached head support and introduces the ability to checkout a commit and checkout the tip of any remote branch. Now you can checkout any commit and go back to a previous point in your repository’s history to run or test your code. You can also quickly review pull requests and evaluate your team’s updates by checking out the tip of any remote branch.
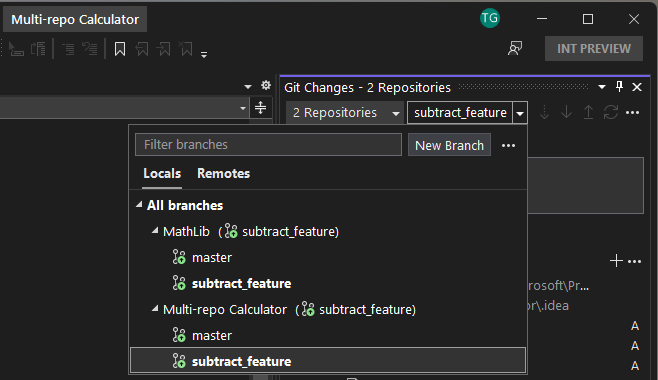
We continued improving our multi-repo support preview feature by enhancing the inner loop branching experience. Now you can utilize branch pickers on both the status bar and the Git changes tool window to checkout branches and do lightweight branch management across all or your active repositories.
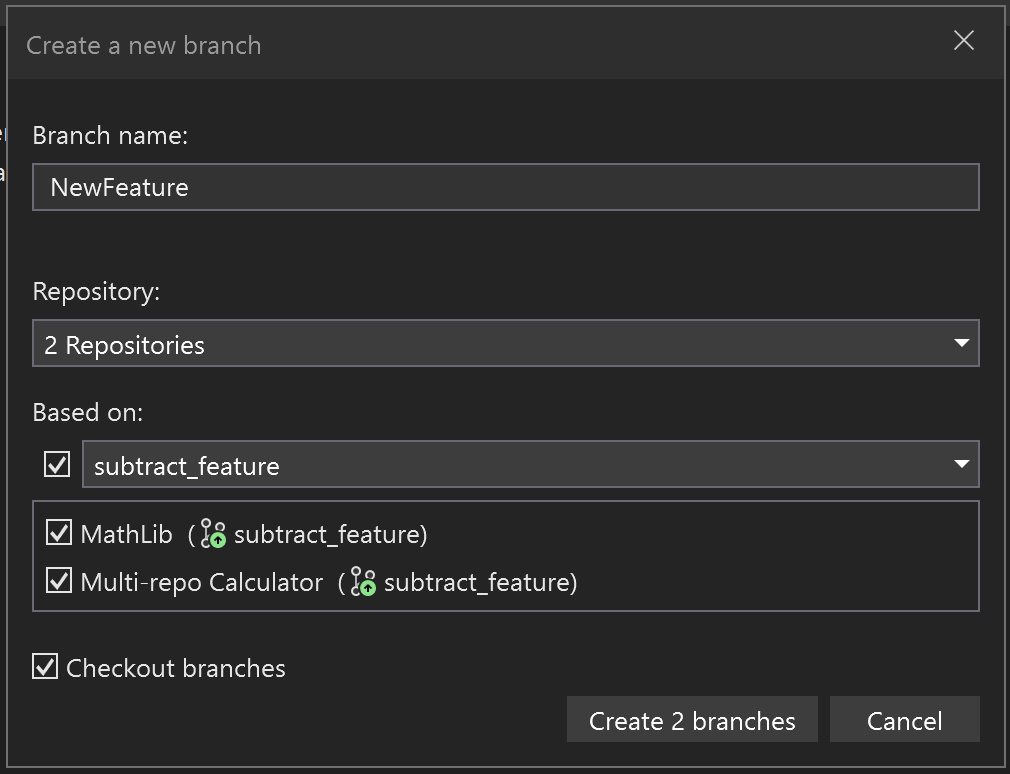
The create new branch experience now supports creating branches across all active repositories at the same time. You no longer need to manually create branches across repositories.
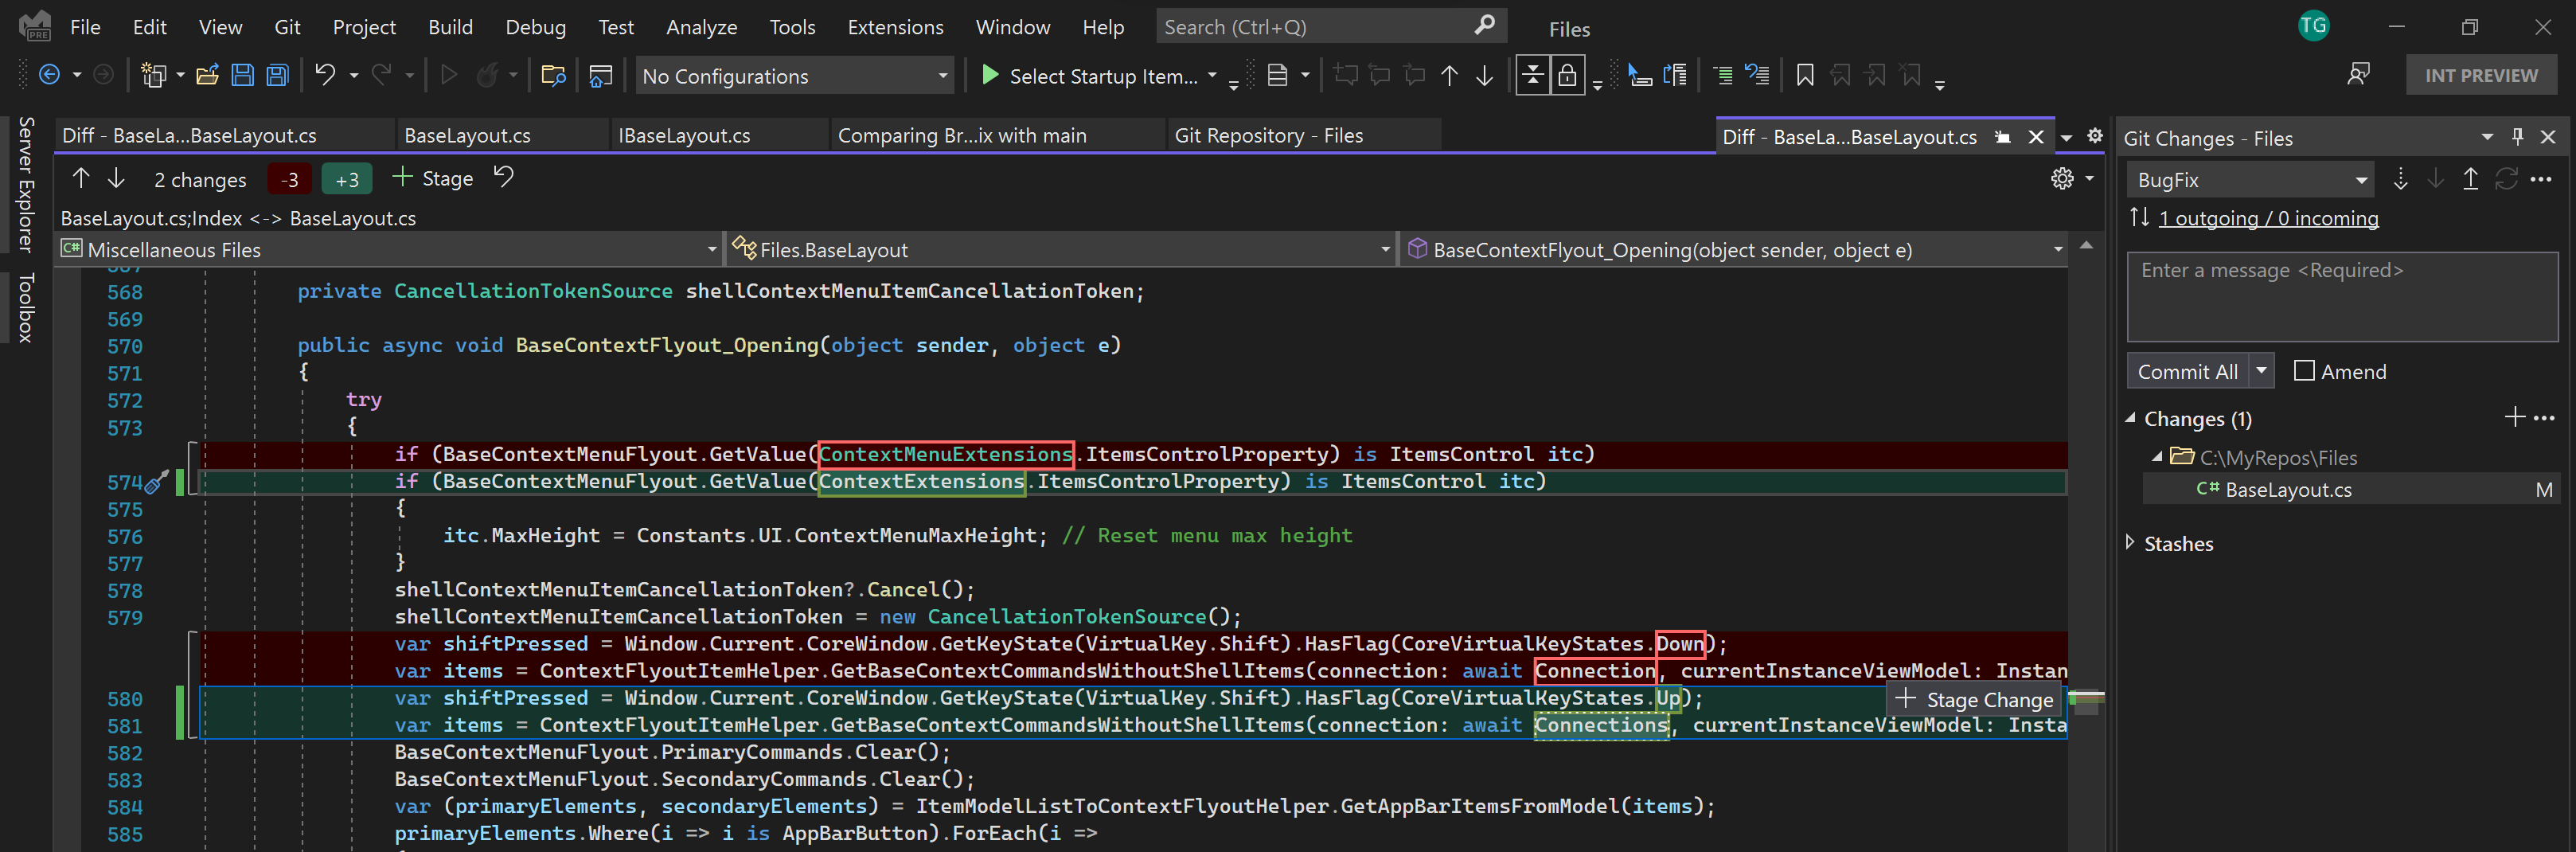
This preview also comes with some of our first Line-staging preview functionality. For example, now you can utilize the diff to stage chunks or sections of code.
If you’d like more information about these Git enhancements, check out the Introducing new Git features to Visual Studio 2022 blog post.
Keep your code clean, automatically!
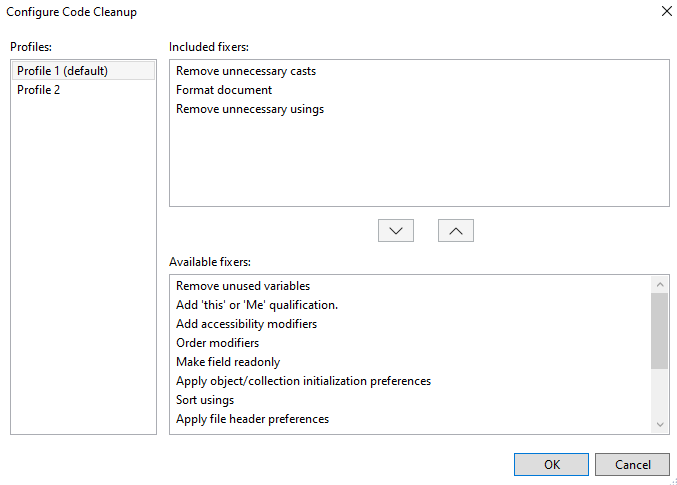
You can now configure personalized Code Cleanup profiles that will automatically run whenever you save a file. This will help minimize stylistic violations within PRs and more by allowing you to spend less time fixing code that doesn’t meet specific standards and more time focusing and being productive.
To configure your personalized Code Cleanup profiles, navigate to Analyze > Code Cleanup > Configure Code Cleanup.
To apply a code cleanup profile automatically on save, navigate to Tools > Options > Text Editor > check “Run Code Cleanup profile on Save”. This will cause the selected profile to be used whenever you explicitly save your document. This includes commands like Save, Save All, and the save that occurs when you kick off a build. It will not run Code Cleanup for any automatic saves.
Keep your files up to date automatically
We know many of you love using Ctrl+S to constantly save your documents and that “save often” is an enduring mantra in software development. Visual Studio now enables you to automatically save your dirty documents whenever the Visual Studio application loses focus. When you switch to any other application in Windows, you can have Visual Studio automatically commit your changes to disc for you.
The autosave feature is still a preview feature and we’re interested in your feedback. We’re considering additional options other than triggering on loss of focus on the Visual Studio window, so let us know what’s working for you and how we can make the experience better.
To enable the feature today, navigate to Visual Studio Search (Ctrl+Q) and look for “Autosave”. Today, that will take you to the Environment\Preview Features page in Tools\Options. Check the option for “Autosave” and Visual Studio will save all dirty documents whenever it loses focus.
For those of you trying out the Code Cleanup on Save feature we introduced in this preview, automatic saves will not trigger Code Cleanup.
Be more productive with .NET
Explore more code with navigate to source
We now surface embedded source and Source Link as part of Go to Definition if a referenced assembly has embedded source or Source Link. This allows you to navigate to the original source files that declare the target symbol. Place your cursor on a symbol and press F12 to navigate to the original source file.
Gain more insight with Stack Trace Explorer
A new Stack Trace Explorer Window displays stack traces allowing you to click and navigate directly to the related code. You can copy a stack trace from your solution and paste it into the Stack Trace Explorer window to get started. To open the Stack Trace Explorer window, go to View > Other Windows and select Stack Trace Explorer.
Enforce consistent naming styles in your code
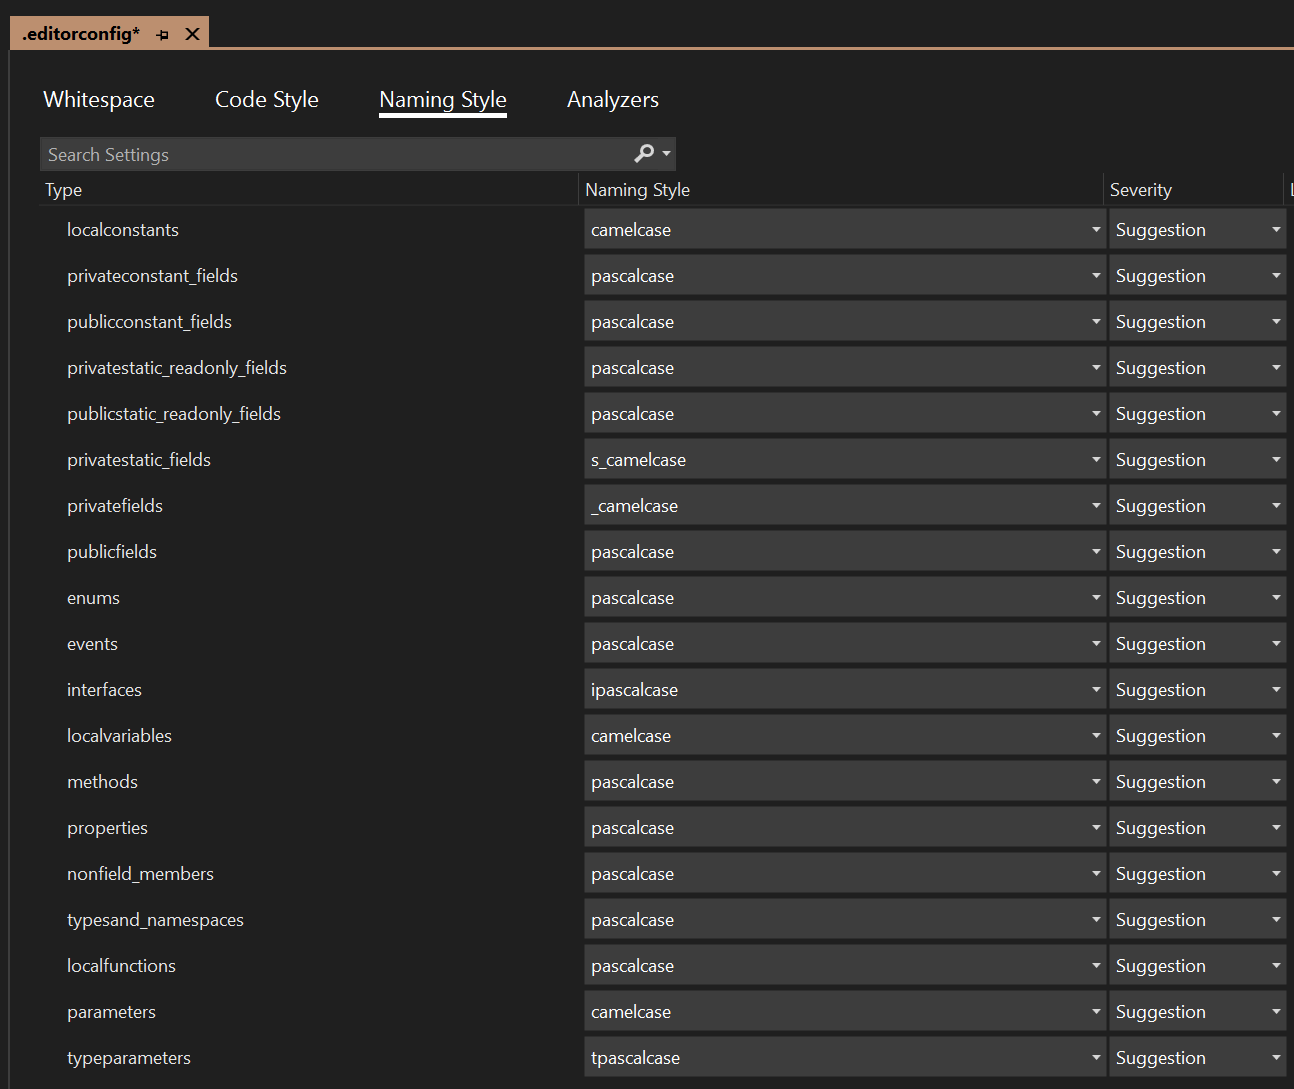
In Visual Studio 2019 we introduced a new UI for EditorConfig. EditorConfig files help to keep your code consistent by defining code styles and formats. These files can live with your code in its repository and use the same source control. This way the style guidance is the same for everyone on your team who clones from that repository.
In this release we added Naming Styles to the EditorConfig UI. With the addition of Naming Styles, you can enforce naming conventions in your code. For example, you could enforce that all interfaces start with the letter “I”. In order to add an EditorConfig file to a project or solution:
- First, right-click on the project or solution name within the Solution Explorer
- Then, select Add New Item.
- In the Add New Item dialog, search for EditorConfig.
- Finally, select the .NET EditorConfig template to add an EditorConfig file pre-populated with default options.
Be more productive with C++
Embedded development in Visual Studio
We’ve also added support to help enable embedded developers in Visual Studio. We’ve introduced additional views that enable you to inspect and interact with peripheral registers on microcontrollers and real time operating systems (RTOS) objects.
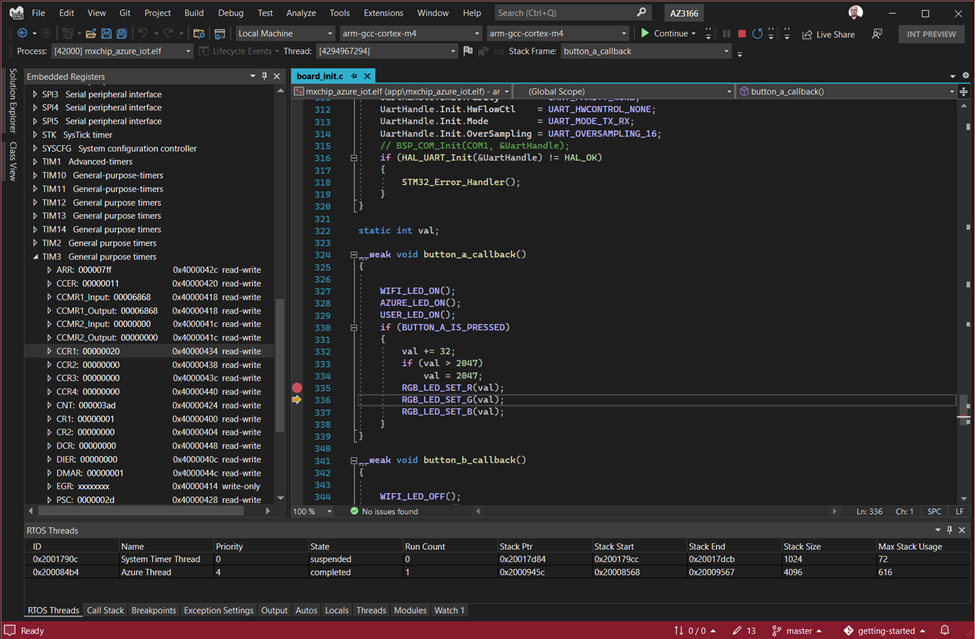
Take a look at one of our other blog posts to learn more about embedded development with Visual Studio through an example of an Azure RTOS project targeting a device.
Additional macOS development support in Visual Studio
In earlier versions of Visual Studio, we added capabilities for targeting macOS for remote development. These capabilities are part of the umbrella of features that we call “Linux development with C++”. One of these features released in 17.0 Preview 3, debug attach, sees improvements with today’s preview release. We’ve added more capabilities for core debugging with LLDB and a default configuration for targeting macOS in our CMake experience. We made the experience easier by automatically detecting the target system; if it’s macOS, we’ll automatically use LLDB in core debugging and debug attach experiences.
Personalizing color tabs
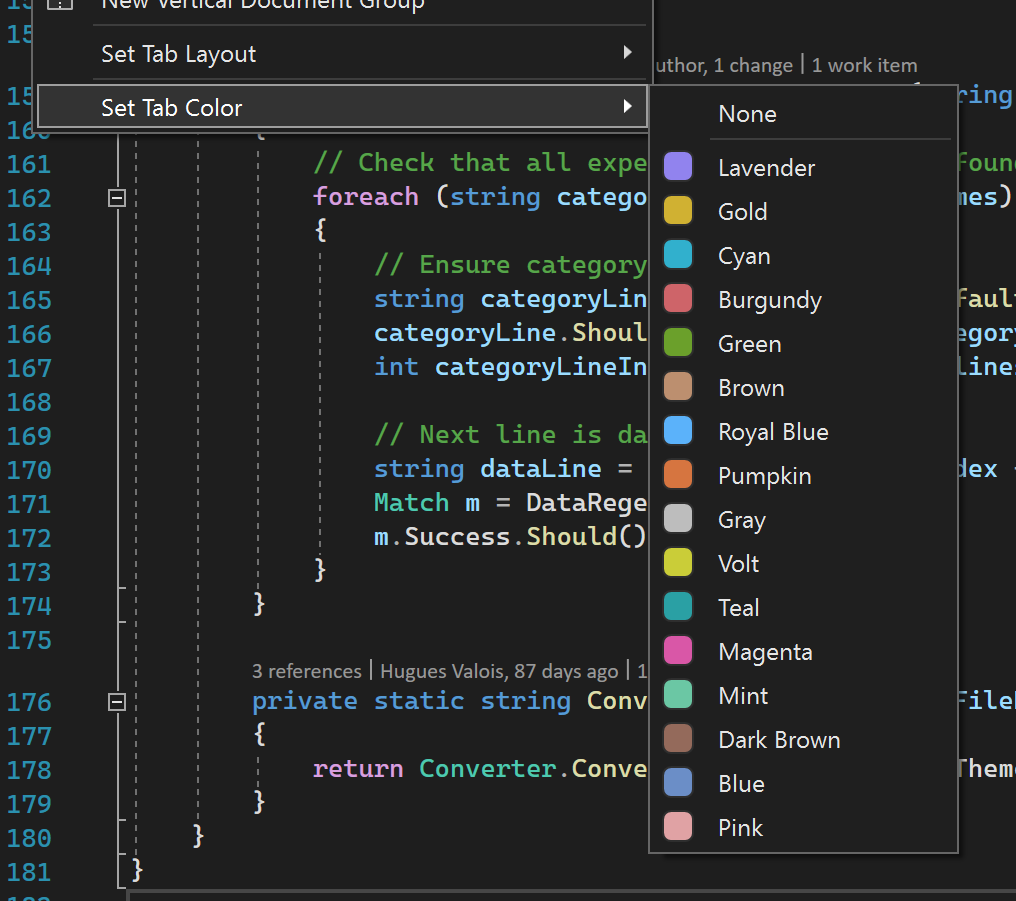
After releasing the highly requested color tabs functionality to help you personalize your Visual Studio experience, we heard feedback that one of the most common ways the community likes to color tabs is by project and by file extension. These color schemes are both available by default. We’ve also added the capability to pick your own tab colors. To try this out, first enable color tabs. After enabling colored tabs, right click on a tab and navigate to Set Tab Color to pick from the palette.
Try it out and share your feedback!
Download Visual Studio 2022 17.1 Preview 2 today to give what we’ve talked about a try! We’d love to hear from you about the new experiences we’ve described here. Let us know what you like and whether you have suggestions for making Visual Studio even more awesome. You can share feedback with us via Developer Community: report any bugs or issues via report a problem and share your suggestions for new features or improvements to existing ones.
When will VS be written using .NET 6+ instead of .NET Framework and take advantage of the many benefits that brings?
WDK.vsix for VS2022? I hope you release it as soon as possible.
Can you make it so that the settings for “Keep your code clean, automatically!” can be saved to a file, so that they can be checked into source control and shared with the team? We currently use the CodeMaid extension for this, but it’d be great for VS to support this natively! 🙂
I’ve installed VS 17.1 P2 to start a MAUI Blazor app, the main aim being a windows desktop app. After I start a new project, which actually creates 2 projects, the 2nd project (the default ends with a name …WinUI) reports a couple of missing analysers, half a dozen packages and three SDK CRT/VC libraries. What might I be missing?
Thanks to anyone for any help.