

We are happy to announce that we have added new embedded development capabilities to Visual Studio 2022 Preview. Used in conjunction with the new vcpkg artifact capabilities you can quickly bootstrap an embedded development machine and get started.
In this post we will walk you through Visual Studio installation of the embedded workload, how to acquire embedded tool dependencies with vcpkg, then demonstrate edit, build, deploy, and debugging directly in Visual Studio with new peripheral register and RTOS object views. We will demonstrate all of this with an Azure RTOS ThreadX project.
Azure RTOS ThreadX is a widely used Real Time Operating System (RTOS) used on billions of microcontrollers (MCUs) in products around the world. We have dedicated pages for Visual Studio usage in the getting started guides for the Azure IoT DevKit, NXP 1060, and STMicro STM32L4_L4+ boards. The techniques used for interacting with these boards should be applicable to other targets by changing configuration information.
Installation
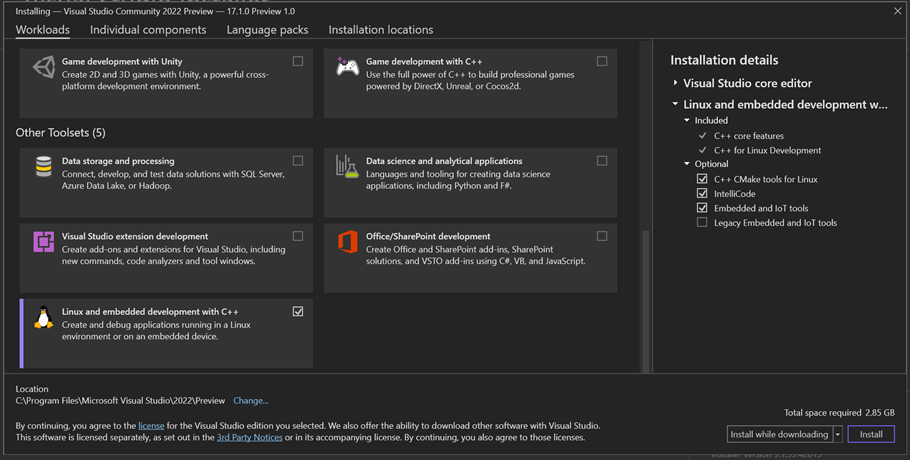
To get started install the latest preview release of Visual Studio 2022 and select the Linux and embedded development with C++ workload. The components you need are selected by default.
One of the challenges in embedded development is getting the tools necessary installed and configured. It is not uncommon to have different compilers used for different projects, custom debug tools, etc. This is where the new artifact capabilities in vcpkg can help us. Today we’ll demonstrate using vcpkg from a PowerShell prompt to activate our embedded development environment. In a future release this will be integrated into Visual Studio for a more seamless experience.
From a PowerShell prompt, clone the Azure RTOS getting started repo. This sample will serve as our example project for the remainder of this post.
git clone --recursive https://github.com/azure-rtos/getting-started.git
Navigate to the subfolder for the board you are using, here I’m using the Azure IoT DevKit.
cd .\getting-started\MXChip\AZ3166\
If you haven’t already, install vcpkg.
iex (iwr -useb https://aka.ms/vcpkg-init.ps1)
In the project folder, there is a file vcpkg_configuration.json. This manifest file was created with vcpkg and has recorded the tools you need to build and debug this project. See the vcpkg artifacts post for details on how to create your own manifest. Running the vcpkg activate command will use this file to determine if I have those tools, install them if I do not, then activate them in my environment for use.
vcpkg activate
So, in three commands we have cloned our embedded project, installed vcpkg, acquired and activated the necessary tools for building the project.
Using Visual Studio for embedded development
In the previous section we used vcpkg to acquire the tools for our embedded project. Today vcpkg is not integrated in Visual Studio. So, at present we need to launch Visual Studio from the environment we activated at the command line so those tools are available for its use as well.
Start-Process devenv .
Note that if you have more than one version of Visual Studio installed this may not launch the current preview, in that case you will need to use the full path to your preview installation, for example
C:\Program Files\Microsoft Visual Studio\2022\Preview\Common7\IDE\devenv
Now that we have the project open in Visual Studio it is ready to go as any other CMake project. Visual Studio can run the CMake build using the preconfigured CMakePresets file with the compilers vcpkg acquired.
All the editing power of Visual Studio is now available for use with the embedded project. With this Azure RTOS project we’ll cover code navigation, IntelliSense, build, deploy, debugging. We will also cover new diagnostic capabilities around peripheral registers and RTOS object views.
Code Navigation and IntelliSense
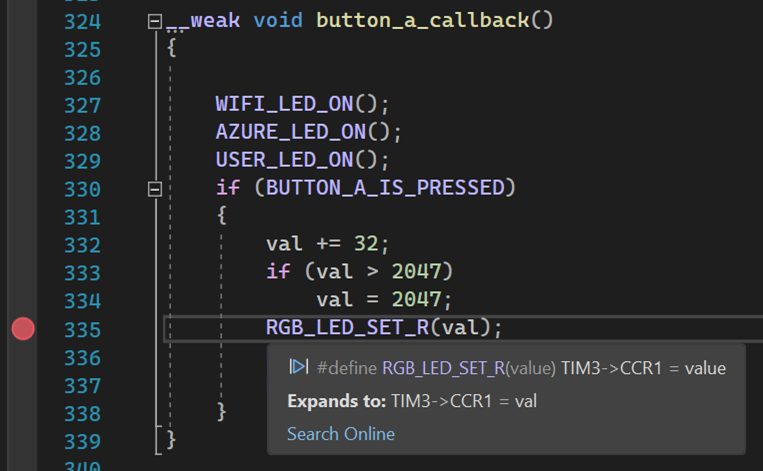
Use Ctrl + T to open Go to All and type button, select the button_a_callback function to navigate to it. Note on hover that this function expands to TIM3->CCR1 which is a peripheral register on the board which we’ll inspect while we are debugging.
Build, Deploy, and Debug on hardware
Set a breakpoint on RGB_LED_SET_R().
To see how the launch is controlled select view all files in the solution explorer and open .vs\launch.vs.json. You can see the miDebuggerPath set to use arm-none-eabi-gdb while the debugServerPath is set to invoke openocd with the configuration script in debugServerArgs. The information for describing peripheral registers is provided by the MCU manufacturer in an SVD file that we point to with svdPath. This project is configured to break on entry with the property stopAtConnect.
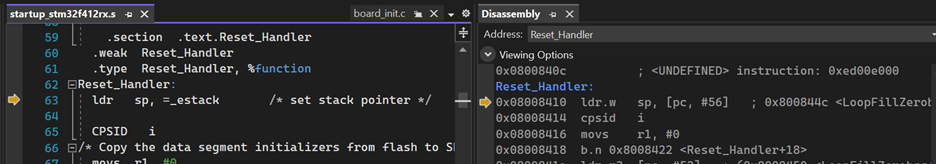
Now, with your board plugged into the PC (and ST-LINK drivers installed), set the debug target to Launch and F5 will work using openocd acquired by vcpkg to flash and debug the attached board. Execution stops at the entry function, so here we see the assembly code for that. We can also view the disassembly by going to the menu Debug > Windows > Disassembly.
Press continue to let execution continue.
Peripheral Registers
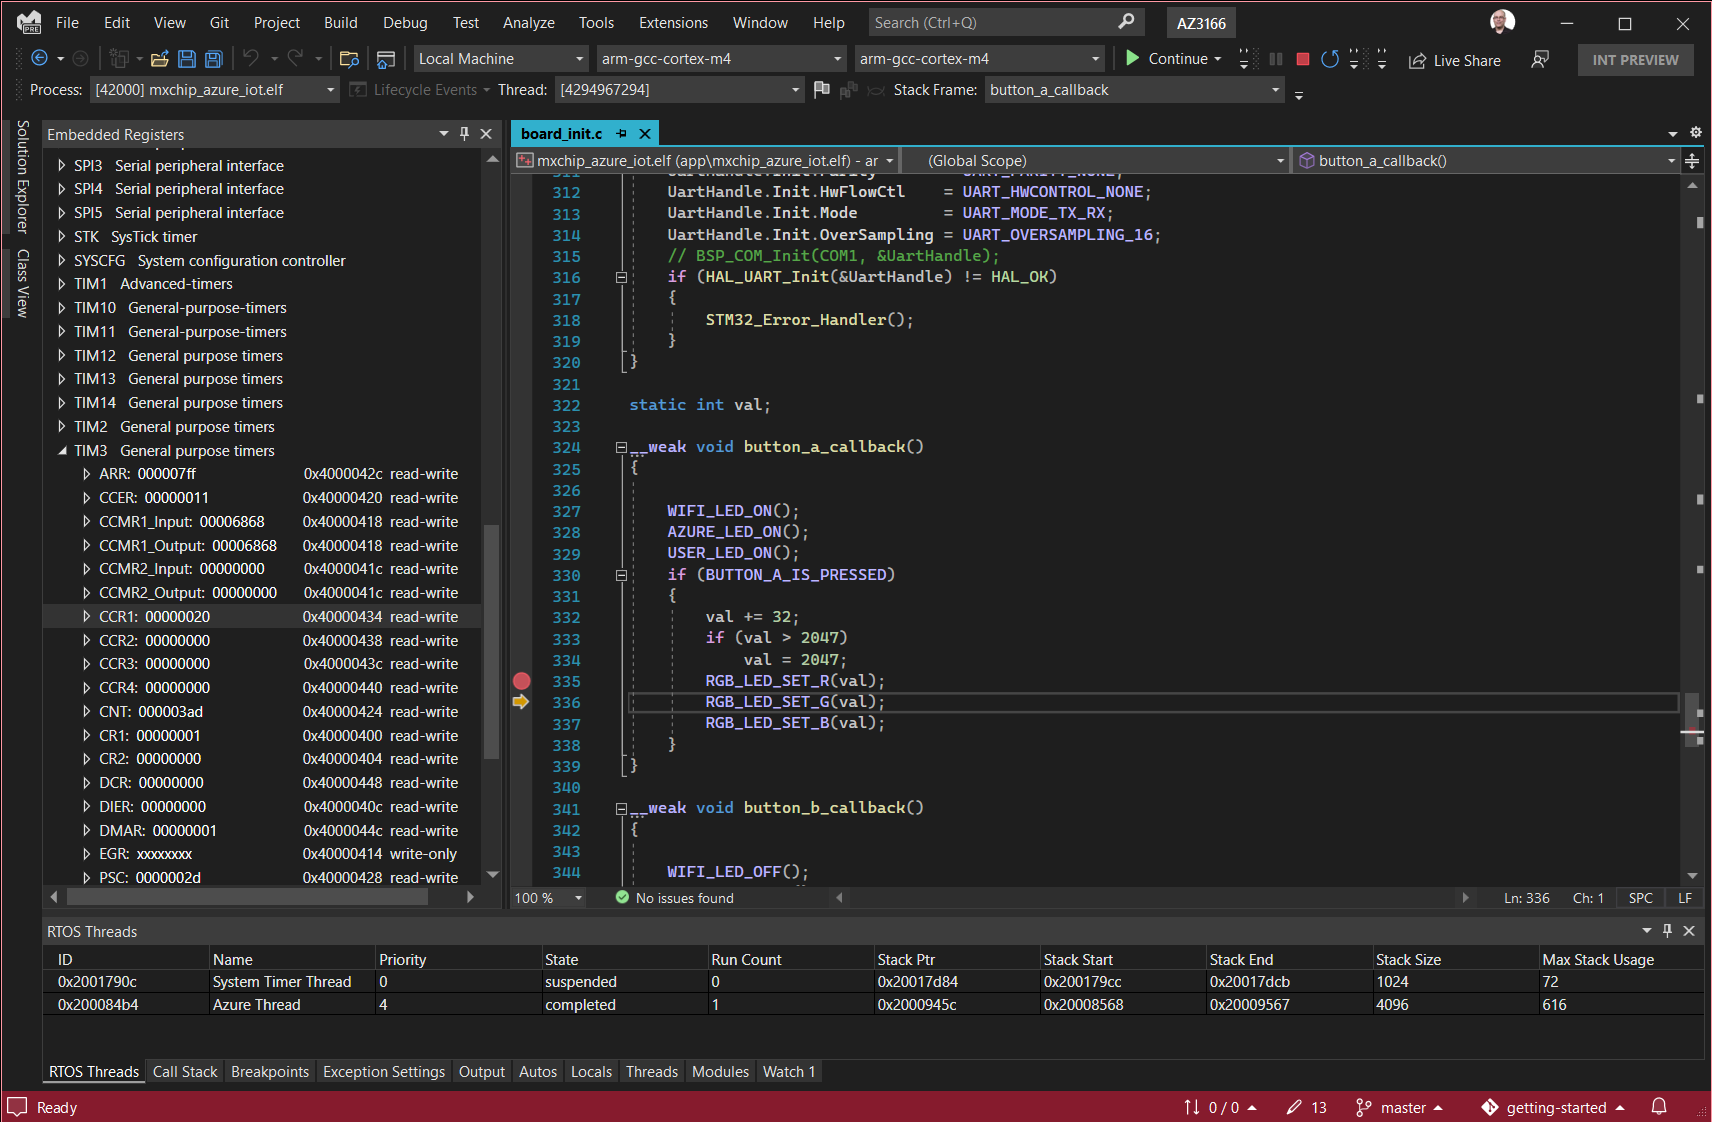
Now press the A button on the board. This has triggered our breakpoint. We can now go to the menu Debug > Windows > Embedded Registers. This opens the peripheral register view using the information from our SVD file specified in the launch configuration. We can now scroll through this list to find the register we are interested in, here TIM3->CCR1 which will update when we step over the RGB_LED_SET_R function.
On break
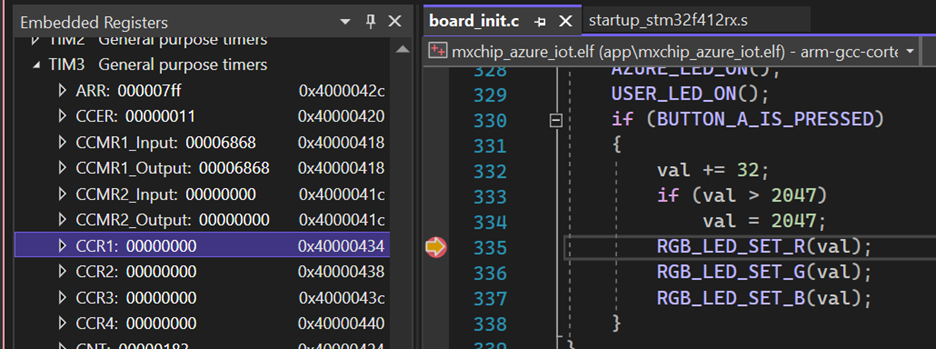
After stepping

RTOS Object Views
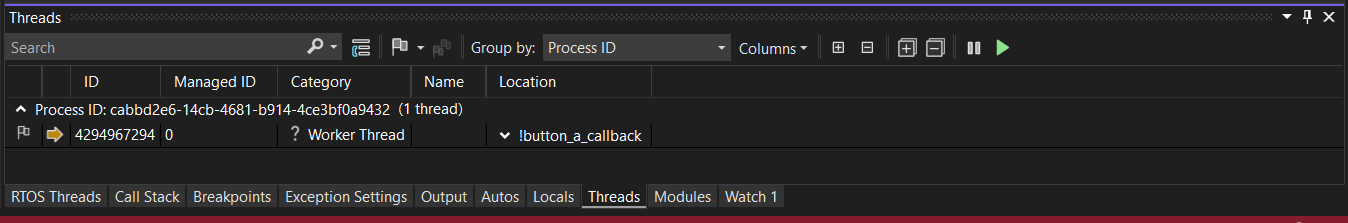
The application in the getting started project has several threads, but you won’t see them with the existing threads window.
Why not? A good explanation can be found in this white paper on Real Time Operating Systems.
“A Real-Time Operating System is system software that provides services and manages processor resources for applications. These resources include processor cycles, memory, peripherals, and interrupts. The main purpose of a Real-Time Operating System is to allocate processing time among various duties the embedded software must perform. This typically involves a division of the software into pieces, commonly called “tasks” or “threads,” and creating a run-time environment that provides each thread with its own virtual microprocessor (“Multithreading”). Basically, a virtual microprocessor consists of a virtual set of microprocessor resources, e.g., register set, program counter, stack memory area, and a stack pointer. Only while executing does a thread use the physical microprocessor resources, but each thread retains its own copy of the contents of these resources as if they were its own private resources (the thread”s “context”).”
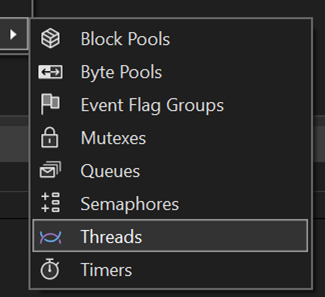
So for embedded development ideally you would have views that could show you information about these RTOS objects. To see the new available RTOS objects views, go to the menu Debug > Windows > RTOS Objects. Here you will see options for the objects that ThreadX provides, here we’ll select Threads.
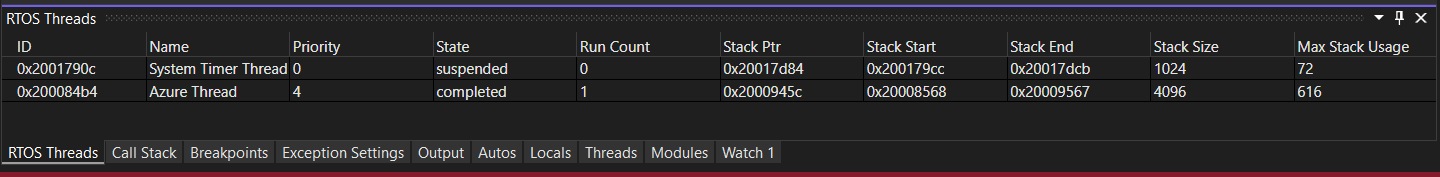
The threads view shows at a glance much of the information you would commonly need during embedded development, thread ids and names, how many times they have run, where the stack starts, ends, and its size as well as the maximum stack usage.
There are other views for additional ThreadX objects like block and byte pools, events, mutexes, queues, and timers. We also have RTOS object views for FreeRTOS though the available objects there differ based on what it supports.
Hardware breakpoint limits
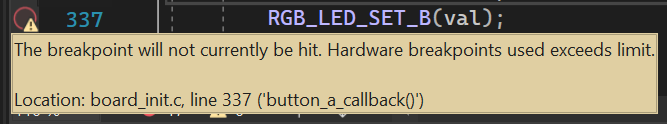
One last debugging capability to call out is that embedded hardware targets commonly have a limited set of hardware breakpoints available. Setting too many can corrupt the debugger state. As such we have added hardwareBreakpoints to launch.vs.json. For this board that is set to what it supports which is 6. If we set more than that we will see the breakpoint is not set and we get a warning that it won’t be hit. This prevents corrupting the connection to the board and allows us the opportunity to unset some other breakpoints and continue debugging uninterrupted.
Send us your feedback
We hope that these new capabilities will enable you to choose Visual Studio for your embedded development needs and make you more productive. We are very interested in your feedback to continue to improve this experience. The comments below are open, or you can find us on Twitter (@VisualC), or via email at visualcpp@microsoft.com.
If you are on Linux or Mac and looking for similar capabilities, yes, we will be bringing embedded development capabilities to VS Code soon as well. We have provided VS Code getting started guides for Azure RTOS the same boards as VS (Azure IoT DevKit, NXP 1060, and STMicro STM32L4_L4+), though today the capabilities are limited to acquisition with vcpkg, edit, build, deploy, and debug. Similar embedded specific views will be coming in a future extension.
It’s such a pleasure to use VS, the most powerful IDE in the universe. When try to use it for embedded devices, I got these error messages: “Unable to start debugging. Unexpected GDB output from commandline “-target-download”. Load failed.”
However, the GDB output is not visible, so I can hardly analyse the problem. Could the team change it a bit?
I’m glad to hear this, hovewer I’m not an embedded developer anymore. Just an idea: Make debugging compatible with Segger J-Link, that’s the king of embedded debuggers. Unlimited breakpoints, faster flashing, etc.
Does new Registry Window works with Azure Sphere platform (Mediatek MT3620)? 😉
Hi Marc,
I was following the instructions, but wanting to try to use a Silicon Labs dev kit instead of the MXChip board, I found that the vcpkg_configuration.json file is missing from the \getting-started\SiliconLabs\EFR32MG12\ folder. So I got stuck at the point of calling vcpkg activate.
I’ve discovered that all the vcpkg_configuration.json in the repo are the same, so I copied one into the Silicon Labs folder, and the project compiles.