So, you really liked learning about 7 Lesser Known Debugging Hacks for Visual Studio? Good news is that there is always more to learn! The Visual Studio debugger is an enchanting creature that can save you loads of time while finding and fixing issues in your application. It is bursting with tools that can make debugging easier… if you know they exist, and where to find them! Let’s look at 7 more lesser-known goodies you can use to #SuperChargeYourDebugging.
1. Edit the value of a variable without changing code
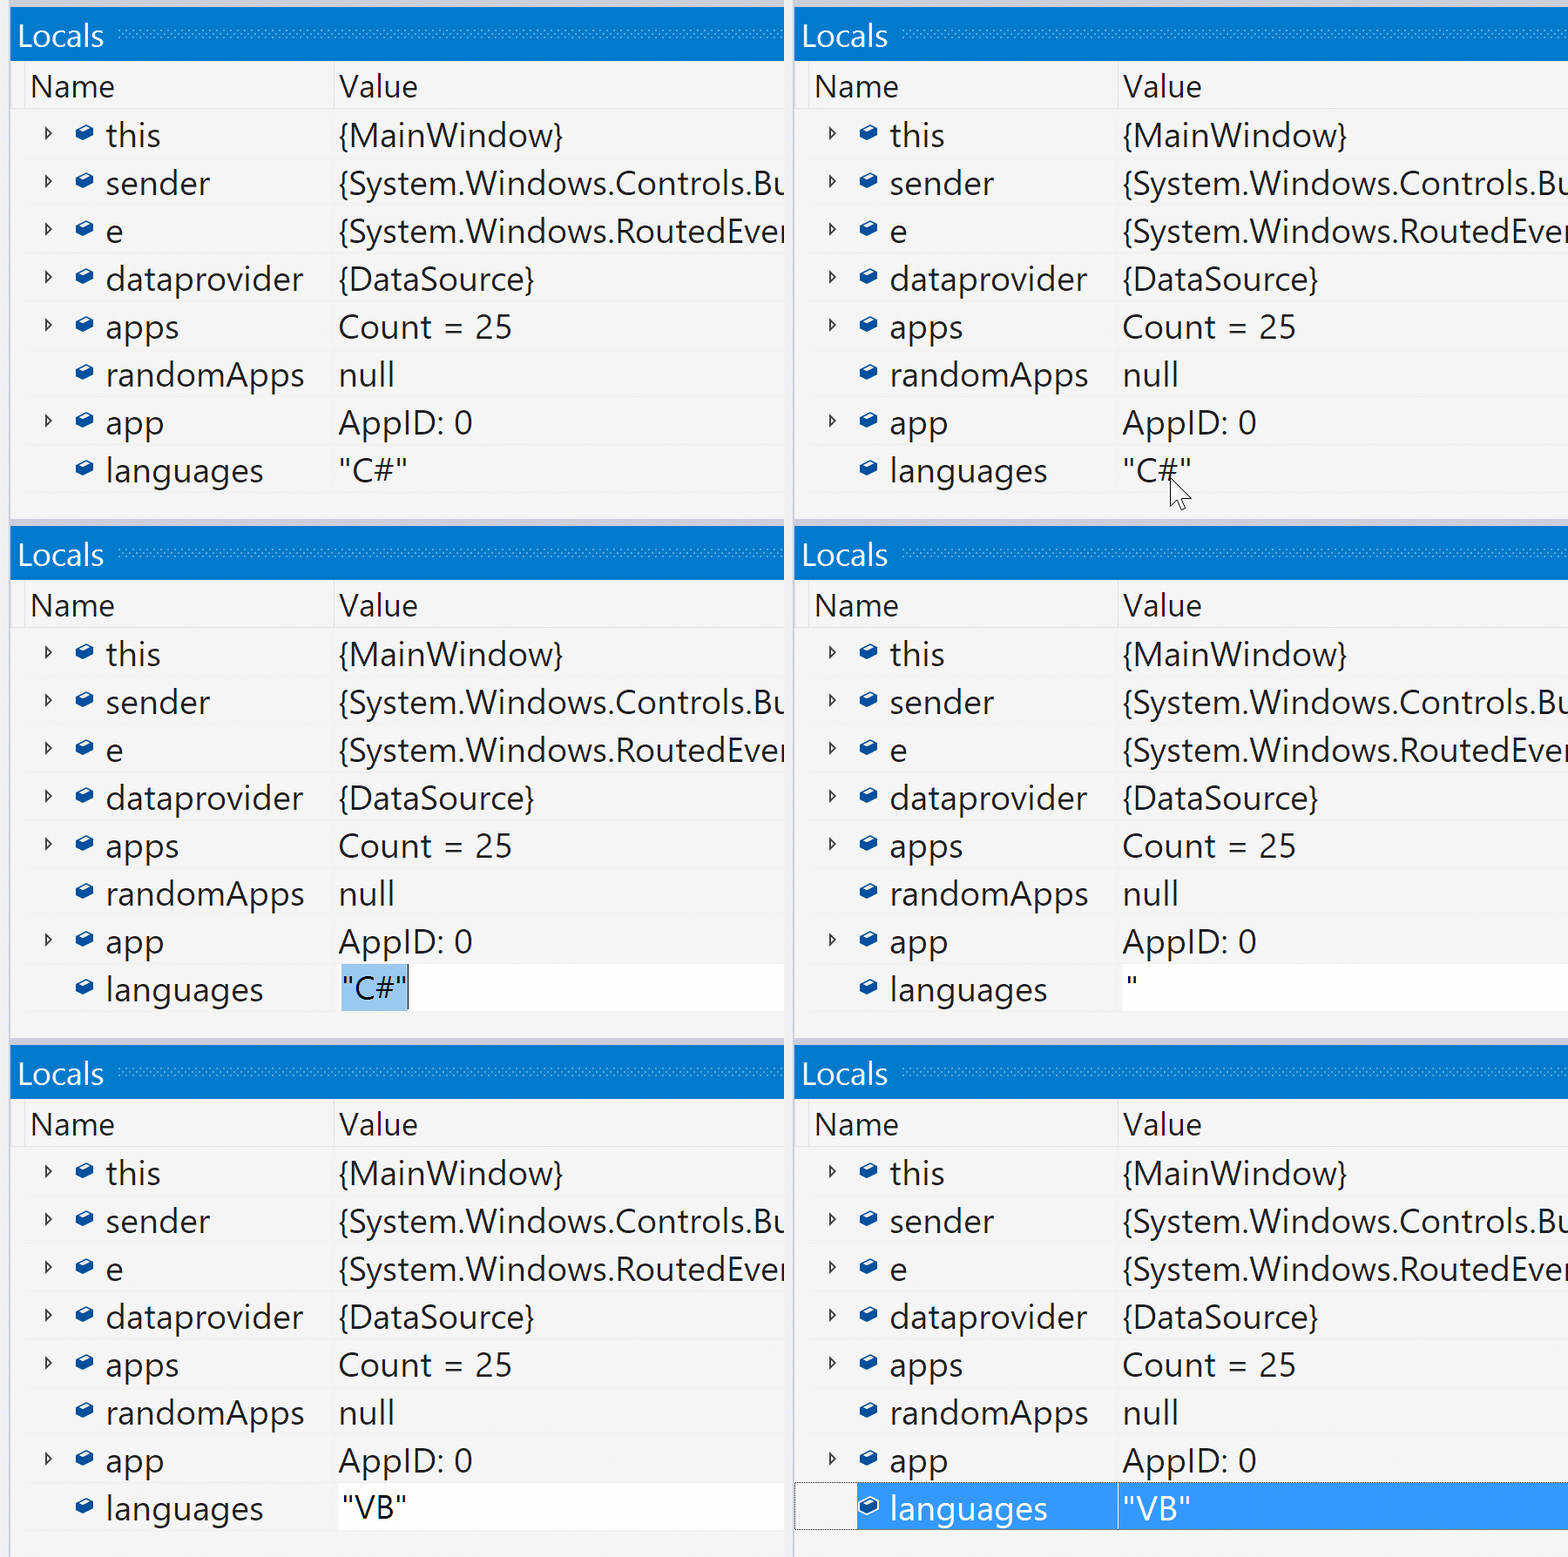
Are you ever debugging when you get to a variable and it isn’t what you think it should be? Or maybe you just want to change it to see how the code would behave with a different value? You can easily do this while debugging simply by editing the value of the variable in memory using whichever method fits best into your flow: DataTips, the Autos, Locals, or Watch windows, or the Immediate window.
A. Hover over the variable to get a DataTip and then single click on the value in the table or right click and choose “Edit value” from the context menu. An edit cursor appears and you can provide a new value for the variable.
B. In the Autos, Locals, or Watch windows double click on the value in the grid or right click and choose “Edit value” from the context menu. The value becomes editable and you can provide a new value for the variable.
C. In the Immediate window, you can use code syntax to reassign the variable to a new value. For example, you can type “x = 12;” which would change the in-memory value of the in-scope variable x to be the number 12. This method is most beneficial if you need to create or manipulate a variable before assigning it.
2. Look at values throughout recursive function calls
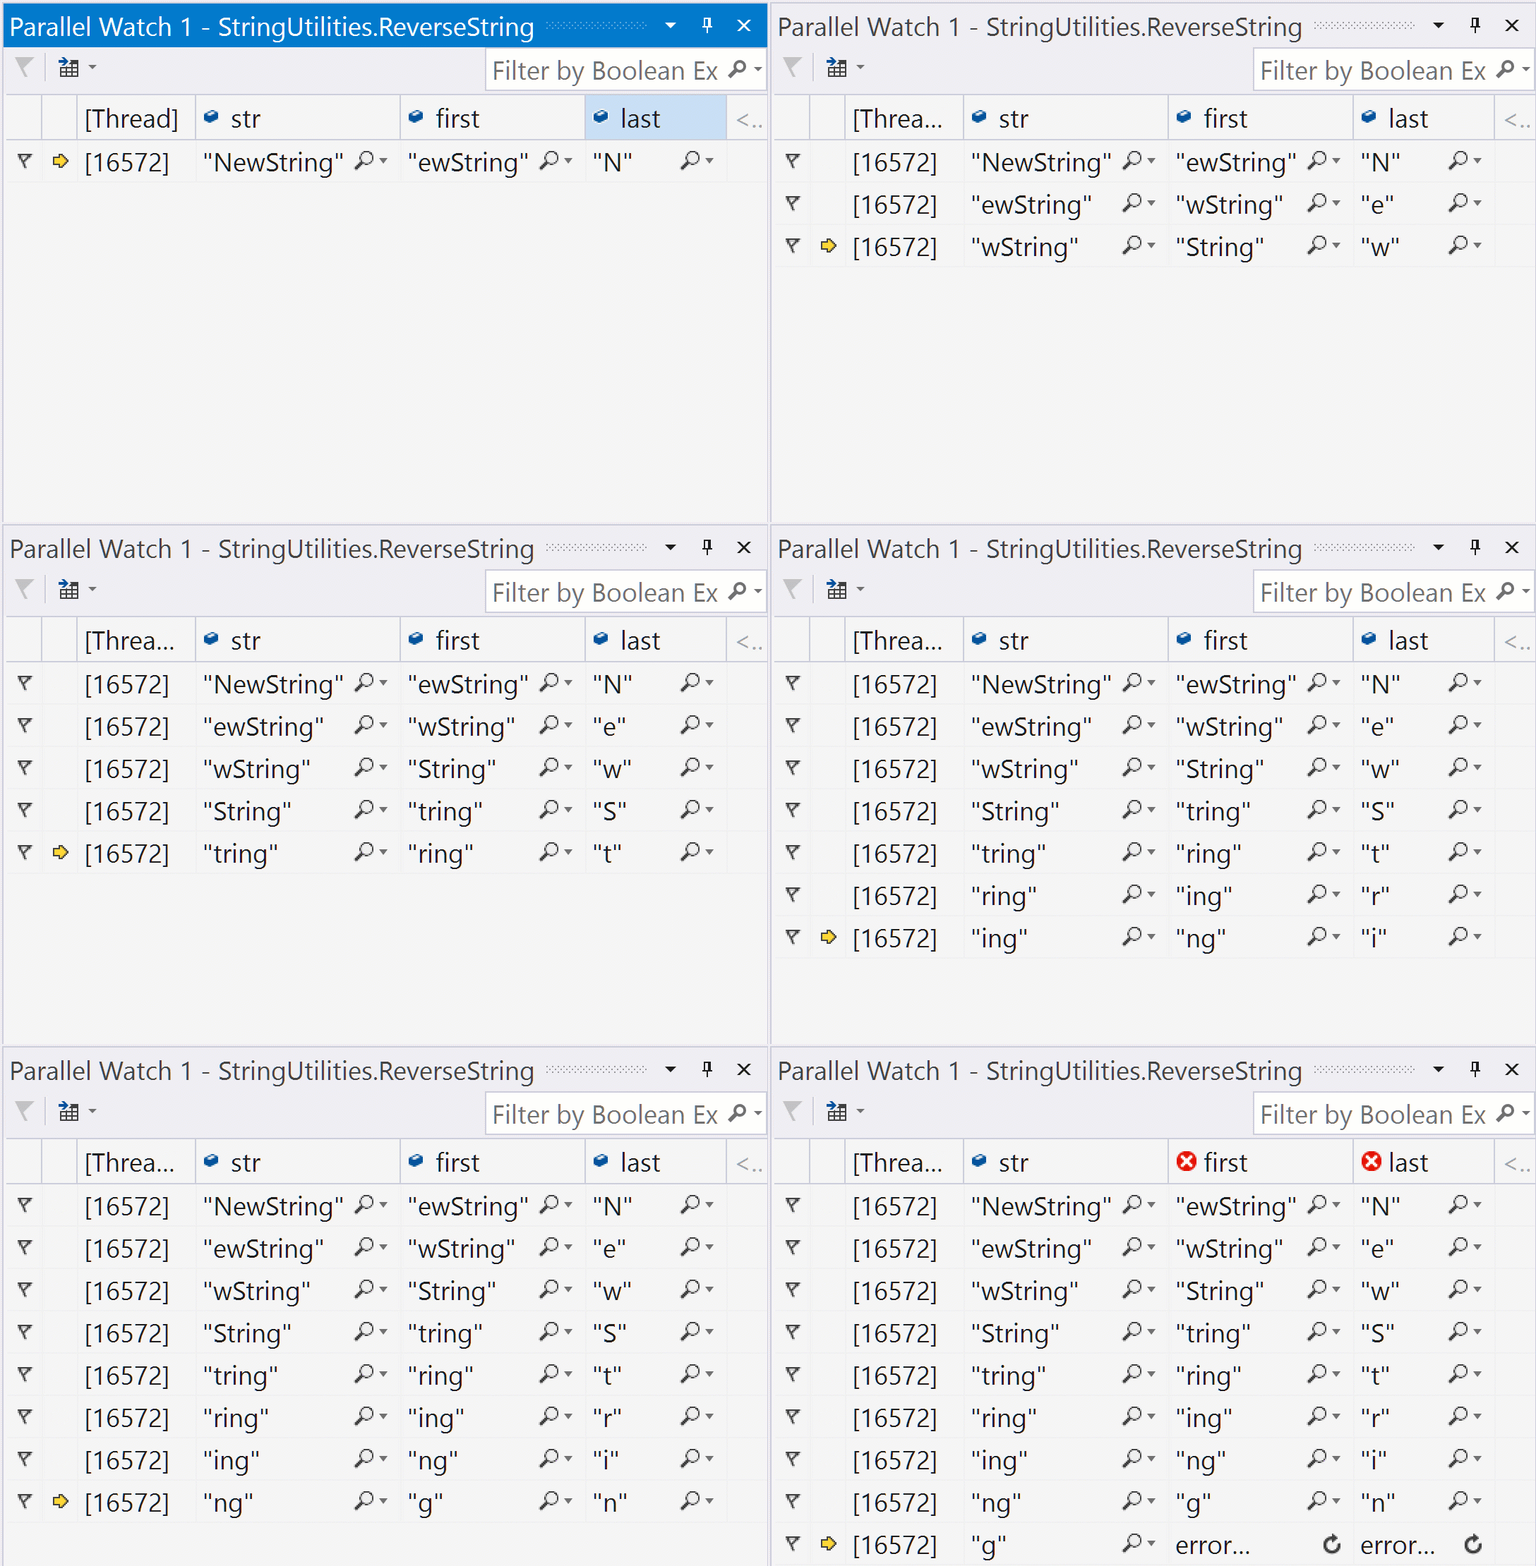
Do you typically find yourself debugging recursive functions using many statements of Debug.WriteLine()? It can be hard to keep in your head how the recursion will play out. One helper for this mental load, can be to use the Parallel Watch window to see the change in the variables of the recursive call.
- Open the Parallel Watch window (Debug/Windows/Parallel Watch).
- Click “<Add Watch>” and type in the name of a variable you care about.
- As you debug through the recursive calls, you will see them added in new rows in the window
3. Show parameter values in the Call Stack
Most developers use the Call Stack like a map for their current context in their debugging session. It provides history on where the code calls have happened to get into this state. It can be extra helpful to bring in additional information to orient yourself, like parameter values.
- Right click on a frame in the Call Stack.
- In the context menu select the option to “Show Parameter Values”
- Now see the values are inline directly as part as the input parameters in the Name column
Note: There can be performance impact to your debugging session when “Show Parameter Values” in on and the call stack is visible. We recommend turning the option off when you are not actively using it.
4. Break on a function without manually finding the source
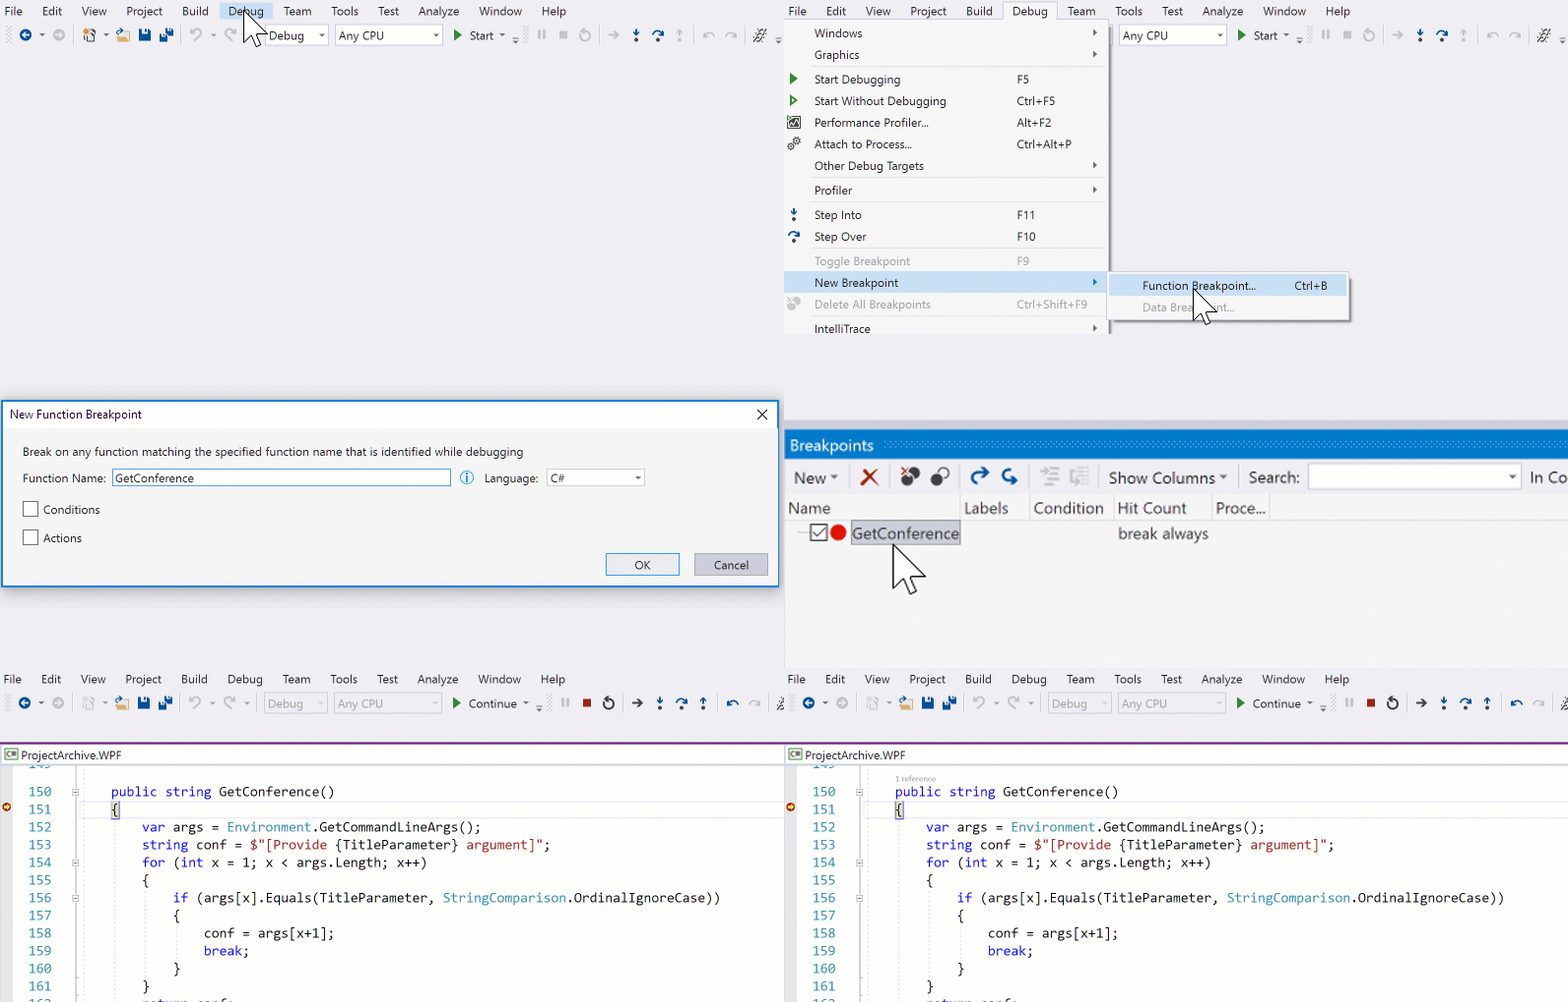
Are you ever thrown into a situation where you know what you need to debug, but finding the source file that contains that code is going to be a bit challenging? One quick way to set a breakpoint in the debugger without needing to know which file and line the code resides in is by setting a Function Breakpoint.
- Press CTRL+B. Or select Debug/New Breakpoint/Function Breakpoint.
- Type in the name of the function that you wish to break on. Click OK.
- Start debugging, trigger your code to execute, and watch as you stop at a magical breakpoint in a source file that you didn’t have to find manually.
5. Flag threads and run all of them to the same location
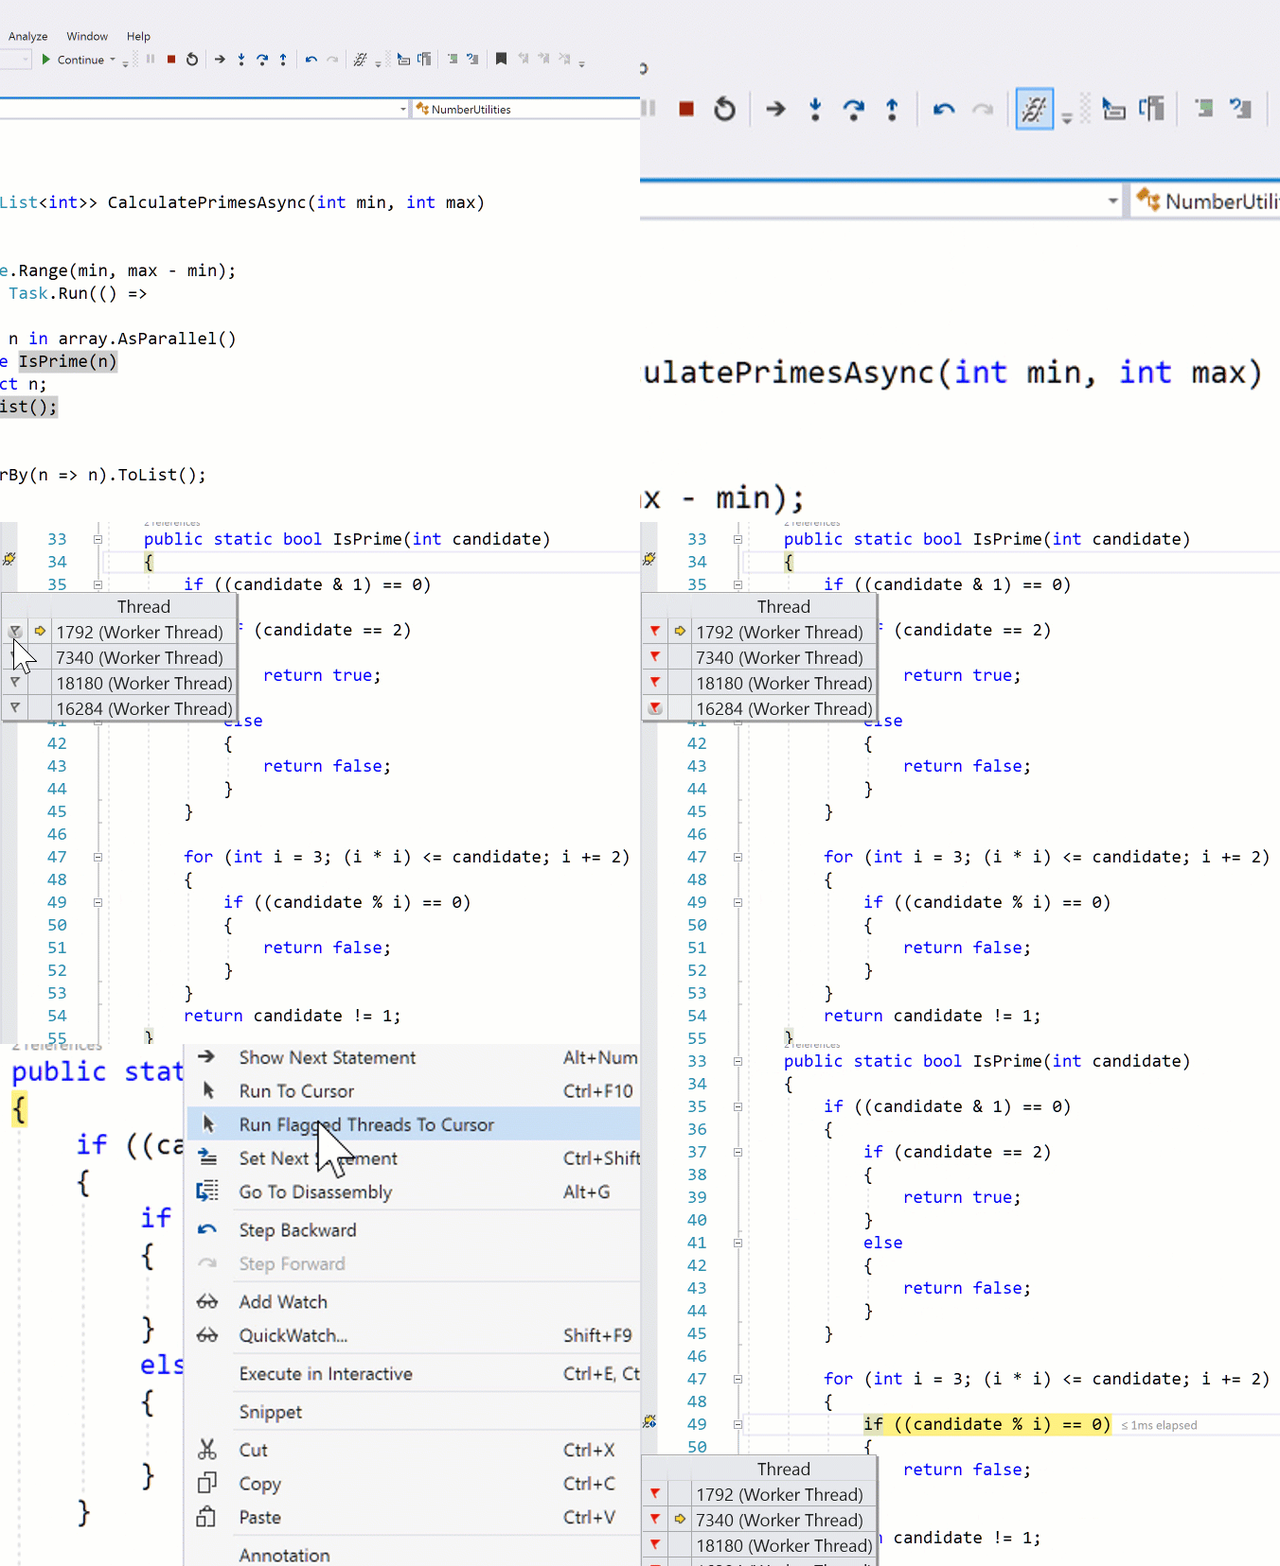
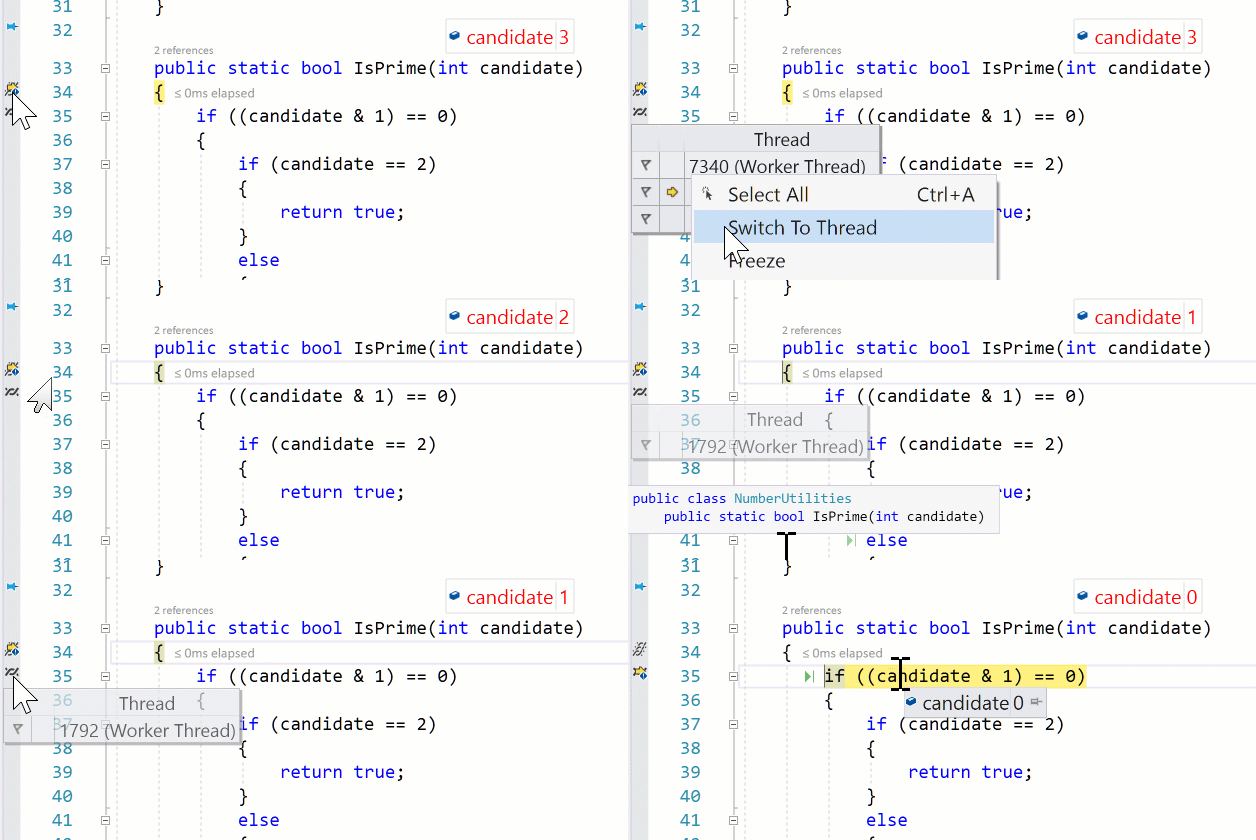
When debugging multithreaded code, odds are you are going to hit breakpoints and take steps that result in the program advancing other threads. Sometimes to inspect a bug, it might be easier to have all the threads stopped at the same place so you can inspect the state of the program at that time. There is an easy way to do this by flagging threads and then triggering Run Flagged Threads to Cursor.
- Figure out which threads you are interested in. You can use Show Threads in Source, the Parallel Debugging windows, or the Threads window.
- Choose the Flag icon to mark the threads you are interested in.
- Right click on the line of code where you want to inspect the application.
- In the context menu select Run Flagged Threads to Cursor.
Note: There can be noticeable performance impact to your debugging session when Show Threads in Source is turned on or any threads related windows are visible. We recommend only choosing these features when you are actively using them to debug.
6. Switch active threads to see the context
The parallel watch window is great for seeing many variables across threads, even ones that you have not stopped on. But what about when you want to inspect a detailed state of the application on that thread? The yellow arrow shows the current instruction on the current thread and that sets the context for the rest of the debugger. The Watch windows, Data-tips, and Call Stack all show the state at this context. The debugger makes it easier for you to switch this context by letting you Switch to Thread…
- Select the thread that you want to inspect. You can identify it using Show Threads in Source, the Parallel Debugging windows, or the Threads window.
- Right click on the thread, and select Switch to Thread… and choose your thread.
- Notice how the yellow arrow changes to that thread’s location and the other windows now have that context.
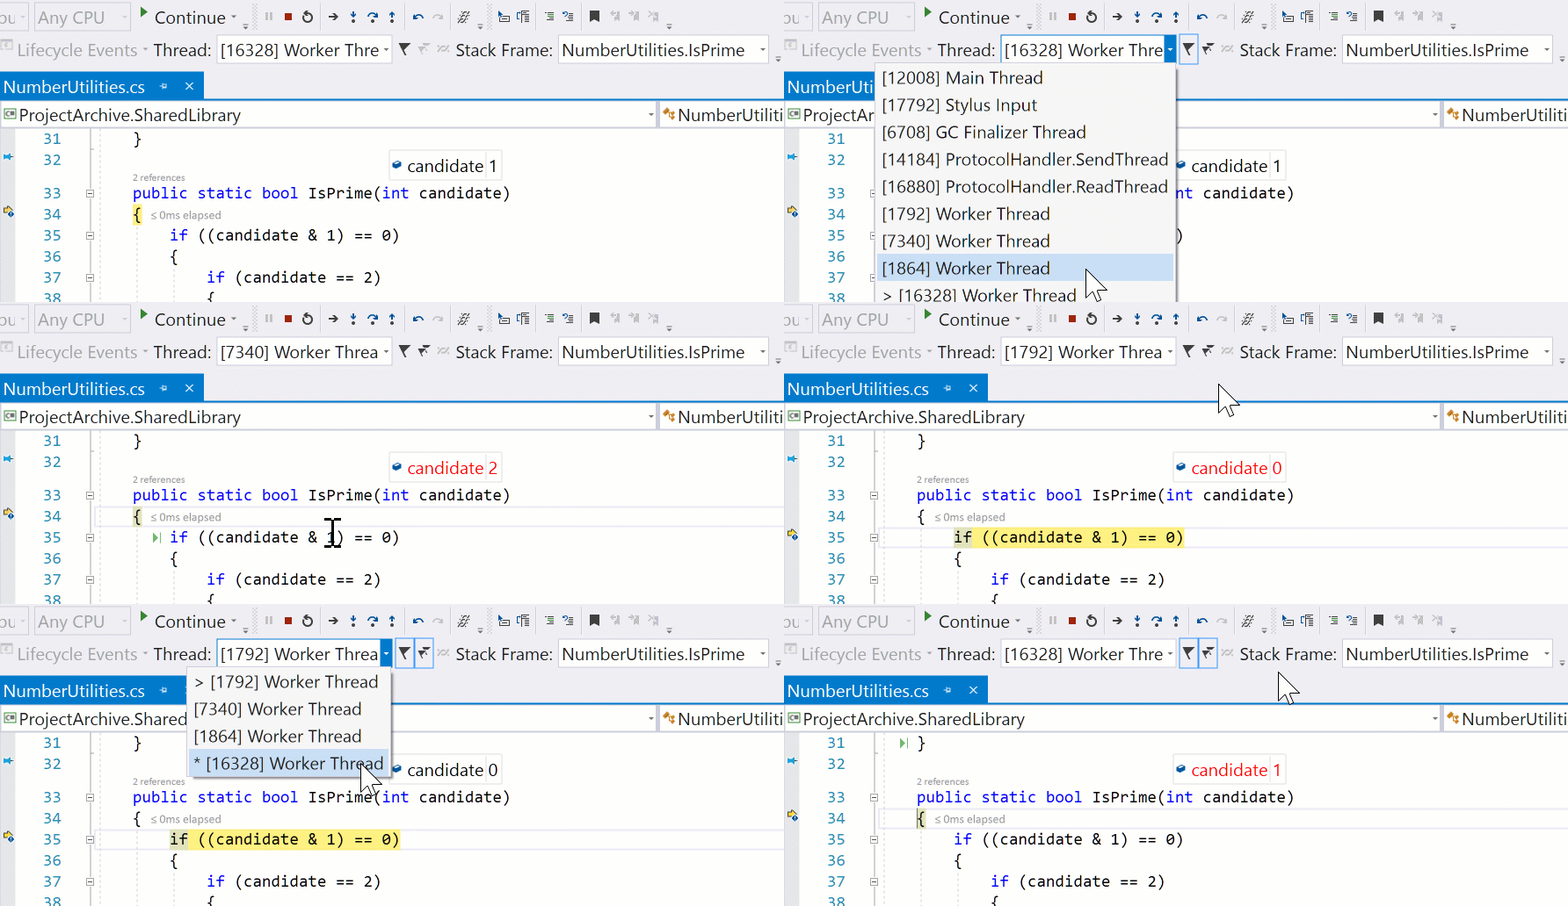
You can also switch your current debugger context by using the Debug Location Toolbar. Click the drop down that enumerates the threads in the program and select a thread to switch to. The Debug Location Toolbar is a great tool to use if you are noticing performance impact from having other thread related features visible. The features of this toolbar do not significantly impact performance and can be used as a shortcut for many threaded scenarios I mention.
Note: There can be noticeable performance impact to your debugging session when Show Threads in Source is turned on or any threads related windows are visible. We recommend only choosing these features when you are actively using them to debug.
7. Stop when a variable value changes in C++ code
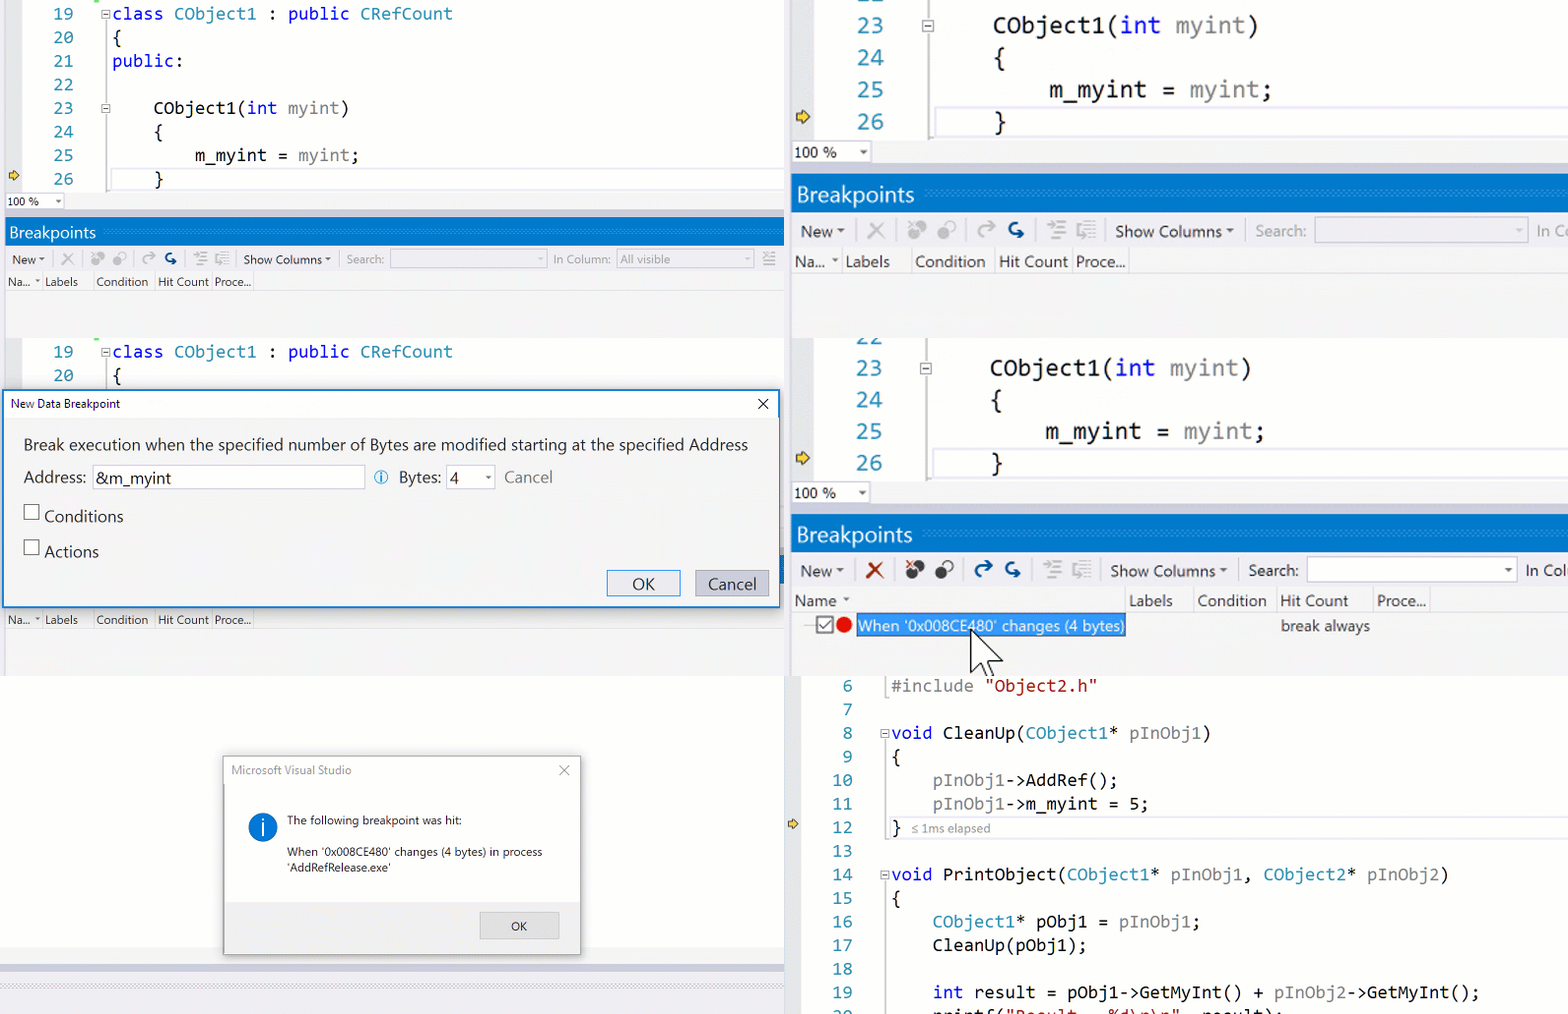
It can be hard to track down where a specific variable is changing its value. For native developers there is a special breakpoint type, the Data Breakpoint, that can help you track down issues caused by variables being manipulated unexpectedly.
- Stop at a place in code after your object has been created in memory.
- Select Debug/New Breakpoint/Data Breakpoint.
- Type in the address of the variable you want to know about. For example, &MyVariableName, or 0x0085F918
- Select the number of bytes starting at that address that you wish to monitor.
- Trigger the breakpoint and the debugger will stop on the line of code that modified that memory address.
Note: It is important to remember that memory addresses are different every time you start debugging so you will need to clear out and reset your Data Breakpoints every time you start a new debug session. The number of Data Breakpoints that you can have active at a time is limited by the hardware of your environment and the debugger will warn you when you reach that limit.
Learned Something? Let us know!
What is your favorite lesser known debugging feature? Comment below!




0 comments