I’ve been working on developer tooling for over 16 years, and I still love it when I find a new tip or trick that shaves seconds off a repetitive task. The set below are features that I see infrequently used but can save loads of time!
Gem #1 – Expression Evaluator Format Specifiers
The part of the debugger that processes the language being debugged is known as the expression evaluator (EE). A different expression evaluator is used for each language, though a default is selected if the language cannot be determined. The expression evaluators have some lesser-known features, and though they aren’t always standardized across languages, they come in handy now and then.
A format specifier, in the debugger, is a special syntax to tell the EE how to interpret the expression being examined. There are many format specifiers that are understood by the C++ EE, and a smaller set understood by the C# and VB EEs.
As an example, imagine that you want to call a method every time you step to see what the updated value is. You’re probably used to seeing this and having to click on the refresh icon:
However, you can use the ‘ac’ (always calculate) format specifier to force evaluation on every step.
I also find the ‘h’ (hexadecimal) format specifier useful. You can leave the global display of the debugger alone, but update a single watch item to report in hex by using ‘value,h’.
You can read about all of the different format specifiers for both C++ and C#/VB.
Gem #2 – Controlling the value column of the debugger
The measure of a modern debugger is its ability to display runtime object data in a simple and meaningful way. As such, when the debugger displays this information, it needs to show the most interesting values prominently. Unfortunately, it is difficult for the debugger to analyze arbitrary objects and figure out what is ‘most important’. The only generic solution is for you to control what the debugger displays; which leads us quite nicely into attributed debugging.
Attributed debugging gives the author of the type the ability to specify what it looks like when being debugged. The simplest form of this is the DebuggerDisplayAttribute. Imagine debugging the following code:
class Person
{
    public string FirstName;
    public string LastName;

    public Person(string first, string last)
    {
        this.FirstName = first;
        this.LastName = last;
    }

    public string FullName { get => $"{LastName}, {FirstName}"; }
}


class Program
{
    static void Main(string[] args)
    {
        List<Person> presidents = new List<Person>
        {
            new Person("George", "Washington"),
            new Person("John", "Adams"),
            new Person("Thomas", "Jefferson"),
            new Person("James", "Madison"),
            new Person("James", "Monroe")
        };
    }
}
If you set a breakpoint on the closing brace of Main, and examine presidents, you’ll see something like this:
If you want to examine the properties of James Madison, then you must know that he was the 4th president. You could override ToString in Person; the EE will call ToString if it’s overridden. However, that causes a function evaluation, which can be hundreds of times slower than normal data inspection, and it may be that the debug ‘view’ of the data should be different than the ToString view. For those cases you can use DebuggerDisplay as follows:
[DebuggerDisplay("Name: {FullName,nq}")]
classPerson
This updates the display, to the more scannable:
You can include format specifiers in the expression to evaluate. In this case ‘nq’ means ‘no quotes’ when displaying the string.
Gem #3 – Showing important values when an object is expanded
We now have an easier time finding James Madison without expanding every node; however, after we expand, we see the following view:
This shows a lot of duplicative information, and in this case, we don’t really need it. Not only that, but it consumes 3 full rows of the watch window, where vertical space is precious. Since we know how FullName is calculated we’re comfortable never seeing FirstName or LastName when a Person is expanded. This is achieved through the DebuggerBrowsableAttribute. For example, if we add the following attributes:
[DebuggerBrowsable(DebuggerBrowsableState.Never)]
public string FirstName;
[DebuggerBrowsable(DebuggerBrowsableState.Never)]
public string LastName;
Our view updates to:
You can learn more about attributes that control the debugger data window views here. There are several other attributes that can control the behavior and look of the debugger, that we’ll likely talk about in future posts!
Gem #4 – Applying view customizations to framework types
You may not always control the source for the types that you’d like to make easier to view. Imagine you have the following:
class Program
{
    static void Main(string[] args)
    {
        IPHostEntry hostEntry = Dns.GetHostEntry("bing.com");
    }
}
It sure would be nice if IPHostEntry showed the HostName property in the value column, without having to expand it.
The DebuggerDisplayAttribute has an optional parameter for TargetType. This can be used in conjunction with setting the DebuggerDisplayAttribute at the assembly level, to customize types even when you cannot modify their source.
Visual Studio ships with a file called autoexp.cs & autoexp.dll (auto expand) in <visual studio install location>\Common7\Packages\Debugger\Visualizers\Original. This file already has several DebuggerDisplay attributes that customize common framework types. We can modify it from an elevated command prompt and add the following:
[assembly: DebuggerDisplay("Host: {HostName}", Target = typeof(IPHostEntry))]
We then compile it, again from an elevated developer command prompt, with the command line “csc /t:library autoexp.cs”. The next time we debug our program, we’ll now see:
This allows for powerful, time-saving, customizations of your own types, frameworks you ship to others, and any code on which you depend.
Although the examples above focus on managed code, similar customizations can be made to the C++ debugging experience, including global view modifications via autoexp.dat, as documented here.
Gem #5 – Snippets
The tips above are focused on debugging code that’s already been written. What about when you need to pump out new code quickly? I expect many of you may already be familiar with the built-in Code Snippets, but it’s worth mentioning that Snippets are extensible. There are default directories that are registered where you can store your own code snippets. For example, for C#, that location is %userprofile%\Documents\Visual Studio 2017\Code Snippets\Visual C#\My Code Snippets.
In 2005, when Snippets were first introduced, a common demo of adding a new snippet for C# was to create a ‘dim’ snippet, so that you wouldn’t have to enter the type name twice when instantiating a type in C#. The introduction of implicitly typed local variables via ‘var’ somewhat eliminated the need for such a snippet; however, some coding guidelines preclude using var as it can impact readability. So, let’s introduce a new ‘var’ snippet, called var.snippet, of the following form:
<?xml version="1.0" encoding="utf-8" ?>
<CodeSnippets  xmlns="http://schemas.microsoft.com/VisualStudio/2005/CodeSnippet">
  <CodeSnippet Format="1.0.0">
    <Header>
      <Title>Var</Title>
      <Shortcut>var</Shortcut>
      <Description>Code snippet for instantiating an object with full type info</Description>
      <Author>Anson Horton</Author>
      <SnippetTypes>
        <SnippetType>Expansion</SnippetType>
      </SnippetTypes>
    </Header>
    <Snippet>
      <Declarations>
        <Literal>
          <ID>type</ID>
          <Default>Example</Default>
          <ToolTip>The type to construct</ToolTip>
        </Literal>
        <Literal>
          <ID>variable</ID>
          <Default>example</Default>
          <ToolTip>The variable name</ToolTip>
        </Literal>
        <Literal>
          <ID>args</ID>
          <Default></Default>
          <ToolTip>The constructor arguments</ToolTip>
        </Literal>
      </Declarations>
      <Code Language="csharp">
        <![CDATA[$type$ $variable$ = new $type$($args$);$end$]]>
      </Code>
    </Snippet>
  </CodeSnippet>
</CodeSnippets>
Now if we type var in a C# file, and hit <tab><tab>, the following will be inserted:
We can tab through the literals, and as we update the type name, any other reference to that same literal will be updated!
Code snippets are supported in many Visual Studio languages including Visual Basic, C#, CSS, HTML, JavaScript, TSQL, TypeScript, Visual C++, XAML and XML. You can read more about that support here.
Gem #6 – Derived types
In some cases, when exploring a codebase, it’s useful to be able to see all the types that derive from a base class. This can be particularly true for large, heavily factored frameworks, like Universal Windows or the .NET Framework. It’s possible to use Object Browser to do this for you!
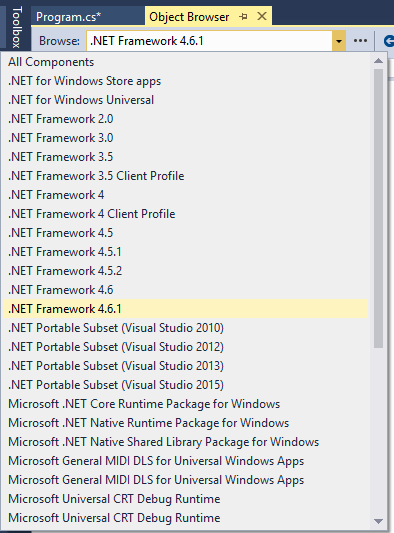
Object Browser is extensible, by creating a library manager. This is important for this tip because different library managers support different functionality. The C# Library Manager does not support locating Derived Types, so if you use the ‘My Solution’ component set, then you will not see this option. The ‘My Solution’ component set is the default, but you can change it by the drop-down that appears at the top of the Object Browser (there are many options). Let’s select the .NET Framework 4.6.1:
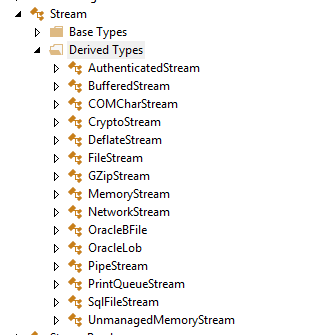
Now, if you want to locate all the derived types of System.IO.Stream, you simply navigate to the type and expand the ‘Derived Types’ folder. This is an expensive operation, so expect to wait a fair bit of time for the result to come back.
This works for any assembly or framework; however, to use it for items that you have referenced in your solution, you must first add them to a separate ‘custom component set’ (the … next to the drop-down), so that the correct library manager is used.
Gem #7 – Find combo
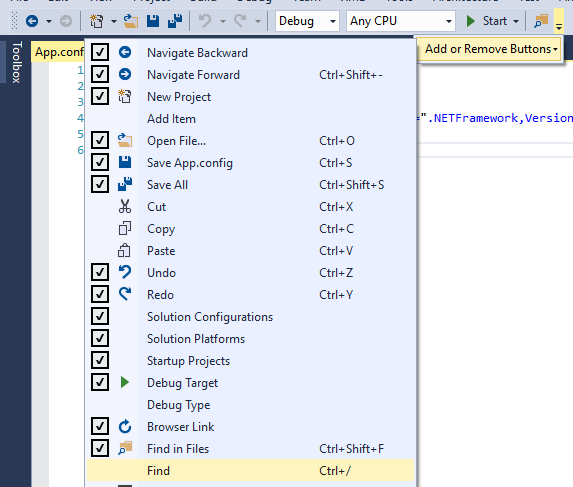
There is a little-known toolbar combobox called ‘Find’. It’s on the standard toolbar, but in most settings files its hidden by default. You can show it by clicking on the drop-down of the standard toolbar, the down arrow at the far right of the toolbar that has the back and forward buttons on it, and selecting Add or Remove Buttons and then the Find option.
This will cause a new combobox to appear on the toolbar, usually to the far right. Depending on your settings choice, the keybinding for this combobox is Ctrl+/.
The combobox is deceptively named. It’s true that if you type in text and hit enter, then the combo will do essentially the same thing as Quick Find within the current document (and successive enters ‘Find Next’). However, this combo does so much more!
The combobox doubles as a small viewport into the command window. So, if you prefix your text with the greater than symbol, you can enter in any command! If you want to open a file, with completion, you could type ‘>of <filename>’, where of is an alias for File.OpenFile:
Similarly, you could type ‘>GotoLn 20’ to go to the 20th line in the current document.
The combobox will also pass the text entered to any command that’s bound to a shortcut. For example, it’s possible to open App.Config (without completion) by typing in App.Config and hitting Ctrl+O. Or, you could set a breakpoint on a function by typing in the function name, like ‘Program.Main’, and hitting F9.
Conclusion
I hope you’ve found a few of these hidden gems useful, either as reminders of lesser used functionality, or as discovering something new!
Do you have hidden gems of your own? Share in the comments below.


0 comments