Today we released PIX version 2408.05, which can be downloaded here. This release includes a lot of new improvements in GPU Captures, Timing Captures and the System Monitor, including:
GPU Captures
- Custom Mesh/Texture Visualizers -> write your own HLSL code to process textures and meshes inside the PIX UI!
- Faster playback times
- Many Shader Debugging improvements
- See inline HLSL source when viewing DXIL
- See source files in callstacks
- Many other improvements
- New plugins from AMD, Intel and NVIDIA
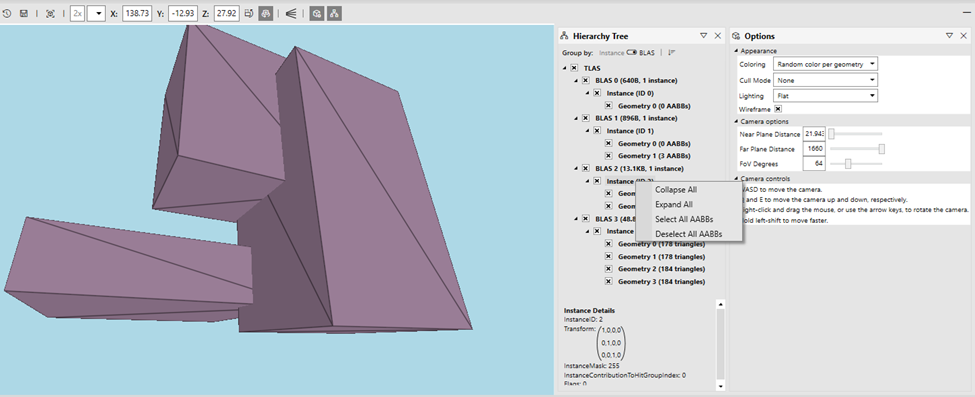
- Acceleration Structure Viewer improvements
Timing Captures
- Bookmarks in the Timeline Layout
- New Comparison Layout
- Save GPU System Monitor counters into your Timing Capture
- Support for Profiling Multiple Processes
Other
Almost all of the new functionality in this release was added in direct response to customer feedback we received. Please continue to reach out to us with your thoughts, feedback, and bug reports! The best ways to reach us are via the “Send Feedback” button in the top-right of PIX and via the #pix channel on the DirectX Discord.
GPU Captures
Custom Mesh/Texture Visualizers
Read the full documentation over on learn.microsoft.com.
This release adds the ability to write and load your own custom HLSL files in the PIX UI to visualize textures and meshes in your own way. Your HLSL code can read data from the selected texture/buffer for the selected event, as well as read/sample most other command list state during the event, including any descriptor in the bound descriptor heap, Render Targets contents, Vertex Buffers and the Index Buffer.
Some examples of things that can be done with custom visualizers:
- Visualize custom virtualized geometry meshes used by your renderer
- Highlight NaNs or Infs in your texture
- Draw the VB/IB mesh over your RTV
Your HLSL extension can be used in both PIX on Windows and Xbox PIX! This PIX on Windows release has some additional features that are not currently available in Xbox PIX, but the next Xbox PIX release will have feature parity.
We think these custom visualizers are a powerful new way to extend PIX and visualize your renderer’s data within PIX. If you try them out then please let us know via the usual ways!
Faster playback times
This release continues our ongoing work to make PIX faster! This release makes significant changes under the hood to enable much better multithreading than we could do before. This will particularly speed up playback times for applications that were limited by PSO compilation speed today.
| Application | Start Analysis Times (cold shader cache) | |
| PIX 2405.15 | PIX 2408.05 | |
| Famous AAA game engine demo (non-DXR) | 12 secs | 7 secs |
| Famous DXR game that makes heavy usage of DXR collections | 145 secs | 14 secs |
Shader Debugging Improvements
This release includes many shader debugging improvements, including:
See inline HLSL source when viewing DXIL
This release adds the ability to see your HLSL code inlined inside your DXIL code, when symbols are available. It also adds related notifications (with handy shortcuts in them!) at the top of the DXIL view for issues such as unresolved PDBs, slim PDBs that need to be converted into full PDBs, or unapplied edits.
See source files in callstacks
The shader callstack view now shows the source file for each entry in the stack: 
Many other shader debugging improvements
- DXR : Rebind breakpoints when switching between DXR invocations
- Speed up displaying DXIL (particularly big improvement for state objects!)
- Fix crash in watch view when adding empty strings
- Fix for “double raygen invocations” issue
- Fix go to entry point for slim PDBs
- Fix WARP shader debugging if PS doesn’t use SV_Position
- Auto resize autos/watch columns
- Fix same-named HLSL files “from same directory” (e.g. apps that name all of their shaders hlsl.hlsl)
- Fix rare crash viewing a buffer after shader debugging
- Fix incorrectly numbered DXIL disasm (that broke debugger line mapping)
New IHV plugins
This release includes new plugins from AMD, Intel and NVIDIA! Many thanks to our IHV partners for their continued support of PIX.
- New AMD plugin
- Adds support for additional RDNA 3 based APUs.
- Adds percentage counters for both Event List Counters and Timeline Counters.
- Removes several counters from different versions of hardware due to discovering inconsistencies in their results. Please see this link for the full list of disabled counters.
- New Intel plugin
- Fixes a delay for metrics collection initializing and fixed the correlation shift.
- Adds a new power state “ignore” option that allows for the complete disabling of GPU frequency override.
- Adds support for new graphics platforms.
- New NVIDIA plugin
- Added new metrics for the NVIDIA Ada and Ampere architectures (40-series and 30-series).
Acceleration Structure Viewer improvements
- Added Simple Shading and Wireframe option
- Added front/back cull mode option
- Added right-click Select/Deselect AABBs option to the hierarchy tree
- Adding new camera controls, such as near/far plane distances and FoV
We will continue to make improvements in future releases! Please let us know what improvements you would like to see.
Timing Captures
Bookmarks in the Timeline Layout
Developers can now add bookmarks, or annotations, to lanes in the Timeline layout of Timing Captures.
Bookmarks are text notes that can be added at either a specific point in time, or to a range of time, on any lane in the Timeline. These notes are used to annotate aspects of a capture that are interesting from a performance perspective. Bookmarks are saved in the capture, thereby allowing one developer to add a note for another developer to look at. The ability to save and share bookmarks helps developers collaborate on captures within a studio. The Summary layout provides a list of all bookmarks in the capture, along with hyperlinks to navigate to individual bookmarks in the Timeline layout.

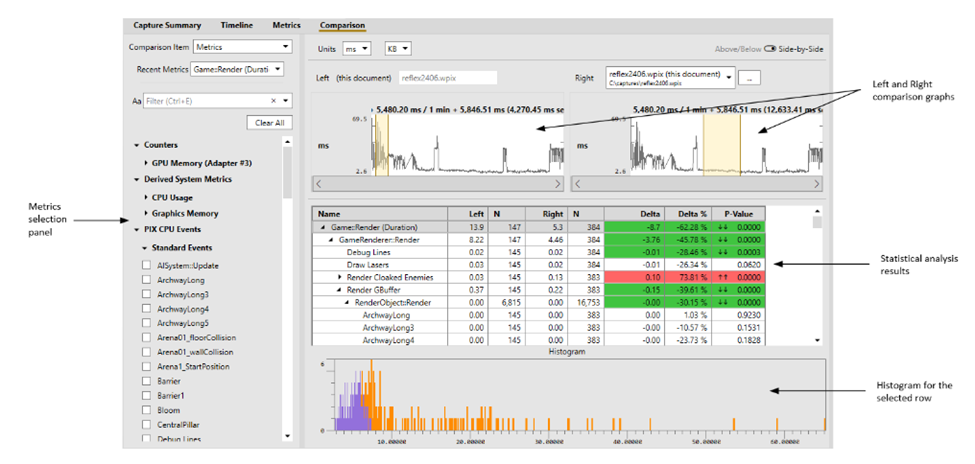
New Comparison Layout
The Timing Capture comparison features have been moved from the Metrics view to a new dedicated Comparison Layout. This layout improves several comparison workflows, including the ability to compare multiple captures.
The layout consists of a metric selection panel, graphs for the left and right set of points to be compared, a table showing the results of the comparison, and a histogram of the values of both the left and right sets of points for the selected row in the table. The set of points for the right hand side of the comparison may come from a different capture than the points from the left hand side of the comparison.
Save GPU System Monitor counters into your Timing Capture
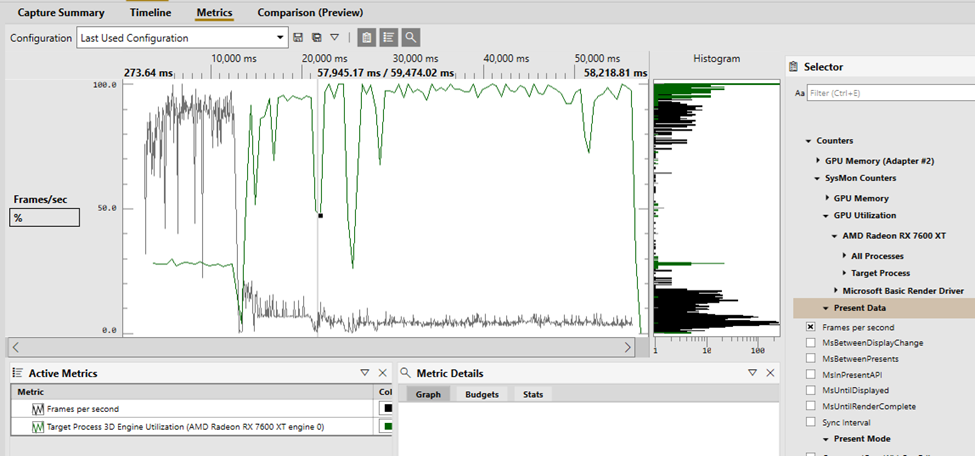
Enable the Capture SysMon counters option when taking a capture to collect counters present in the System Monitor (aka SysMon), and save them into your Timing Capture file. This includes various counters related to GPU performance. Notably, there are counters for:
- GPU utilization broken down by GPU engine for both the target process and all processes.
- Presentation data, like frames per second (and the inverse, in milliseconds, MsBetweenPresents) and MsUntilRenderComplete (time between a present start and GPU work completion).
- GPU Memory information, including local and non-local memory usage, residence, and budgets.
Support for Profiling Multiple Processes
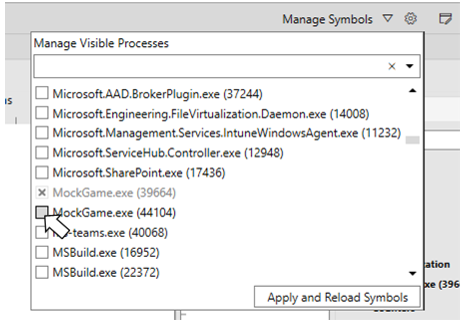
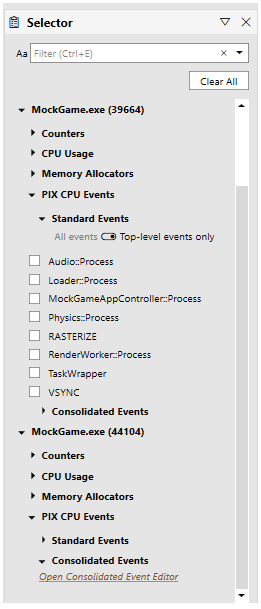
Timing Captures can now be used to analyze performance data from multiple processes. To select the set of processes to profile, access the Manage Visible Processes from the settings icon in the upper right corner of a Timing Capture.
Select Apply and Reload Symbols after selecting the processed you’d like to analyze.
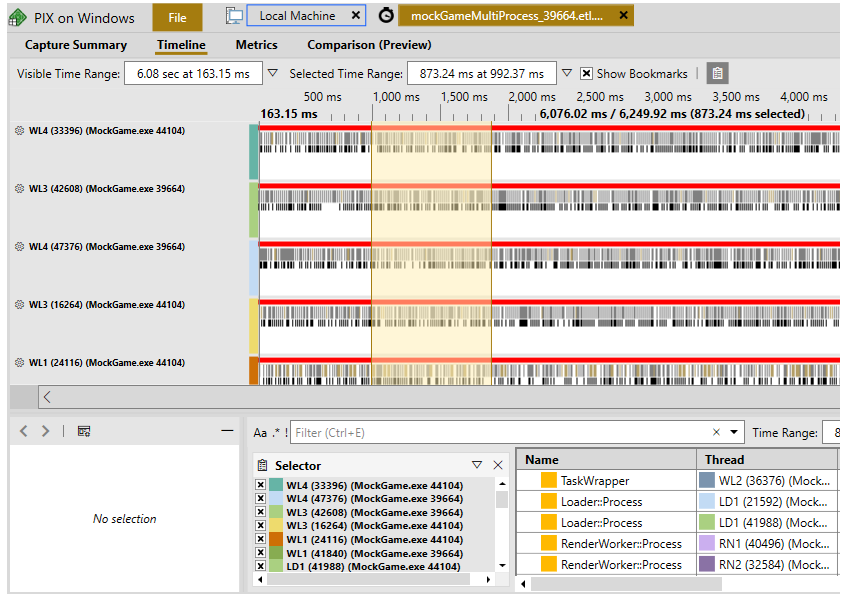
Profiling data for multiple processes appears in various places throughout the Timing Capture user interface. For example, the Metrics view contains separate metrics trees for each process.
Data for multiple processes also appears in various places in the Timeline layout, including the set of lanes and the Range Details view.
Other
System Monitor Improvements
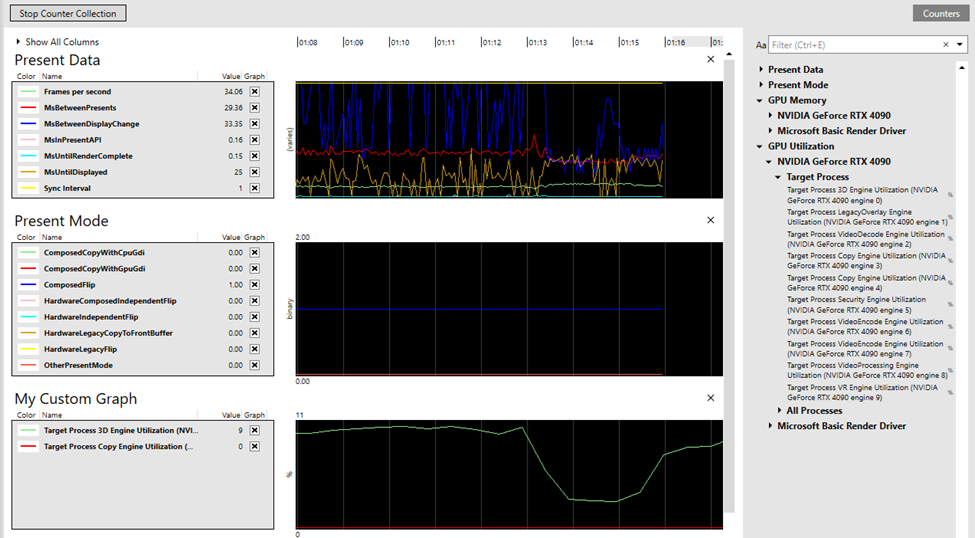
GPU utilization counters are now available in the System Monitor view! Click on the “Counters” box to view the available counters, and then drag them over into a lane to visualize the counters over time:
Misc other improvements + bug fixes
GPU Captures:
- Fix viewing placed root CBVs in the Pipeline View
- Fix crash recentering mesh in IA output view
- Support row_major and column_major in buffer formatter
- Fix capture/replay of D3D12_NODE_OVERRIDES_TYPE_COMMON_COMPUTE
- Fix potential crash during replay on older NVIDIA cards
- Fix bug copy/pasting event list entries, that resulted in “…” showing instead of event args
- Fix constant buffer format data not updating after applying edits
- Fix Stencil Test visualizer for RTV formats without alpha values
- Fix potential buffer viewer crash
- Fix Independent Devices issue that resulted in the target process loading multiple copies of D3D12Core.dll
- Fix potentially incorrect shader selection in pipeline view
- Misc minor improvements to the GPU Capture timeline
- Collect custom counters with one command instead of clicking for each counter
- Fix crash in API objects table when using filter before view has been opened
- Fix misc mesh shader output view bugs
- Cope with raw PDB blob (as opposed to DXIL container)
- Add “go to descriptor index” button to Descriptor Heap Viewer
- Fix crash with Dr PIX “Primitives and Rasterization” experiment
- Remove DrPIX’s DisableMSAA experiment, it was broken
- Export to C++: : Emit C++ function for each ModifyDescriptors event
Timing Captures:
- Store remote machine info when taking remote capture
Misc:
- Display long lines correctly in all text editors
- Fix sizing bug in misc info panels
- Misc dark mode fixes (acceleration structure viewer, view selector)
- Ingest Agility SDK 614.1
- Ingest latest VC redist, to fix capture-time crash in std::mutex caused by recent breaking MSVC change
- Validate that the user-provided working directory is valid before launching a process
- Fix floating window layout editing
- Fix crash launching PIX on some OS versions that don’t use Latin scripts
- Fix misc document leaks that cause PIX’s memory usage to remain high after closing documents
- Fix PIX installer to install AgilitySDK files in secondary platform folder


0 comments