
Today we released PIX 1803.25 which includes numerous new and updated features:
- GPU Occupancy provides detailed insight into how shader workloads execute on the GPU. As announced at GDC we have collaborated with NVIDIA to bring console-level performance details about how shaders execute on the hardware to PIX on Windows. Many thanks to our partners at NVIDIA for helping us enable this great feature in PIX on Windows.
- While the Execution Duration timeline lane shows the total execution time for draws and other rendering operations, the new Occupancy lane shows the associated work as it moves through the GPU’s rendering pipeline. You’ll see how work is broken into vertex shader work, pixel shader work, and so forth giving you a much more accurate view of how the hardware handles your rendering.
- The Occupancy lane shows VS, HS, DS, GS, PS, and CS work corresponding to the different pipeline stages as well as a stage labeled Internal which allows GPU vendors to account for work that doesn’t map to any of the conventional pipeline stages.
- To collect GPU occupancy data you have to Collect Timing Data first. Once the timing data is available, click the Enable button in the Occupancy lane to collect the data and populate the view.
- This feature is currently only available on NVIDIA GPUs and it requires an updated driver. Please make sure to get version 391.35 or later to use this feature.
- We’re working on surfacing this information for other GPUs as well, so stay tuned for updates.
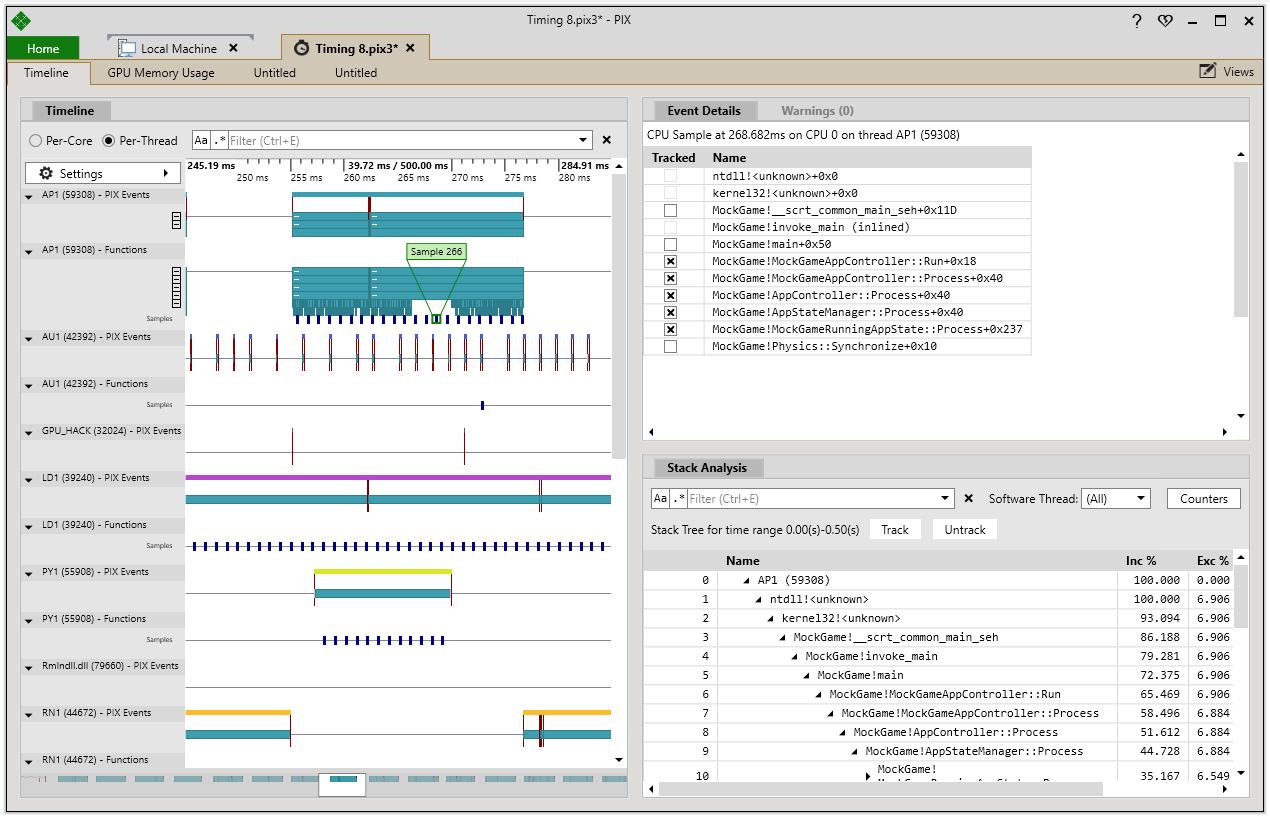
- Timing Captures now include an option to collect and analyze CPU samples.
- PIX now includes a CPU sampling profiler that can optionally be run when taking a timing capture. Viewing CPU samples is useful for determining what code is running on a thread or core for portions of your title that either have been sparsely instrumented with PIX events or not instrumented at all. The integration of samples into timing captures improves the iteration time of your profiling tasks because you can now get a sense of what code is executing at any point in time without having to go back and add additional instrumentation to your title.
- Timing captures now include the ability to visualize the execution times of individual functions in your title.
- Timing captures now allow you to track the execution of your title’s functions. You can select which functions to track by viewing callstacks for samples, by analyzing an aggregate view of the samples, or by selecting functions from your title’s PDBs. Each call to the functions you track is displayed on an additional lane per thread (or core) in the capture. As with the ability to collect CPU samples, the ability to track functions improves your iteration time by drastically reducing the need to add instrumentation to your title, rebuild, and redeploy.
- Automatic shader PDB resolution. We’ve improved how PIX resolves shader debug information (shader PDBs) and described the process for how you can set up your build system to support this. For more information see the documentation for this feature.
- Your build system can use a suggested, unique name for each shader’s PDB data, and can then strip and store the debug information in a dedicated file. If you follow this process PIX can automatically discover and resolve your shader PDBs and thus provide much better support for inspecting, editing, and debugging shaders.
- The GPU Memory Usage tab in timing captures now tracks Pipeline States, Command Allocators, and Descriptor Heaps as well.
- Improved TDR debugging support.
- We have fixed issues for titles using ExecuteIndirect.
- Improvements to Pipeline view and resource history.
- The Pipeline view is now much faster to use. PIX tracks resource access for the entire capture the first time you access the Pipeline or Resource History views. Once this is done these views update near-instantaneously when selecting a new event.
- Resource history now accurately reflects which bound resources were accessed by shaders.
- Shader access tracking now also supports DXIL shaders.
- The Shader Debugger now supports debugging of geometry shaders.
- Support for buffered IO in the File IO profiler
- The file IO profiler now displays file accesses from your title even if they’ve been satisfied by the Windows disk cache. A new IO Event Type column in the event list lets you choose between viewing buffered events, non-buffered events or both.
- DirectX Raytracing (DXR) support. This release also adds enhancements to the support for the new experimental DXR features we released to support the recent GDC announcement. Please make sure to check the dedicated release note and documentation for details. New features in this release:
- You can now view samplers for DispatchRays calls.
- Fixed global root parameters for DispatchRays calls when a graphics PSO is bound.
- Fixed several bugs. Thanks to all of you out there who reported issues!
As always, please let us know if you have feedback on any of the features in PIX on Windows.
GPU occupancy
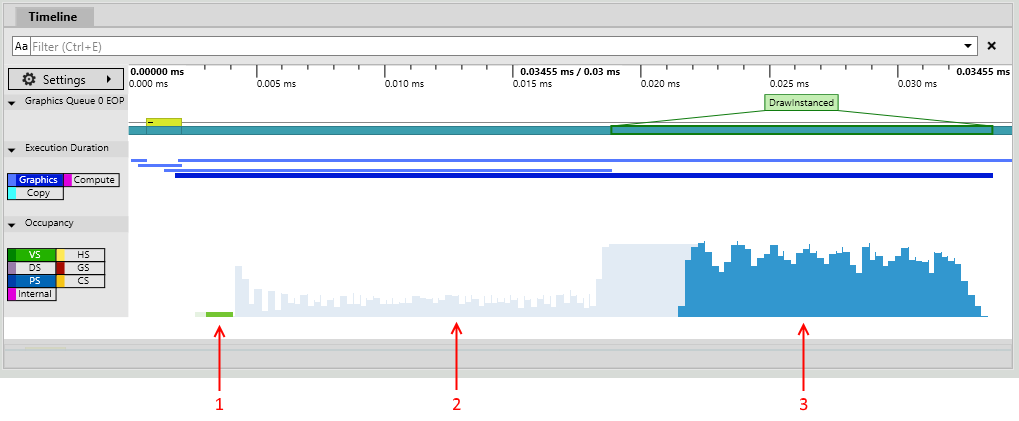
The screenshot above shows how PIX on Windows visualize GPU occupancy.
- Vertex shader work for this event.
- Pixel shader work for events other than this one.
- Pixel shader work for this event.
CPU sampling
0 comments