

CTEs, Views or Temp Tables?

Connecting the Dots of Azure SQL CICD Part 3: Testing with tSQLt

The “insert if not exists” challenge: a solution

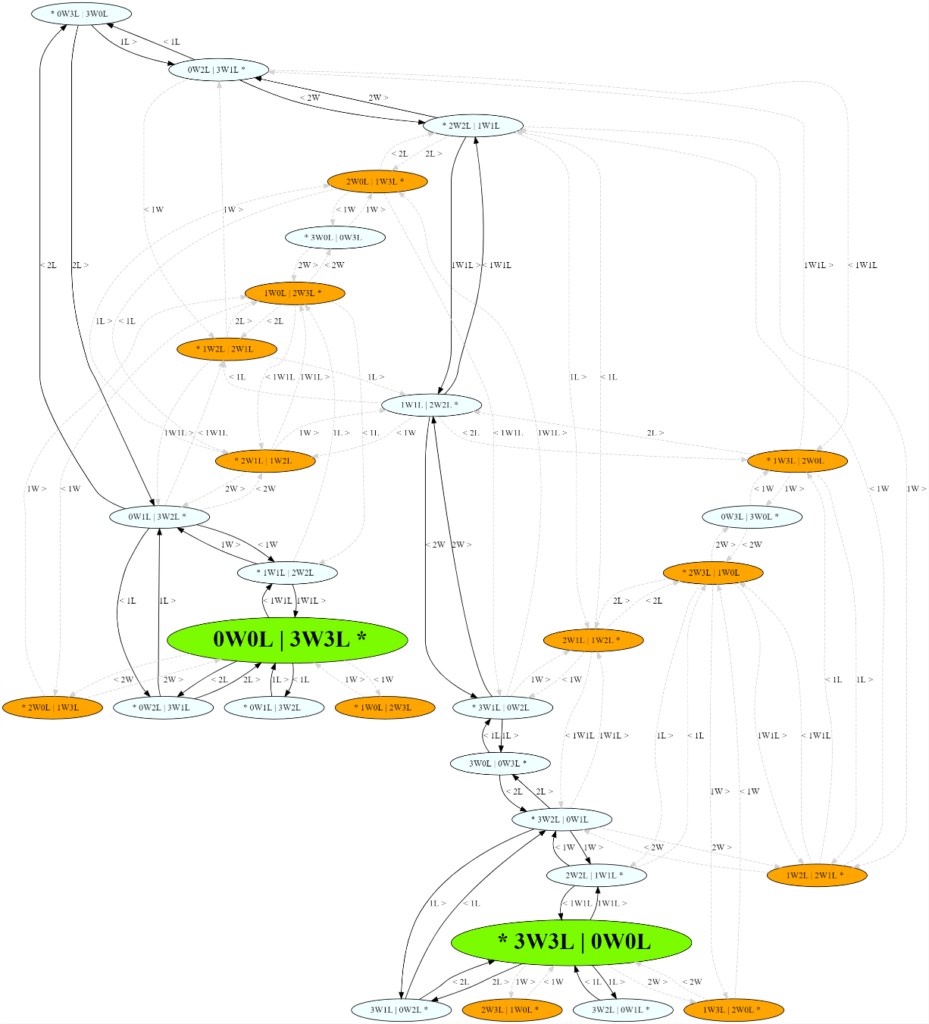
Solving the River Crossing problem with SQL Graph

Programmatically parsing Transact SQL (T-SQL) with the ScriptDom parser

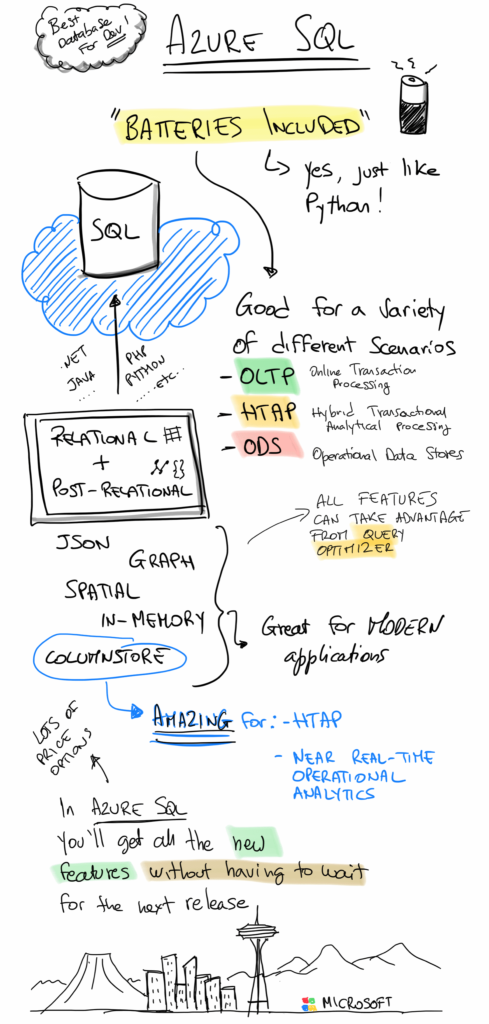
Practical Azure SQL Database for Modern Developers


 Light
Light Dark
Dark