

One of four parts
Welcome to part 1 of a four-part series on Supply Chains and Graph Databases. Each part explores different concepts that build upon the examples discussed in the other parts. You can use the following links to navigate directly to each part of the article.- Part One: Understanding Supply Chains ⬅️ You are here.
- Part Two: Enabling SQL Graph
- Part Three: Reaping Graph Rewards
- Part Four: Visualizing a Graph
Part 1: Understanding Supply Chains
Companies that want to optimize their supply chains benefit from using a graph database. Why? Because a supply chain is essentially a graph, and the data associated with it is graph data. Storing this data in a graph database makes it easier to visualize, query, and discover insights.
What is a supply chain?
A supply chain is a series of activities involved in producing or distributing a product. It could be a software product like SQL Server, a service product like Car Insurance, or a physical product like Potato Chips. Think of it as a workflow with steps, branches, starting points, and destinations. Throughout the process, data is generated. We collect this data, analyze it for trends and changes, and use it to make informed decisions.
For example
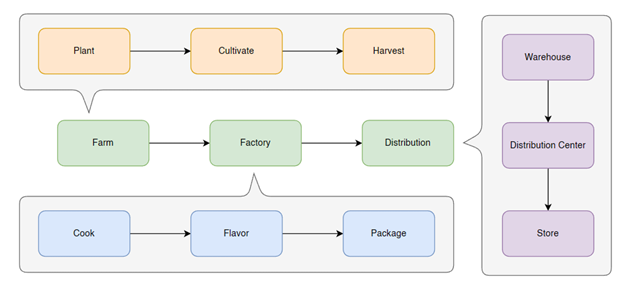
Let’s take potato chips as an example. When you open a bag of chips, you’re interacting with a supply chain that started a long time ago and covered a lot of ground. At a high level, the potato chip supply chain includes Farm > Factory > Distribution. But each step involves many stakeholders like farmers and cooks, as well as numerous smaller steps. Trucks and merchandisers handle the delivery and distribution between each step. And there are always questions: How can we make it cheaper? How can we make it faster? How can we adapt quickly to market changes?
Now, consider the supply chain for car insurance. It involves Underwriting > Administration > Claims. It includes brokers, agents, policyholders, and more. Marketing efforts and investments are also part of keeping the entire system healthy.
Finally, imagine a supply chain for custom software. It involves Design > Development > Delivery. Each stage involves interactions with clients, developers, testers, and project managers. Keep in mind that this is a simplified representation, as these stages often overlap with multiple ongoing projects.
Instrumentation
Everywhere we look, there is a supply chain. The mere existence of a supply chain is the best indicator that it can be optimized. However, in order to observe and analyze a supply chain effectively, sufficient data is necessary. Instrumenting and measuring a supply chain, which is an essential first step, can be challenging for companies.
Instrumenting a supply chain
Instrumenting a supply chain may involve tasks such as employees logging their activities or deploying new IoT devices to passively capture data. It may require implementing new processes that are more measurable or adopting systems that can log and report telemetry automatically. This process can be demanding and complex.The quality of the analysis performed on a supply chain is directly linked to the quality of the data available. The depth of the analysis depends on the quantity of the data. Furthermore, only historical data can uncover meaningful trends. Having a history of at least 18 months is recommended to account for anomalies like seasonality. However, having some data is still better than having none at all.
Modeling your first graph
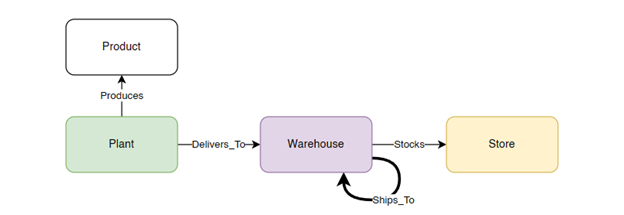
Let’s revisit the example of potato chips, which represents a straightforward supply chain. We can identify nouns and verbs that describe the node and relationships within the chain. Nouns may include Plant, Product, and Warehouse, while verbs may include Produces, Stores, and Ships_To. These relationships can be expressed in colloquial terms like “Plant produces Product” and “Warehouse stocks Store.” We may even encounter more complex relationships such as “Warehouse ships_to Warehouse,” which refers back to the same noun. While expressing these relationships verbally may be easy, modeling them requires effort.
This graph illustrates the relationships between the verbs (also known as edges) and the nouns (also known as nodes). Edges can flow in one direction, in both directions (reciprocal), or be recursive. Between two nodes, there can be no edges, a single edge, or multiple edges. You include the details to thoroughly describe your specific process.
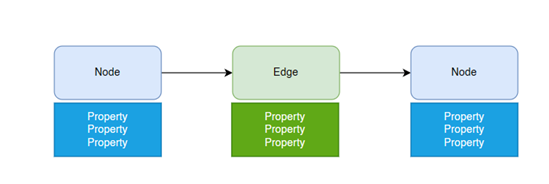
Custom properties can be attached to both edges and nodes. For instance, the “Plant” node may have properties such as address or operational weekdays, while the “Produces” edge may include properties like production rate or cost. The choice of custom properties is up to you. Adding custom properties significantly enhances the value of your graph and can be done at any time.
Graph notation
In written form, graph notation follows the format of Node-(edge)->Node. Pay attention to the direction of the arrow indicating the edge. For example, “Plant-(produces)->Product” or “Product<-(produces)-Plant”; the arrow shows the direction of the edge. Relationships can also be combined, for example: ‘Product<-(produces)-Plant-(delivers_to)->Warehouse-(Stocks)->Store.
Storing graph data
In this context, we will be using Azure SQL (with equivalent capabilities available in SQL Server) since it’s likely that your data is already stored there. It makes sense to leverage systems that you are already familiar with and that your IT teams have already approved. Your licenses already cover essential aspects of database management, including security, manageability, deployment, disaster recovery, performance, and tool integration. Additionally, your data engineering team is already equipped with the knowledge of how to work with this system, which further simplifies the process.Conclusion
As we looked into the world of supply chains and their complexity, we realized that the use of graph databases brings tremendous benefits. In Part 1, we learned that supply chains can be represented as graphs, with nodes representing various entities and edges denoting their relationships. Representing supply chains as graphs enables a clearer understanding of the workflow and facilitates optimization efforts.
Moreover, we emphasized the importance of instrumenting and measuring supply chains to gather relevant data for analysis. While this process can be challenging, having quality data is essential for meaningful insights and informed decision-making. We also explored the modeling of graphs, identifying nodes and relationships, and the inclusion of custom properties to enhance their value.
Looking ahead, Part 2 will discuss the practical aspects of working with graph databases, including creating tables, inserting data, querying with MATCH, and exploring the benefits of graph visualization. By leveraging familiar tools like Azure SQL or SQL Server, we can seamlessly integrate graph functionality into our existing infrastructure.
0 comments