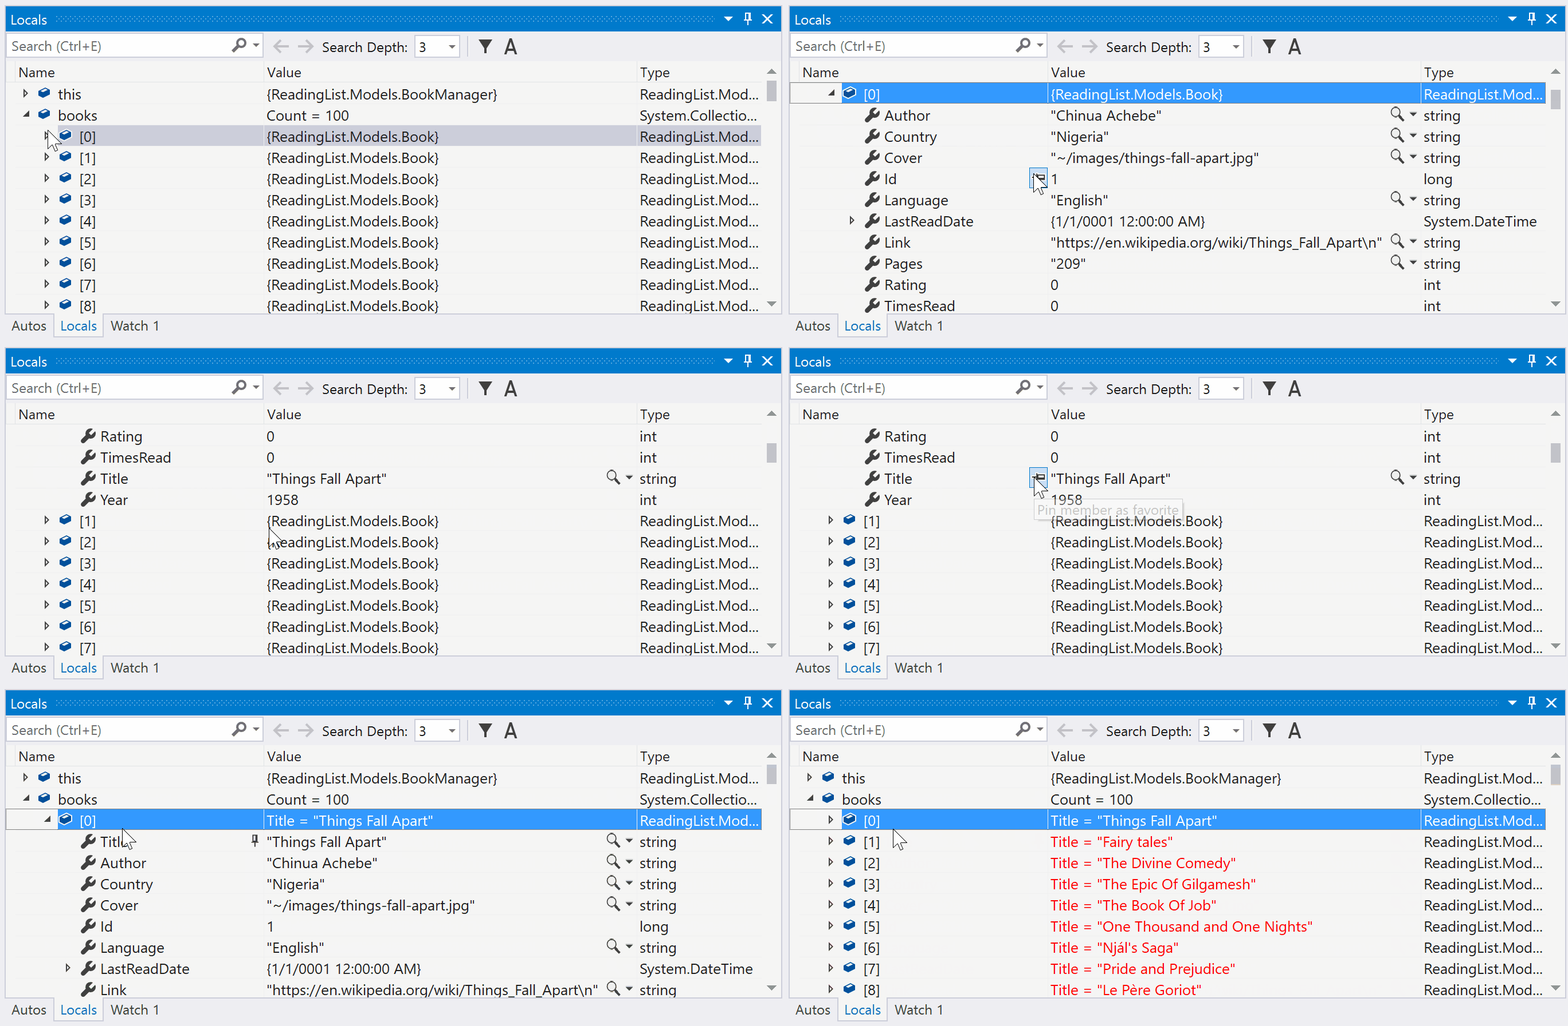
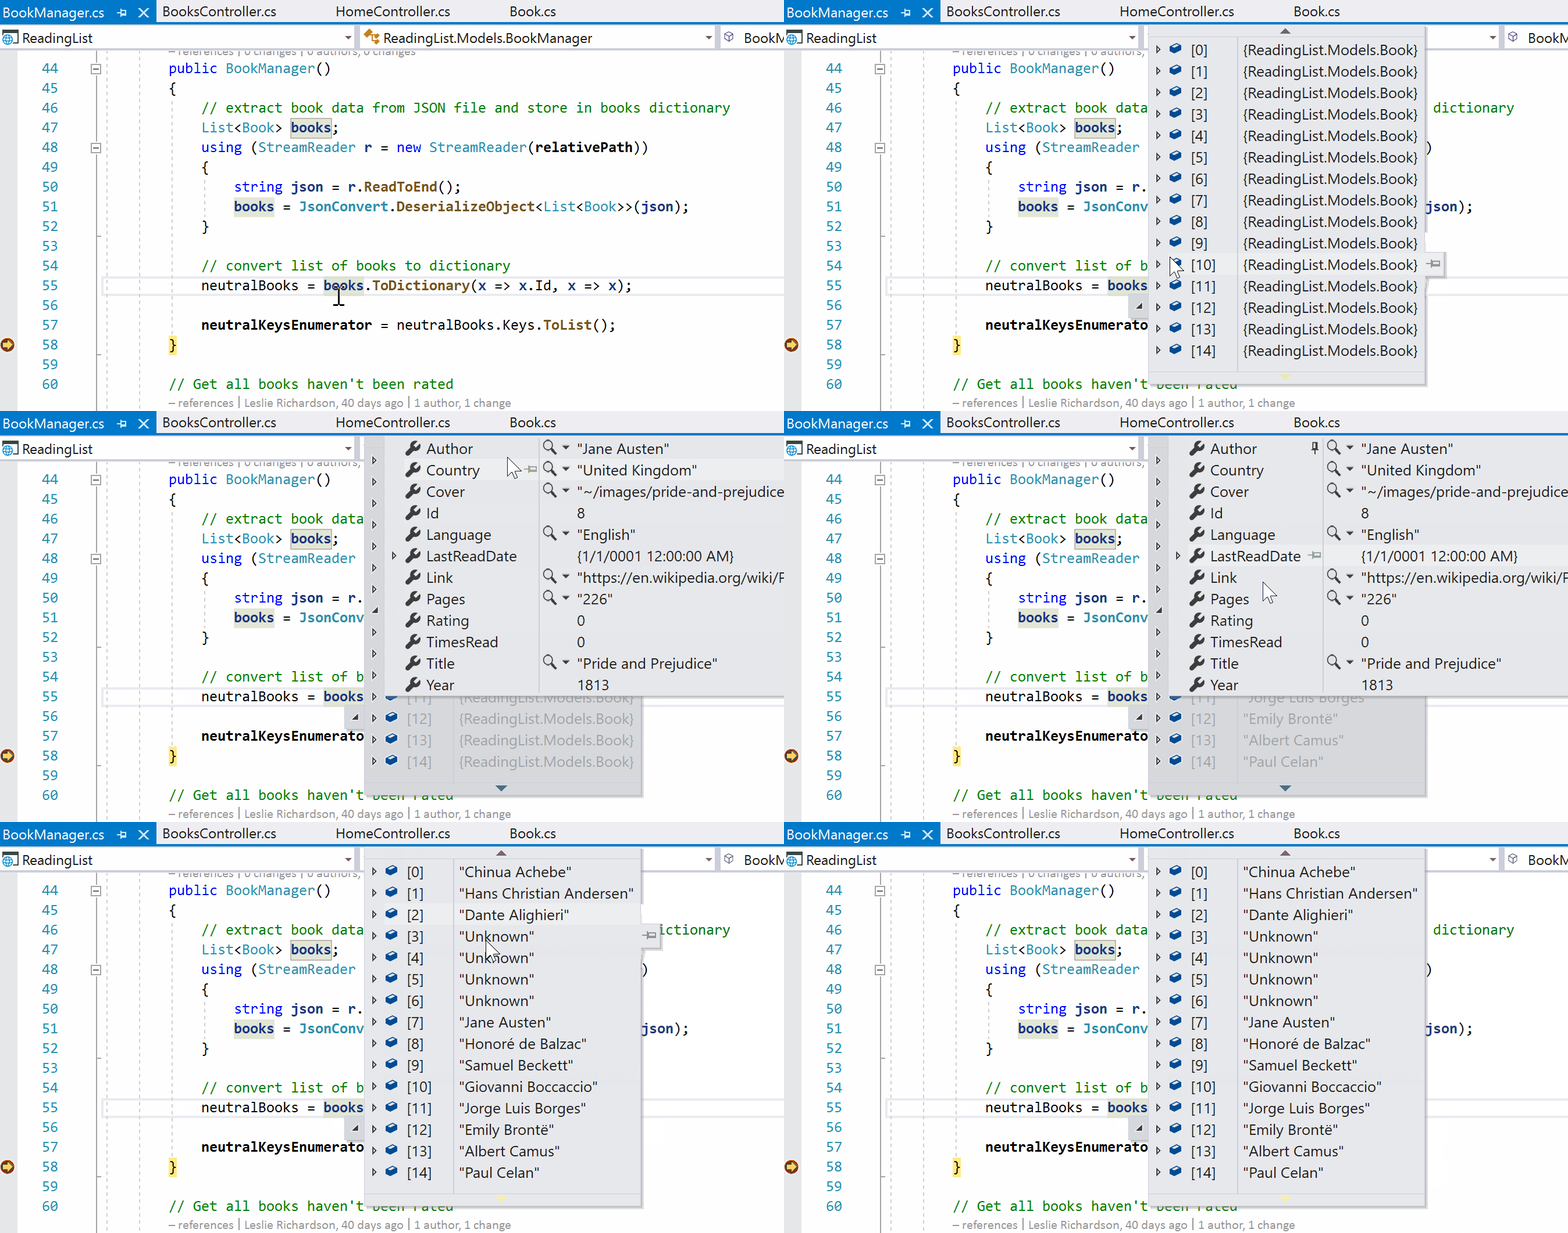
A few months ago, I wrote a blog post about the DebuggerDisplay attribute. This is a managed attribute that lets you customize how you view objects in debugging windows by “favoriting” specific properties. Since that post, we’ve streamlined DebuggerDisplay’s behavior with Pinnable Properties, a new managed feature available for Visual Studio 16.4!
Native developers: Fear not, Pinnable Properties will also be available for C++ in a later update!

How does the Pinnable Properties tool work?
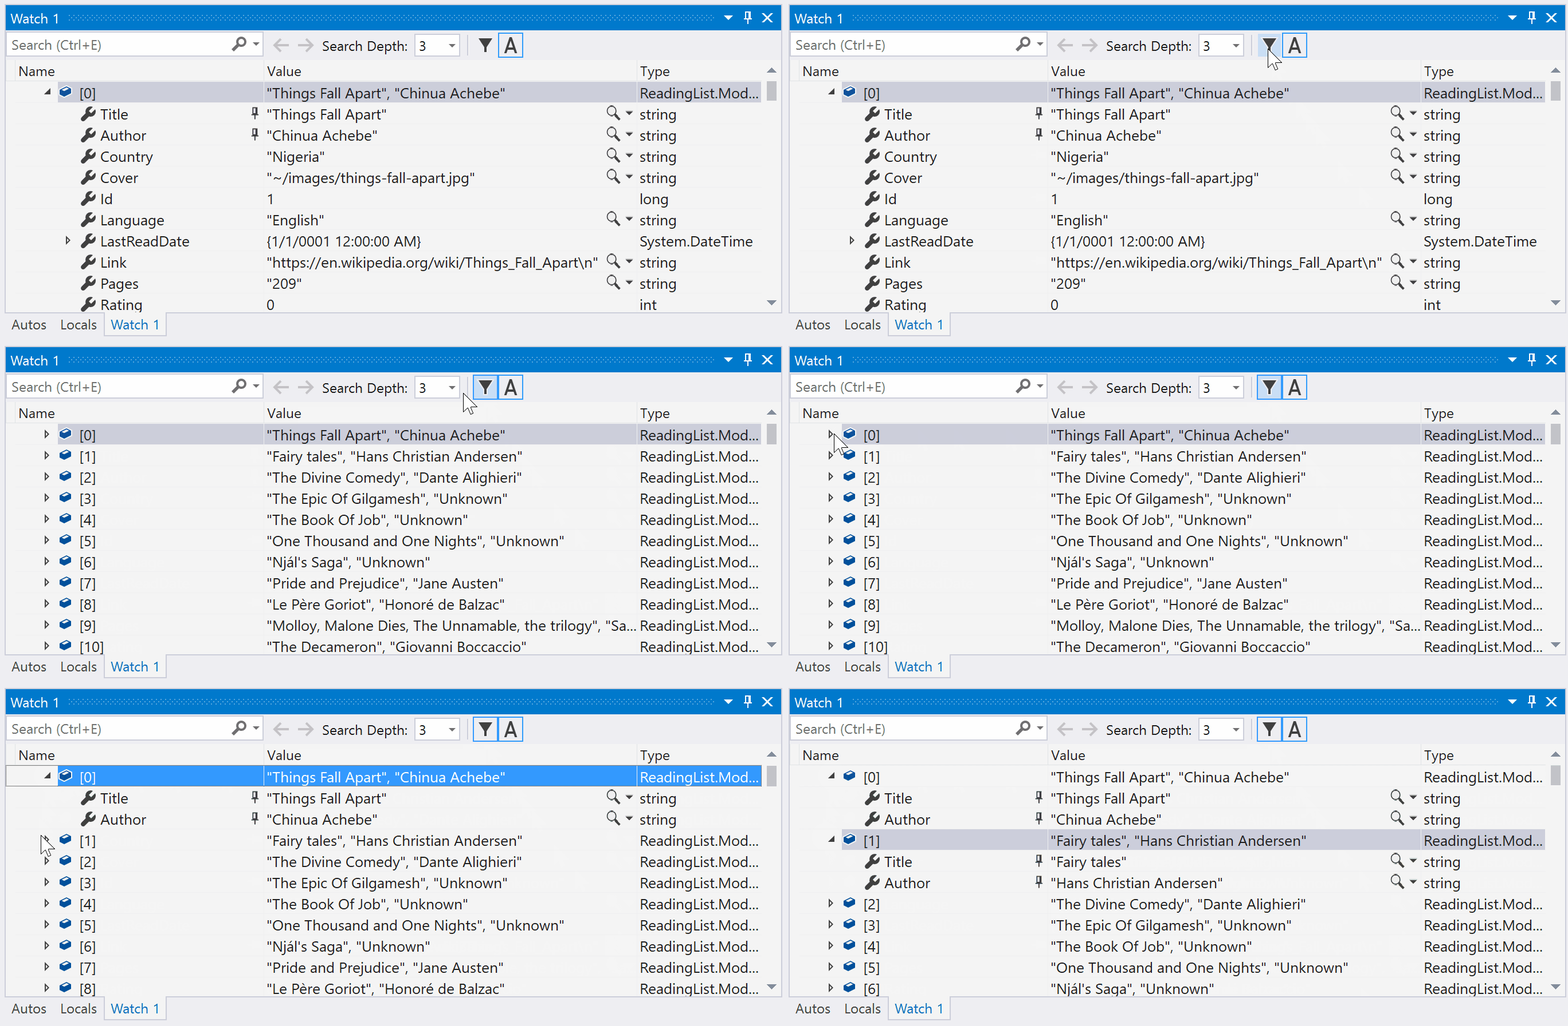
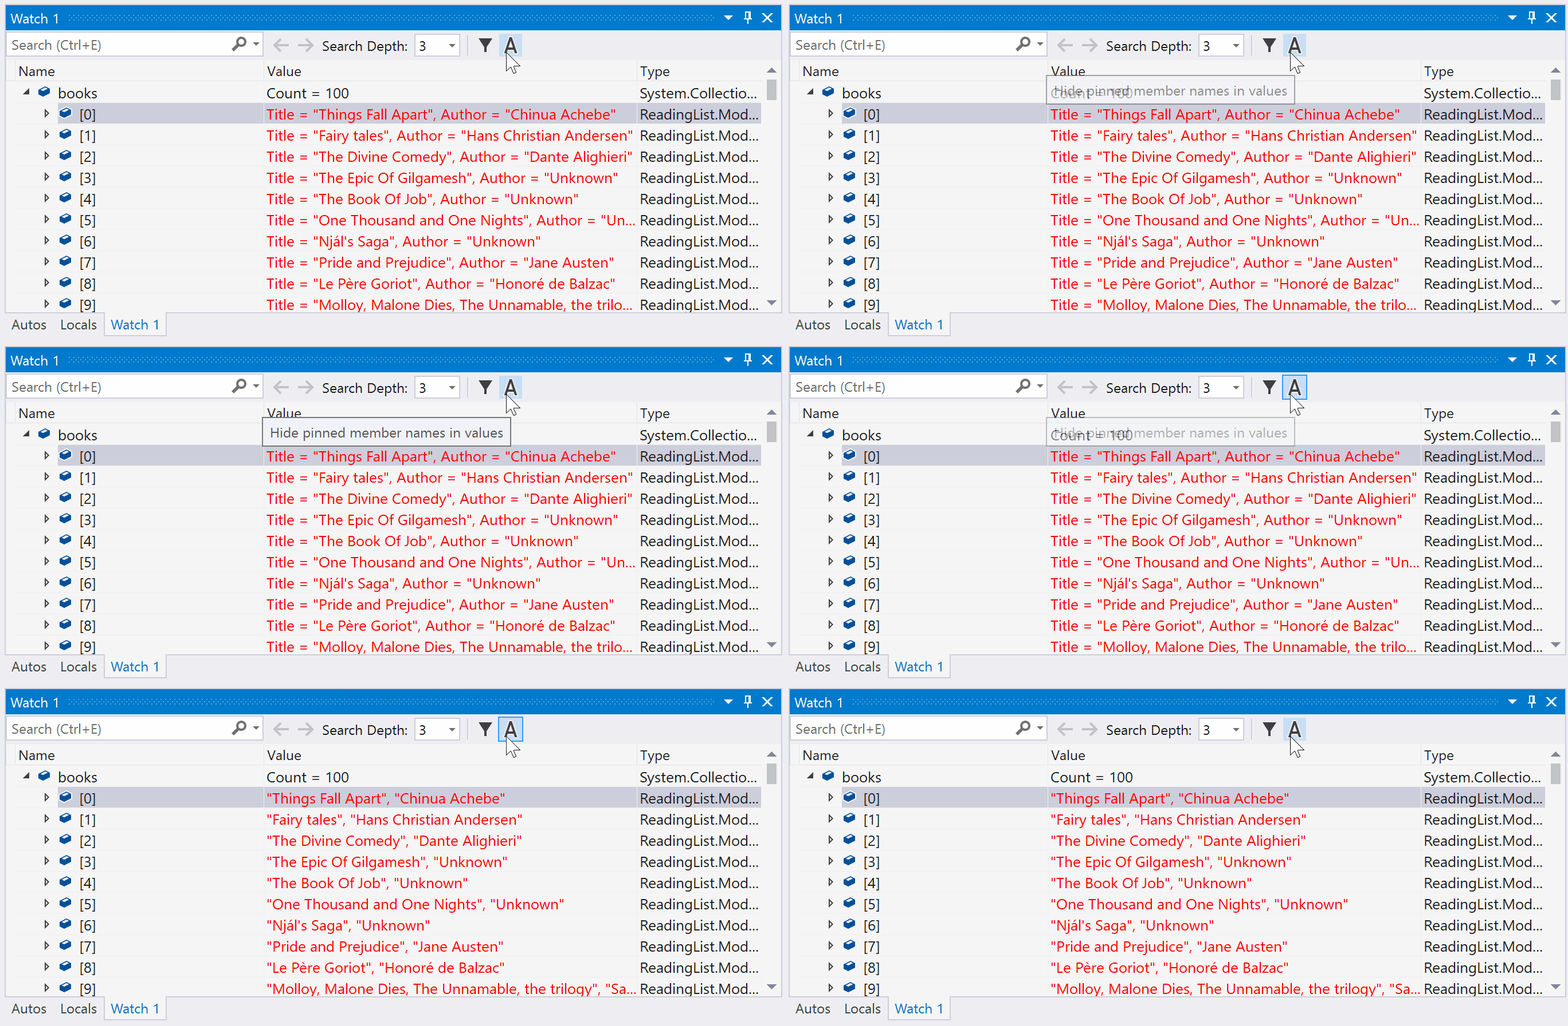
The Pinnable Properties tool is located in DataTips and the Autos, Locals, and Watch windows at debug time. To use the tool, hover over a property and select the toggle-able pin icon that appears or select the “Pin Member as Favorite” option in the context menu. You will immediately see your selected members bubble to the top of your property list and appear in the Values column of any of the debugger inspection windows, replacing the default object type that is typically displayed. Now you can quickly identify and scan through your countless objects, greatly increasing your productivity.

The properties you pin will persist across all your future debugging sessions until you decide to unpin them. Also, you can filter unpinned properties and hide property names via the Watch window toolbar or a DataTip context menu.


Why does the Pinnable Properties tool exist?
Your feedback determined that there was high demand for quickly identifying objects in debugger windows via specific properties. Though DebuggerDisplay and Natvis can accomplish this task, they have several drawbacks that we observed and learned from you and other developers, including:
- having to modify your code to use the attribute
- the inability to use the attribute dynamically at debug time
- the lack of discoverability (I have been asked many times if DebuggerDisplay is a Visual Studio 2019 exclusive feature when it’s been out for many, many years now…)
We created the Pinnable Properties tool to reduce these issues and provide with you with an easier, more intuitive, and real-time method to customize your object inspection experience without having to modify your code or override your ToString() method.
Try out Pinnable Properties and give us even more feedback!
Pinnable Properties would not have been possible without your enthusiasm and feedback for improving the existing DebuggerDisplay and Natvis behavior. We encourage you to try it out and share your thoughts on how we can make this tool even better in the comments or via this survey!

Why is there no link to the “setup” blog (https://devblogs.microsoft.com/setup) on the top nav menu?
This is a marked improvement over the DebuggerDisplay method that requires re-compiling. Thank you!
You described pinnable properties in simple words thanks for sharing such good work
Regards:
nice blog very useful information.
I absolutely love the new pinnable properties feature! I can’t count the number of times in the past that I’ve had to stop a debugging session just to add the DebuggerDisplay attribute on a class. Congrats on the well thought out design and making it so easy to use 🙂
Awesome! Also seeing Chinua Achebe in the list made me happy.