Debug live apps in Azure with the Snappoints and Logpoints preview
At Build, we introduced the Snapshot Debugger: a new tool that enables you to debug production environments in Azure with minimal impact. The Snapshot Debugger enables you to get to the root cause of the “but it worked locally!” production issues with ease. We previously released functionality to automatically capture snapshots when your app runs into problems, now you have more fine-grained control to debug your production app with two new features in Visual Studio: Snappoints and Logpoints.
The Snapshot Debugger is currently in preview for ASP.NET apps running on Azure App Services – try it out. Note: the Snapshot Debugger is currently preview software – please use it in a testing or staging deployment of your app.
Debugging production is hard
Quickly diagnosing and fixing production issues is one of the hardest tasks you may face while developing cloud scale apps. There’s several challenges that can make diagnosing the root cause of production issues costly:
- Issues may not repro locally (due to intricacies in production data, scale, or config)
- Logs may not contain enough details of the issue
- It’s not clear what steps a customer took to run into the issue
Due to these challenges, fixing a production issue can feel a little like this:

The Snapshot Debugger extends the Visual Studio debugger you know and love to debug apps running at scale in Azure. You can use the Snapshot Debugger to debug production issues directly in production as they happen. The Snapshot Debugger follows a few key principles:
- Close to zero impact to production
- Retain the functionality and ease of local debugging
- Support debugging highly distributed apps running on multiple servers
- Secure access to production data: only resource admins can debug
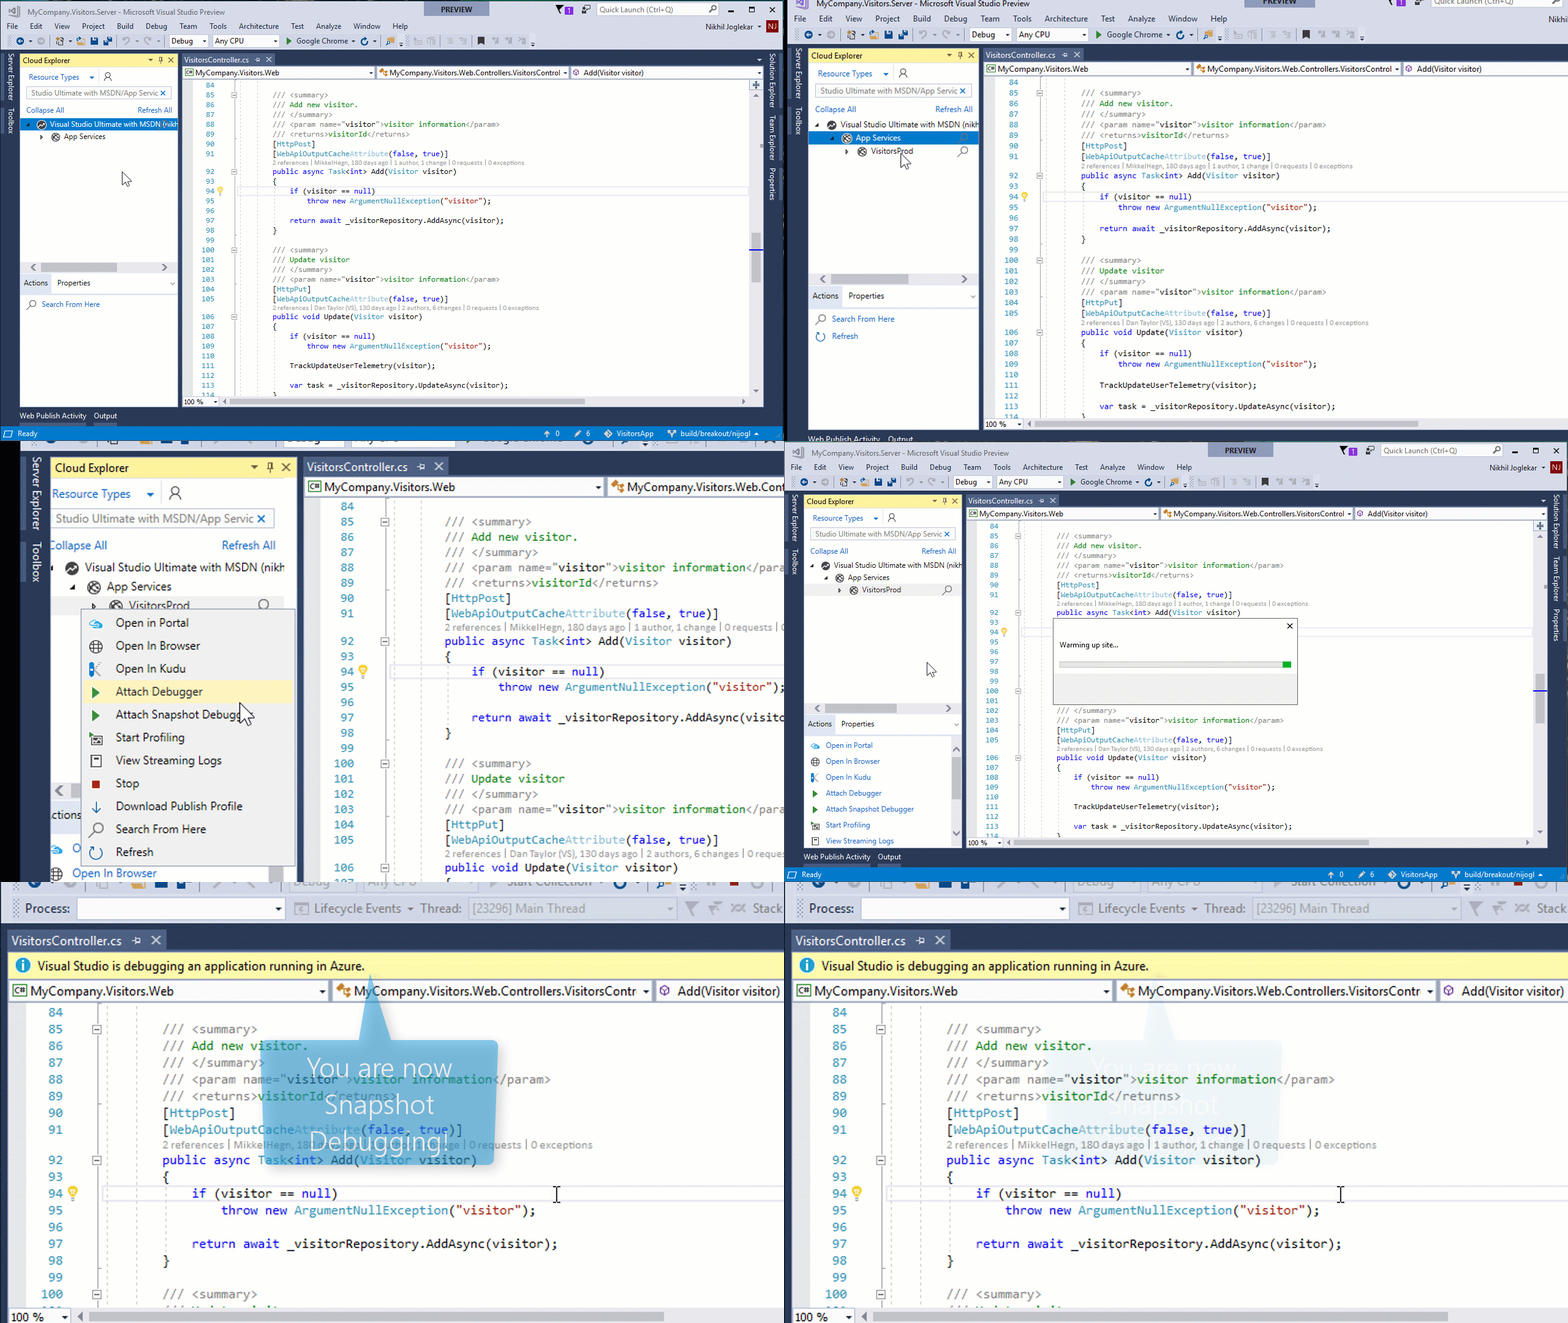
Currently, the Snapshot Debugger preview works for ASP.NET and ASP.NET Core apps running on Azure App Service (additional platform support will be announced in the next few months). You can then right click your Azure App Service in the Cloud Explorer inside Visual Studio and Attach Snapshot Debugger.

Debug production state without halting
Snappoints bring breakpoint-style local debugging to a cloud scale. Unlike breakpoints, they do not halt your app: instead, they take a snapshot of relevant info (i.e. call stack, objects on the heap), and continue execution. You can also add conditions to Snappoints to only capture information on interesting or problematic requests to your app.
You can place a Snappoint in your code exactly like you would a breakpoint: by clicking the breakpoint gutter on the line you are interested in debugging or by pressing F9. You can then click the Start Collection or Update Collection button to turn on Snappoints placed in your app. When your app executes the line containing the Snappoint, a snapshot will be taken. You can open this Snapshot from the Diagnostic Tools Window to view the Call Stack, Locals, and Watches, as well as evaluate expressions, at the point of time when the snapshot was taken. The app is still running: end users will have no idea you are currently debugging.
Snappoints take a full process snapshot of your app when the line you specify executes. This snapshot takes 10-20 milliseconds to capture and consumes a few hundred kilobytes of memory on your server. Almost zero impact can be measured in your app while taking snapshots. Additionally, Snappoints work well against release-optimized code – you can use them directly on your production deployment.
While you cannot step from a snapshot in Visual Studio, you can place multiple Snappoints in your app to see how state changes between lines. The Snapshot Debugger will ensure multiple snapshots are captured from the same end user interacting with your app.
Add logging to live apps, on the fly
Have you ever spent hours sifting through your logs, only to realize your app isn’t logging the data you need? Logpoints enable you to add temporary logging to your app, without modifying code or redeploying.
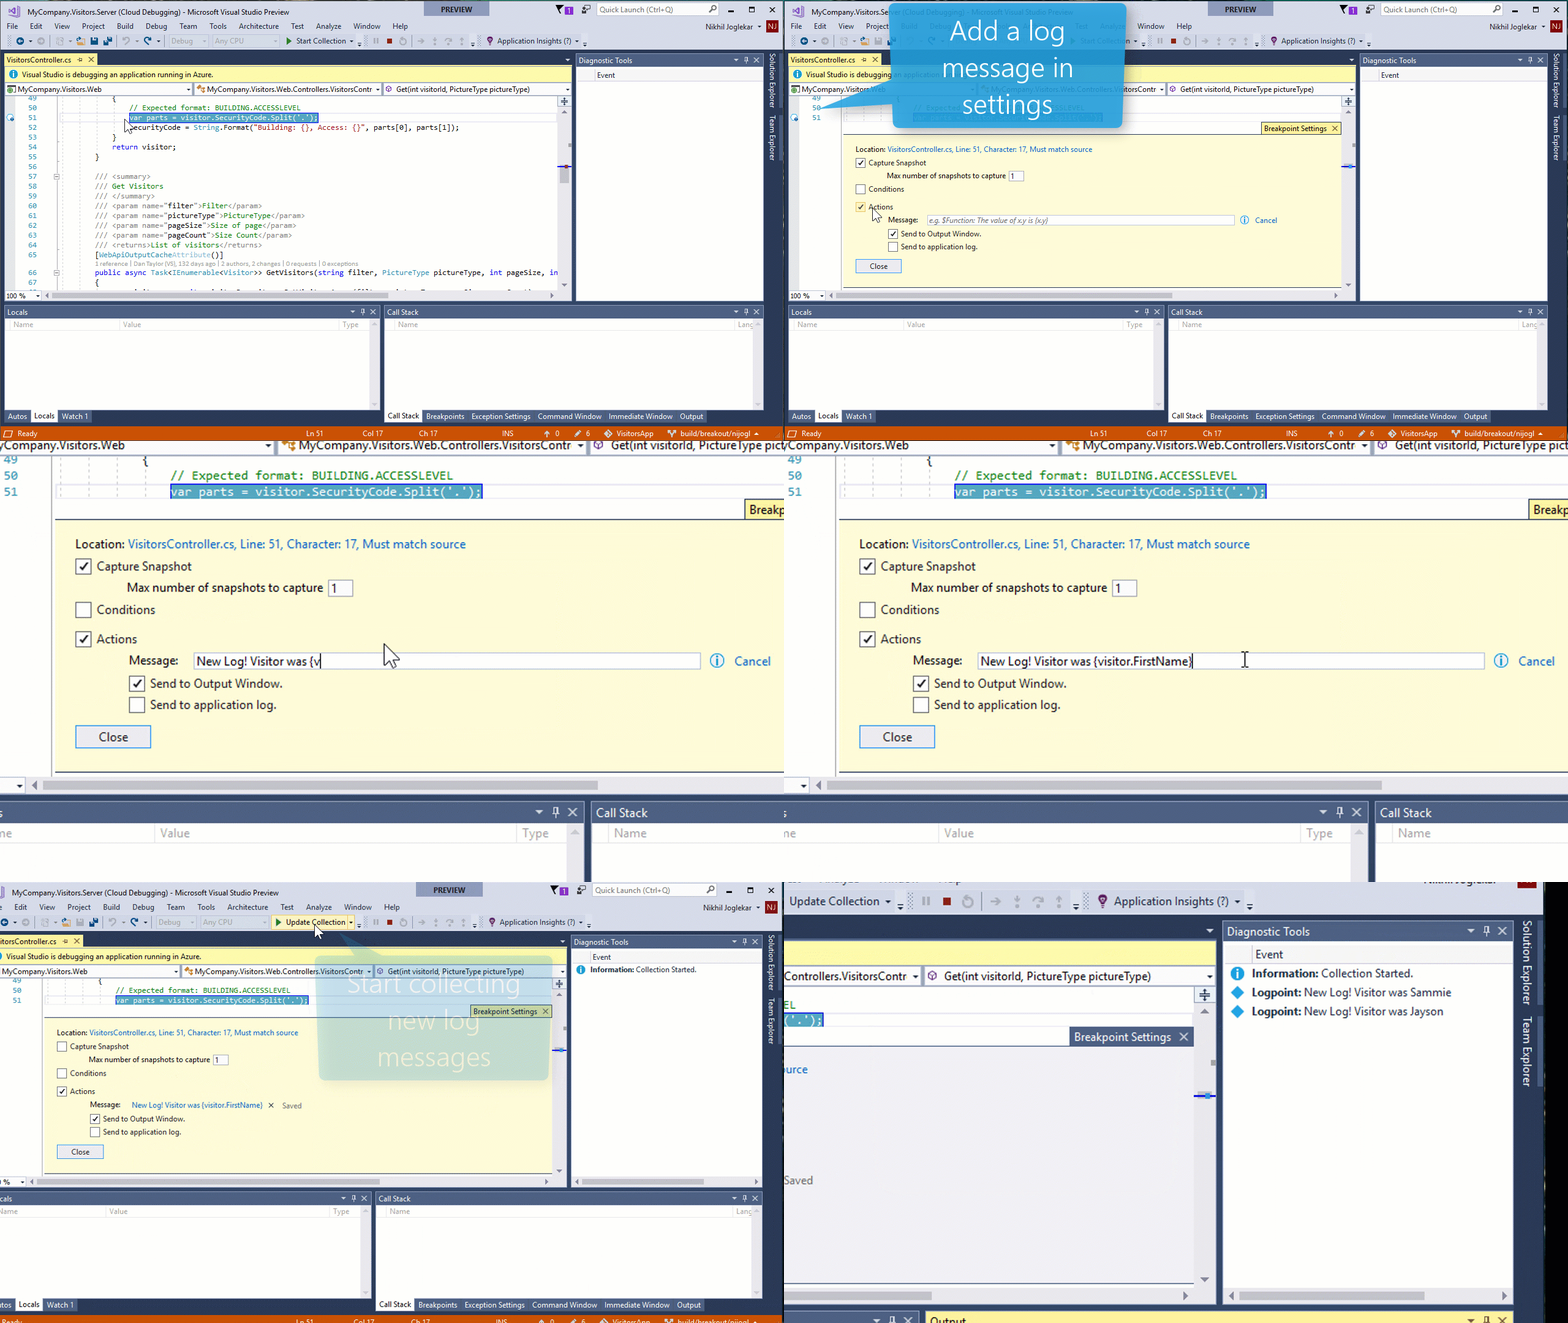
You can place a Logpoint in your code by hovering over the Settings gear on a Snappoint. In the Settings page, check Actions and type in the Message you would like to log. You can evaluate expressions and variables in your message inside curly braces: {MyInstance.Field}.
Log messages can be sent to two places. Check Send to Output Window to live stream new log messages back to Visual Studio. Check Send to application log to send messages to your app’s logging framework. Messages sent to application log will be traced via System.Diagnostics.Trace in .NET Framework and via ILogger in .NET Core: you can add listeners to your app to route these traces wherever you want.
Expressions or variables placed inside messages are virtually interpreted. Due to this, they cannot cause any side-effects to your app. However, some native properties cannot be evaluated.
Try out the preview
The Snapshot Debugger is currently in preview: download and try it out. Currently, you require Visual Studio 15.4 Enterprise, as well as an ASP.NET (4.6.1+) or ASP.NET Core (2.0+) app running in Azure App Services.
We’d love to hear your feedback: please take this short survey or contact our team directly to report issues, provide suggestions, or tell us your success stories.
 |
Nikhil Joglekar, Program Manager, Visual Studio
@nikjogo
Nikhil is a program manager working on Azure diagnostics tooling. Since joining Microsoft two years ago, Nikhil has worked on the Snapshot Debugger, Visual Studio Profiler, and Azure SDK. |


 Light
Light Dark
Dark
0 comments