Would you like to learn how to make your code run faster, use less memory, or just find out whether your code has a CPU or memory issue? Of course you would—you’re a developer! But then, memory and performance tuning often suffers from the pitfall of being an “important but not urgent” task that you simply can’t seem to get to because of the really urgent stuff. So why not bring that task little closer to you?
In this post we’ll look at how using the debugger-integrated performance and memory tools in Visual Studio 2015 Update 1. Without leaving your debugging workflow, these tools let you quickly answer questions like “how is my memory footprint?” “what is using all this memory?”, “should I be concerned about the performance of this code?”, and “why is this so slow?”. Although we show ASP.NET in this post, these tools also work when debugging Windows desktop applications and C#/VB/C++ universal Windows applications that target desktop.
If you like what you see in this blog post, please join our Visual Studio Performance Tools Community to stay up-to-date and help steer future features.
Finding Performance and Memory Problems
The first step in optimizing the performance of your code is to know where to make improvements. To help with this, PerfTips and the Diagnostics Tools window in the Visual Studio 2015 debugger give you inline, glance-able performance information.
To use PerfTips, just set a breakpoint and step over a line of code, and you’ll see the PerfTip appear to the right of the instruction pointer (the yellow arrow) with the elapsed (wall-clock) time. In this case it tells us that line 57 took 1406ms to run, which is usually a combination of time spent waiting on I/O (e.g. an HTTP call or reading a file from disk) and time spent executing code on the CPU:
If this number is higher than you’d like, run the same code a few more times to see if you get consistent results. In many cases, you can Click+Drag the instruction pointer (yellow arrow) back to re-run code without having to stop your debug session.
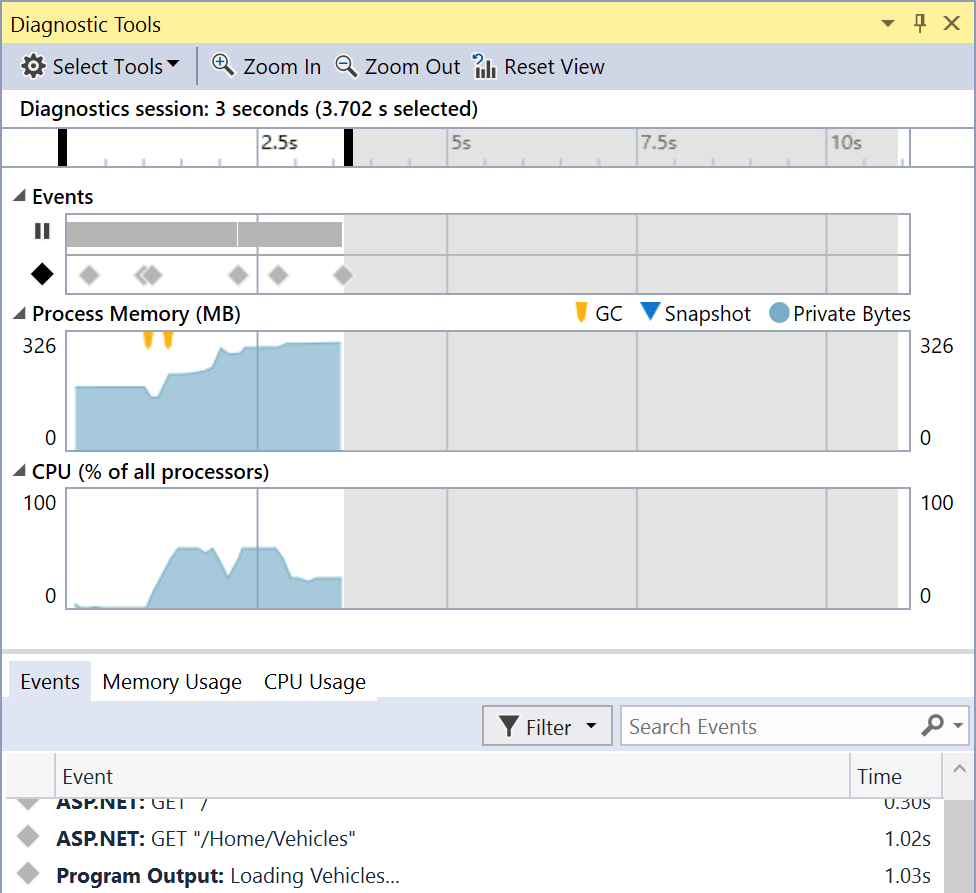
To look at your app’s CPU and memory consumption, open the Diagnostic Tools window (Debug > Show Diagnostic Tools or Ctrl+Alt+F2):
The Diagnostic Tools window opens by default when you start debugging, and you can leave it open to keep an eye on your app’s CPU and memory consumption whenever you are debugging.
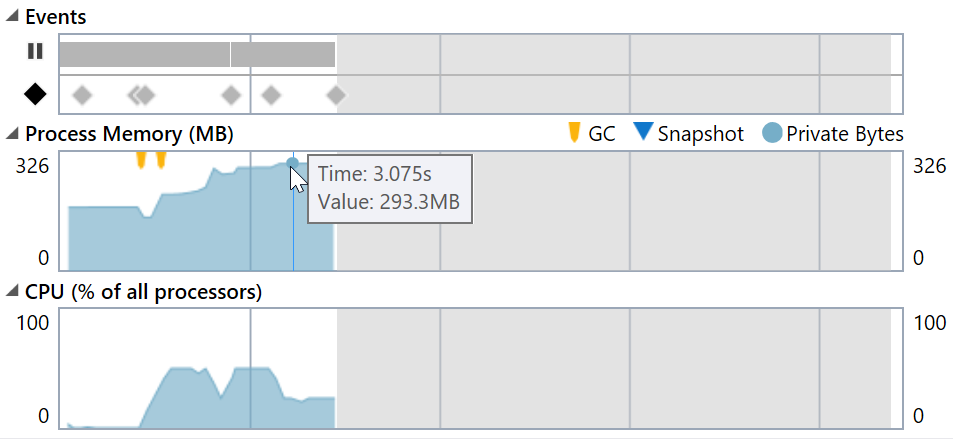
Hover over the CPU and memory graphs and you’ll see a tooltip that shows the application’s private memory and percentage of CPU consumption at any point in time:
Above the memory graph you’ll see a timeline of the breakpoints and steps you took so that you can relate CPU and memory consumption to specific sections of code:
Again, if you see something that is higher than you expect, run the code multiple times to see if you get similar values. Or click on one of the break events (the rectangles) to set the selected time range to that event, which is useful for viewing the detailed CPU usage information shown in the next section.
If you decide to make an improvement, a few more clicks gets you a breakdown of CPU and memory usage to help identify opportunities for improvement. We’ll show you how to do this next!
Reducing CPU Usage
When you identify a spike in CPU usage, your first instinct might be to try out a few code alternatives and see which ones use the least amount of CPU. But if you have no idea what the problem might be, or want to verify what code path is causing an issue, click on the CPU Usage tab in the Diagnostic Tools window, and then click CPU Profiling to start recording the functions that are running on the CPU:
Doing this samples the call-stack on the CPU once per millisecond, which adds a small amount over performance overhead to debugging. It’s generally small enough, however, that you can leave it running during your debugging sessions.
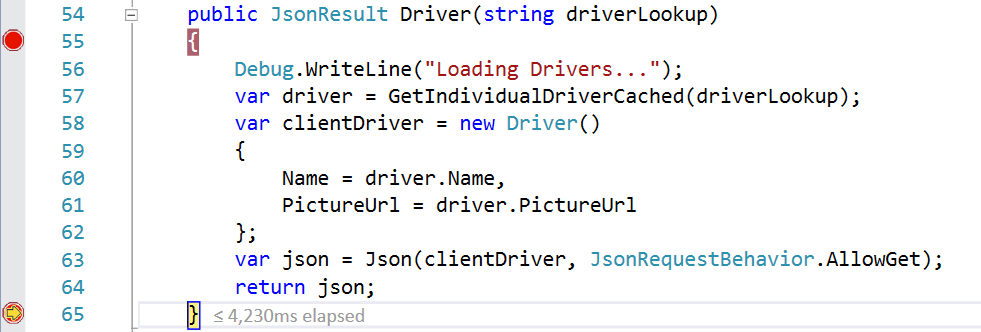
The simplest way to view CPU data is to set breakpoints at the start and end of the section of code of interest, as lines 55 and 65 below. When the debugger hits line 55, press F5 to run that block of code (and notice the PerfTip that appears on line 65!):
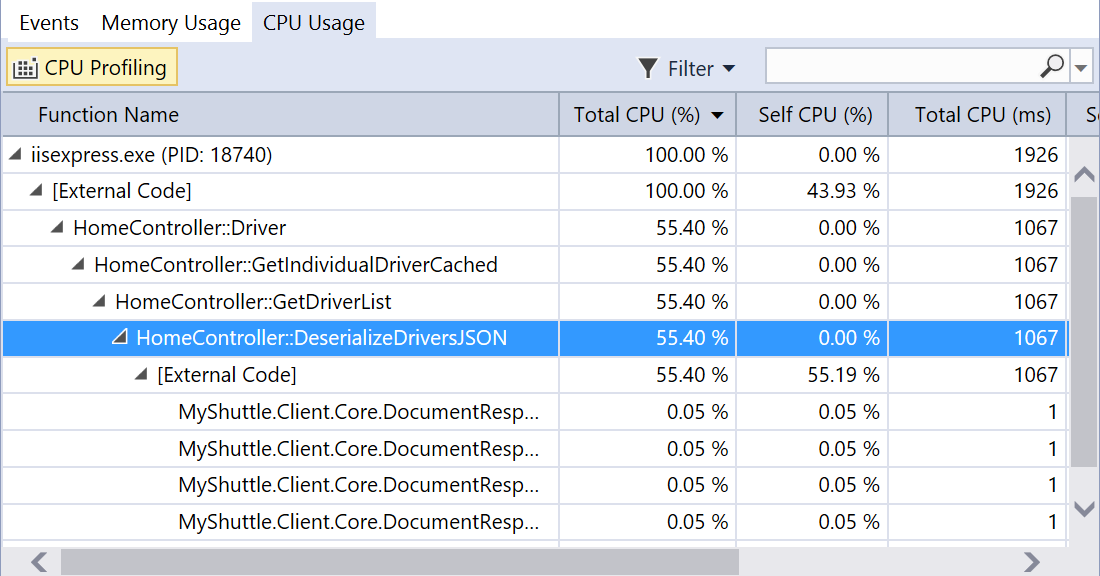
The Diagnostic Tools window automatically sets the current time selection to the time between these two breakpoints (as if you had clicked on a break event). You can also set the time range selection by clicking and dragging on a CPU spike in the graph. In both cases, the table in the CPU usage tab shows a call-tree filtered to the selected range of time:
The call-tree provides an aggregated view of all of the recorded call stacks. You can expand the nodes in the tree to follow a series of function calls (or portion of a call stack) and see the CPU usage within that code-path under. Total CPU (ms) shows the approximate time spent in a given function and all its parent calls; and Total CPU (%) provides a percentage breakdown of the Total CPU (ms) column.
Here we see that we spent 1067ms in DeserializeDriversJSON when it was called by GetDriverList, which was in turn called by GetIndividualDriverCached, and so on. Right-click on any function and select View Source to examine the code and look for ways to reduce calls to that function, or reduce the number of calls it makes to other functions.
Reducing Memory Consumption
To view a breakdown of memory usage, open the Memory Usage tab in the Diagnostic Tools window and click Take Snapshot. By taking a snapshots both before and after an increase in memory lets you to filter the view to see what changed between the two in terms of Objects and Heap Size:
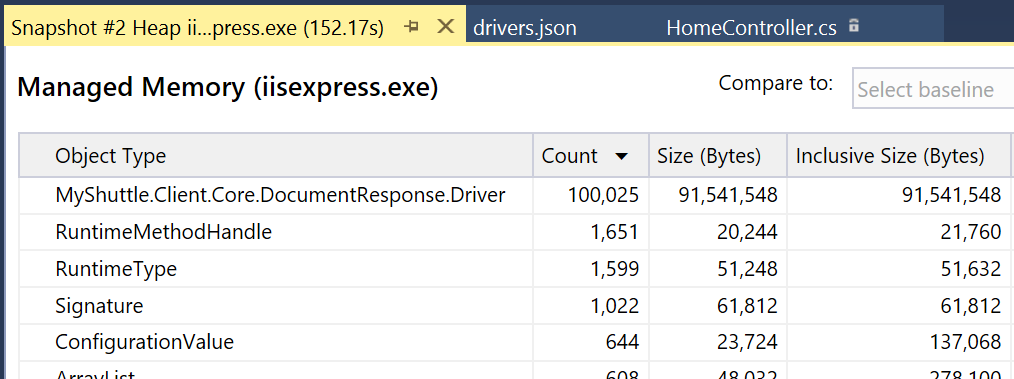
When you take two or more snapshots, the numbers in parenthases show the differences from the previous snapshot in the table. All the blue text are hyperlinks that open the heap view to see the full set of objects captured in that snapshot, including a Count of objects, their Size, and the Inclusive Size of all instances of that type plus the size of all referenced types:
In this case, we have 100,025 DocumentResponse.Driver objects in our heap totaling about 91MB in size.
Clicking a link in the parentheses lets you analyze the differences more specifically:
Sorting by Inclusive Size Diff points you to the objects responsible the memory growth between the two snapshots. In this example, the diff view shows 5 new driver objects with ~54MB of memory growth between the two snapshots. The inclusive size of DriverCache, Dictionary, and List objects indicates that they are all possible culprits.
When viewing managed snapshots, you can select an object to view the references to and from objects of that type. The Paths to Root tab shows the references that other objects hold to the selected type:
Here we see that the DriverCache object has a dictionary, which created 5 new references to driver objects between the two snapshots. To jump into DriverCache to see what it’s doing, just right-click and select Go to Definition.
The Referenced Types tab shows objects that the selected type is referencing:
Here we see that the Driver objects added references to 50MB worth of byte arrays, and 2MB worth of strings between the two snapshots.
Similar steps to what we’ve seen here also works for C++ with some small differences. When debugging C++, first toggle the “Heap Profiling” button before you can take snapshots, and instead of using the references list you can view instances of a particular type and then see the allocation stack for each instance.
Learning More
These are simple ways you can measure performance and memory of your app in a few minutes the next time you’re using the Visual Studio debugger. Now that you’ve learned the basics, you can learn more by checking out the following posts:
- Performance and Diagnostic Tools in Visual Studio 2015
- Profile your CPU in the Debugger in Visual Studio 2015
- Diagnosing Event Handler Leaks with the Memory Usage Tool in Visual Studio 2015
- Memory Profiling in Visual C++ 2015
We also encourage you to join our Visual Studio Performance Tools Community for updates about new features, and to give us feedback about these and other performance tools!
 |
Dan Taylor, Program Manager, Visual Studio Over the past few years Dan has been driving development of the Performance and Diagnostic tools in Visual Studio, including the Diagnostic Tools window, PerfTips, and performance tools for Windows Store and Windows Universal apps. Prior to that he was driving various performance improvements in the .NET Framework and CLR across Windows 8, Windows Phone 8 and Windows Server. |







Hi, I have a problem when debugging my app, like that the program’s broken because when debugging it the memory increase a lot, since 0 to 2 gb or more and it not start. I don’t know why but it is very stressful. Pleas if Can you help me. I will be very grateful.Regards