Today we released PIX 1703.20.002 beta. New in this release:
- NVIDIA GPU counters
- File IO traces
- Shader edit & continue
- Pixel Cost visualizer
- Improved Warnings UI. Where possible, warning hyperlinks now point to the GPU rather than CPU event list.
- Added an option to disable Capture GPU timings when taking timing captures. Turning this off can reduce measurement overhead if you only care about CPU timing information.
NVIDIA GPU Counters
As recently announced at GDC, we have partnered with NVIDIA to enable a rich set of hardware performance counters inside PIX. When running on an NVIDIA GPU with the latest driver (378.92) you will see ~300 newly available counters. These can provide much deeper insight into the rendering and performance characteristics of your workload than was previously possible. These counters are implemented by NVIDIA’s C++ API called PerfWorks. To learn more about PerfWorks, click here.
Many thanks to our partners at NVIDIA for making this possible!
Note that not all counter values are will be rolled up from individual draw calls to their parent marker regions. We will be improving this in future releases.
If you encounter any compatibility issues with this new feature, it can be disabled via the Enable GPU Plugins option in PIX Settings (and of course, please let us know if you do encounter problems).
Similar functionality from other vendors is coming soon.
File IO Traces
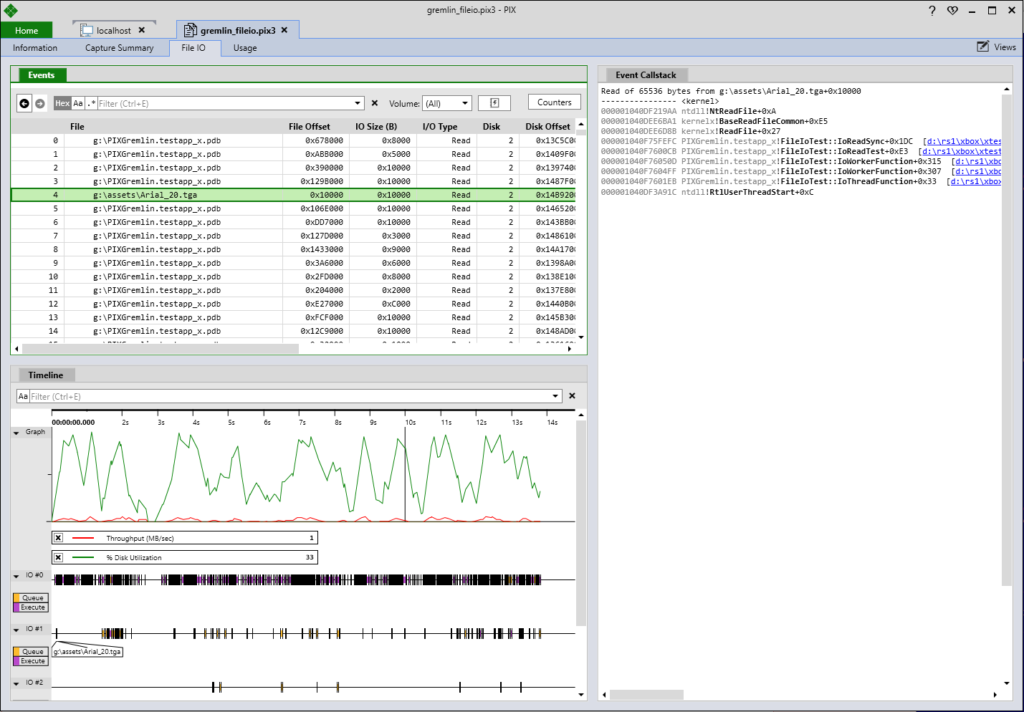
PIX’s file IO profiler helps you identify inefficiencies in your title’s disk IO patterns and package layout. File IO captures provide data on all file accesses made by your title as the capture ran. This data is laid out on a timeline that shows the set of outstanding file IO operations at any point in time along with a graph of IO throughput and disk utilization. PIX also provides a view that groups your accesses by file. Presenting the data in this way makes it easy for you to spot inefficiencies in your package layout.
More documentation on file IO traces is available here.
Shader Edit & Continue
It is now possible to edit HLSL shader code directly inside PIX, and immediately see the effect of your changes on rendering results or performance. This can be useful for prototyping and optimizing shaders, as it can greatly reduce the turnaround time when trying out different ideas.
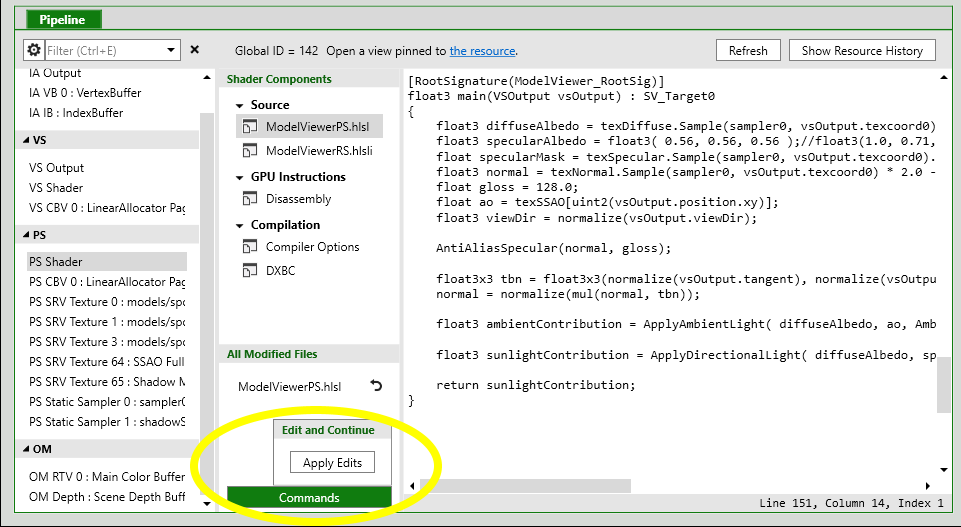
Edit & continue is accessed from the Pipeline view. After selecting a shader you can edit its code however you like, then click Commands followed by Apply Edits:
Other views (such as OM RTV 0) will update to show the effect of your change. You may find it useful to dock more than one instance of the Pipeline view next to each other in order to view rendertarget results at the same time as editing shader code.
If you lose track of exactly what you have changed, right-click on the shader code and choose Diff with Original:
This will bring up an inline diff view, showing the original code in red with your changes in yellow:
Note that PIX on Windows (unlike Xbox) does not yet support saving modified shaders back into the .pix3 file.
Pixel Cost Visualizer
The new Pixel Cost visualizer colors the scene according to the approximate rendering cost of each pixel. The brightest areas of the resulting image indicate which parts were the most expensive to render.
Pixel cost is estimated by dividing the Execution Duration of each draw call by the number of resulting pixel shader invocations, and accumulating that average each time a pixel is written. This includes the cost of other pipeline stages, but it is divided evenly across all pixel shader invocations in the draw without accounting for varying vertex density, etc.
Like our previous visualizers, Pixel Cost is accessed in the Pipeline view while inspecting the contents of a rendertarget.


0 comments