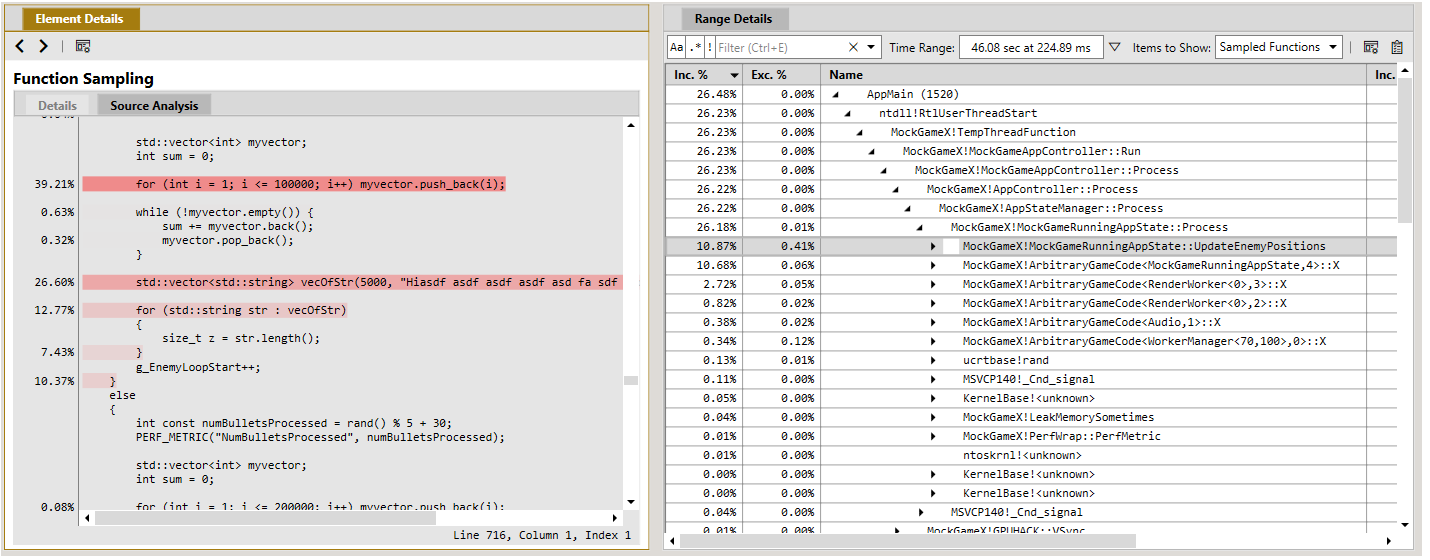
Starting with the 2104.20 release of PIX on Windows, the Sampling Profiler that is built into Timing Captures includes a C++ source code view. The source view uses coloring to attribute the collected CPU samples with source lines, thereby identifying the hot spots within a function.
The source view is available when viewing Sampled Functions in the Range Details view. To view the annotated source for a function, select the function in the Range Details view and toggle the Element Details view from Details to Source Analysis as shown in the following figure.
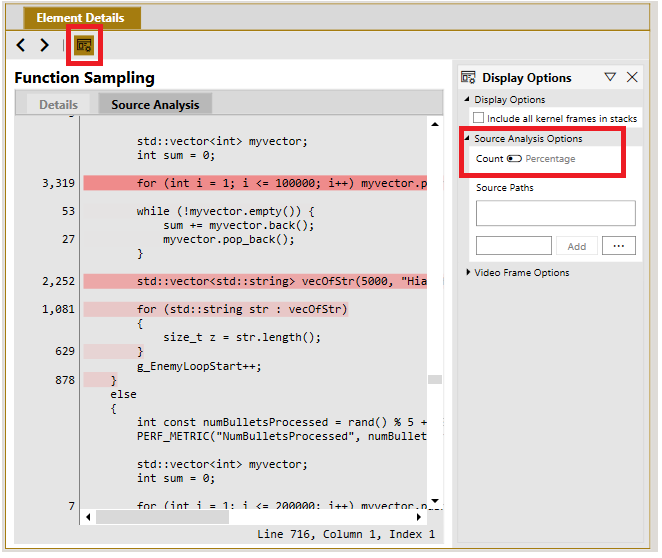
The boldness of the highlight on a given source line is relative the percentage of samples that occurred while that line was executed. The bolder the line the more frequently that line was executed. By default, the source view shows sample frequency in terms of percentages. Use the Display Options panel on the view to switch the display to sample counts, if desired.
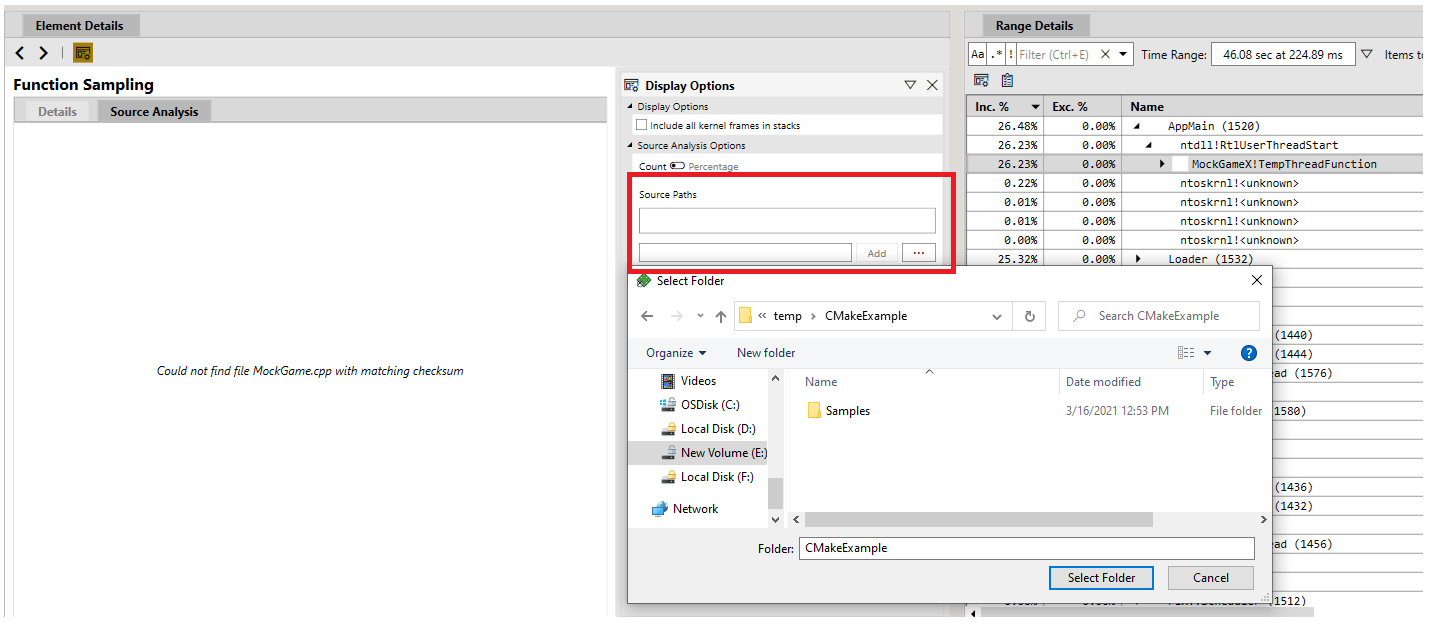
The sampling profiler uses the source file paths stored in your title’s PDBs to locate the matching source file. If that file can’t be found, the source analysis view will contain text stating:
Could not find “filename”.cpp with a matching checksum
Use the Source Paths control in either the Display Options panel or the main Settings page to specify one or more directories that PIX should search for source files if they can’t be found at the default location.
As always, use the Feedback button in the upper right corner of the PIX UI to reach us with questions or feedback.
Steven.


0 comments