If you are a Windows game developer using DirectX 12, you know that great tools are essential for getting the most out of the graphics hardware. In the past few months, we’ve been making rapid progress on delivering the tools you’ve requested. At the Game Developers Conference today, we demoed new features for both PIX, our premier tool for tuning and debugging, as well as the debug layers, a tool that ensures that your game is calling the DirectX 12 API correctly.
Of course, no GDC talk would be complete without an announcement …
Introducing hardware specific plugins for PIX
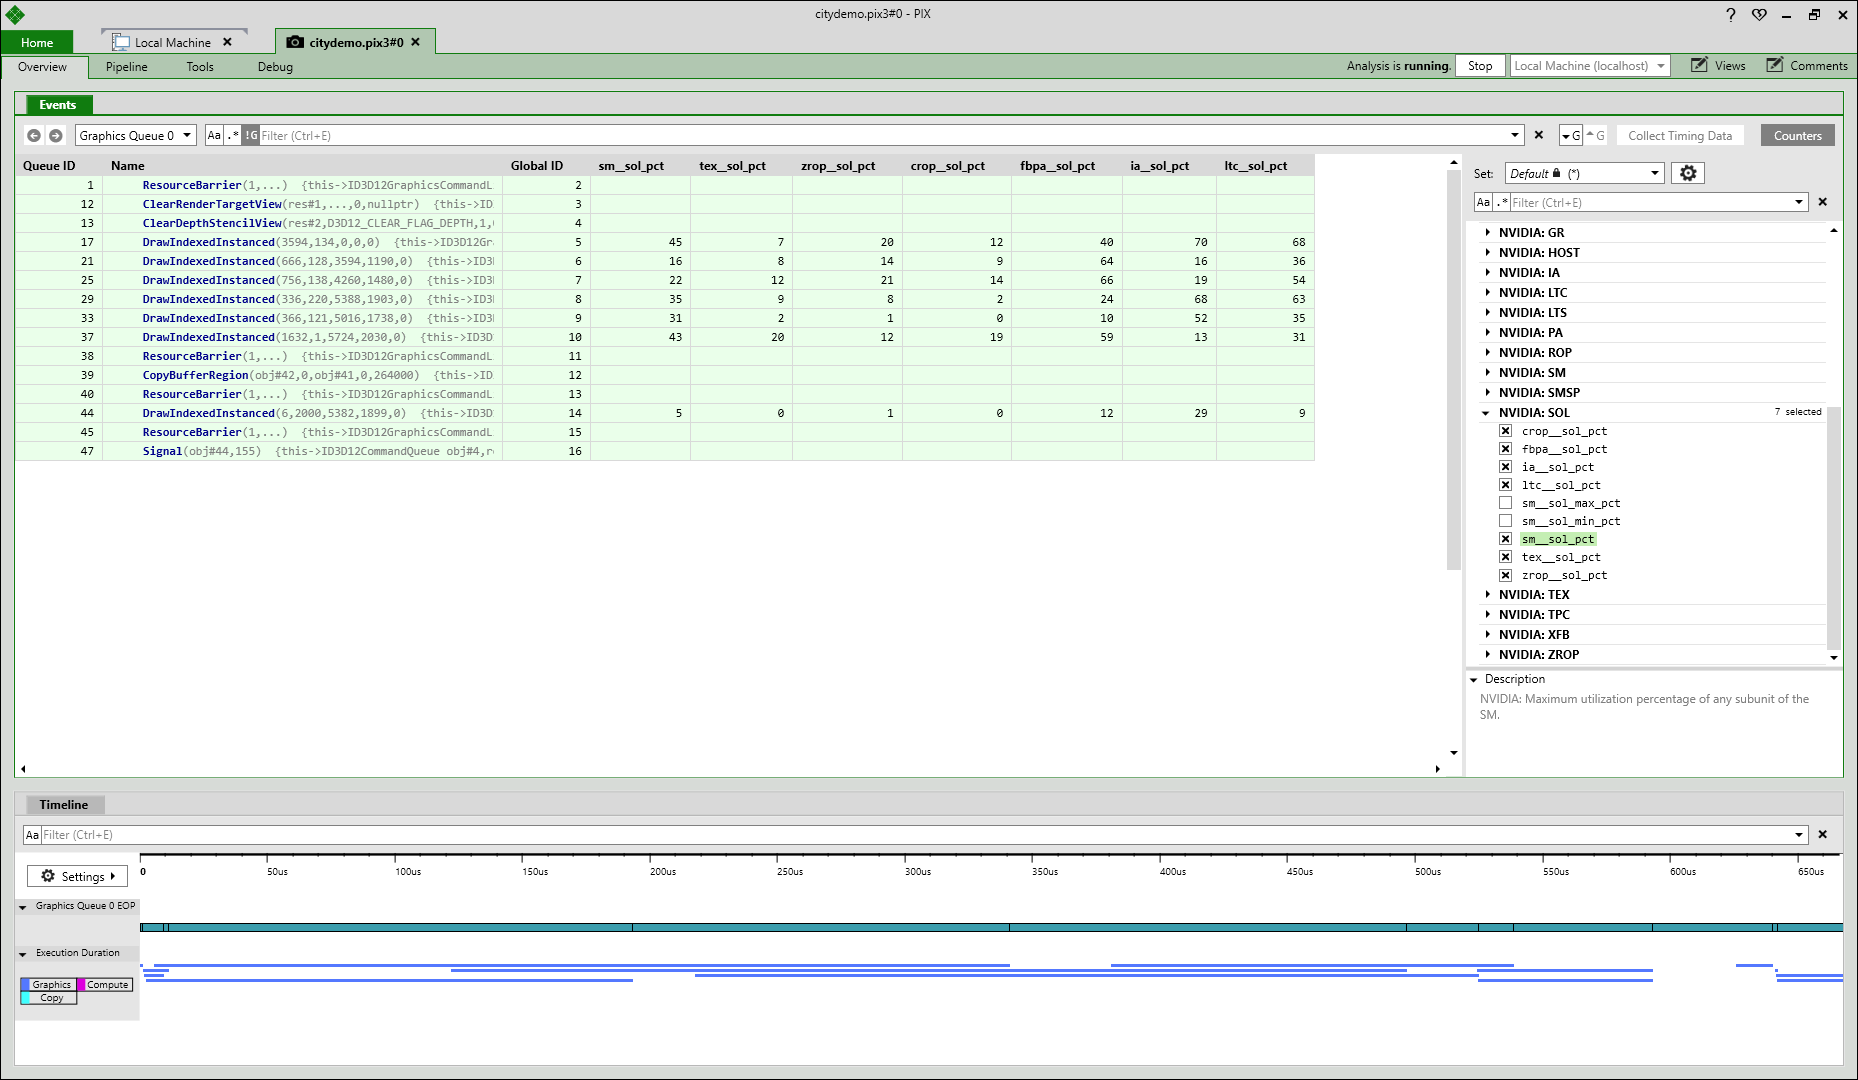
PIX on Windows supports a plugin model that enables GPU vendors to expose low-level hardware counters directly in the PIX Events list, giving a detailed breakdown of what the hardware is doing per event. Through collaboration with our partners at NVIDIA, we now have a working early version of PIX with support for NVIDIA hardware counters that we demoed today at GDC! The counters let you understand utilization of the different parts of the GPU, memory bandwidth usage and much more. The screenshot below shows a selection of NVIDIA counters enabled for a PIX GPU capture.
NVIDIA’s plugin for PIX on Windows will be available soon so be sure to check the PIX blog for updates. We’re working with AMD and Intel to provide similar plugins for their GPUs as well.
For more information on PIX, check out the initial announcement of the PIX beta, and the February update for PIX.
NVIDIA also first to provide enhanced GPU hang debugging
DirectX 12 provides unprecedented access to the GPU, which is great for optimizing performance, but low level hardware control comes with low level hardware errors such as GPU crashes and hangs. These can be very hard to troubleshoot. NVIDIA is releasing Aftermath, a new debugging tool for Windows to help you track down the source of these issues.
Aftermath is a compact C++ library aimed at D3D based developers. It works by allowing you to insert markers on the GPU timeline, which can be read post-GPU hang, to determine what work the GPU was processing at the point of failure. Aftermath also includes a facility to query the current device state, to help you understand the reason for the crash. For more information on Aftermath be sure to check NVIDIA’s session at GDC on Thursday at 3 PM and visit the NVIDIA developer blog.
Debug Layers and GPU-based validation
Another great addition to the growing set of tools for DirectX 12 is the validation built into the runtime itself. If you enable the Graphics Tools optional feature in Windows 10, you get two other tools that help speed up the development by validating API usage and troubleshooting low-level GPU issues. D3D12 debug layer is a low overhead tool to help you validate correct usage of the APIs. D3D12 debug layer should be your first line of defense against critical, hard-to-find errors. For problems that occur after work is submitted to the GPU, the GPU-based validation tool provides the next level of defense by patching shaders and command lists with validation code. This enables you to find problems such as barrier related issues, uninitialized descriptors and out-of-bounds access of descriptor heaps.
If you missed our talk at GDC a video will be available later. We’ll update this post once the video is ready.


0 comments