Have you ever had a situation when you are debugging a complex scenario with a huge list of breakpoints, and you find yourself scrolling and tapping in the breakpoints windows to disable/enable them individually and repetitively?
Then the new Breakpoint Groups feature in Visual Studio may be the answer for you. This feature will allow you to create named breakpoint groups with any number of breakpoints in them. This provides a way to customize the breakpoint configuration and toggle breakpoints individually or in combination making debugging, testing, and troubleshooting faster and more effective.
Breakpoint Groups is now available in Visual Studio’s 17.6 P2 and will become a staple of the debugging process for many developers.
Breakpoint Groups
Breakpoint groups can simplify and organize the debugging process by allowing you to create separate breakpoint groups that correspond to distinct aspects of the application, such as individual functions, modules, or even projects. This organization makes it easy to switch between different debugging scenarios, test different theories, and track the results of each debugging session.
Let’s see an example: I have this .NET web application where users can browse through merchandise and purchase items they like. While working on the application, I discovered that the basket/cart feature is not showing all the items that users have added. To investigate, I added several breakpoints in my BasketViewModelService.cs file.
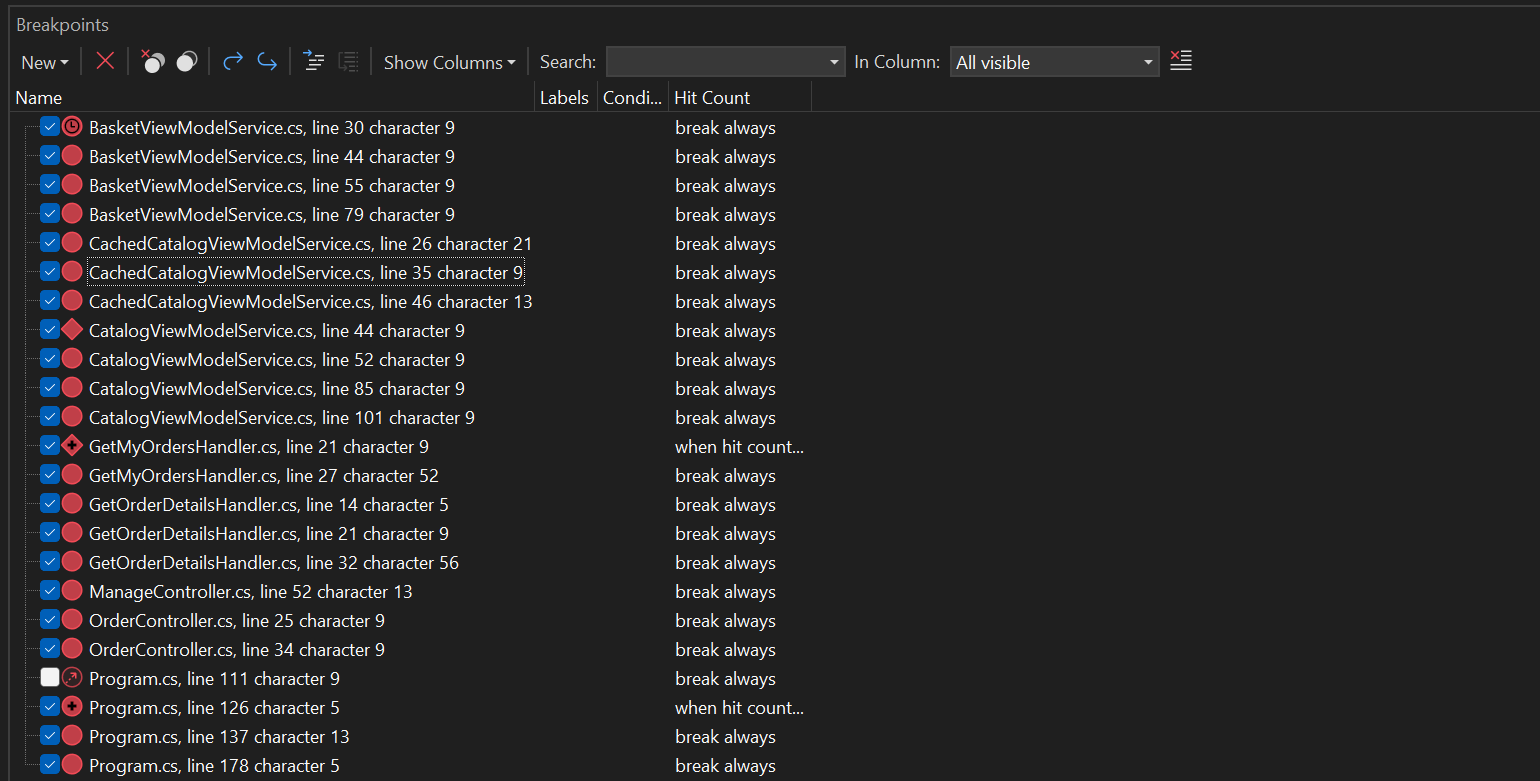
I also had a lot of breakpoints from my last session that I may need later for different scenarios, so I ended up with this long list of breakpoints. (As shown in the image below). Once I started debugging and stepping through the code to investigate the new basket/cart scenario, all of my other breakpoints started triggering as well. The only solution I had was to disable all of the breakpoints I didn’t need individually, which was a tedious process.

Create and manage Breakpoint Groups
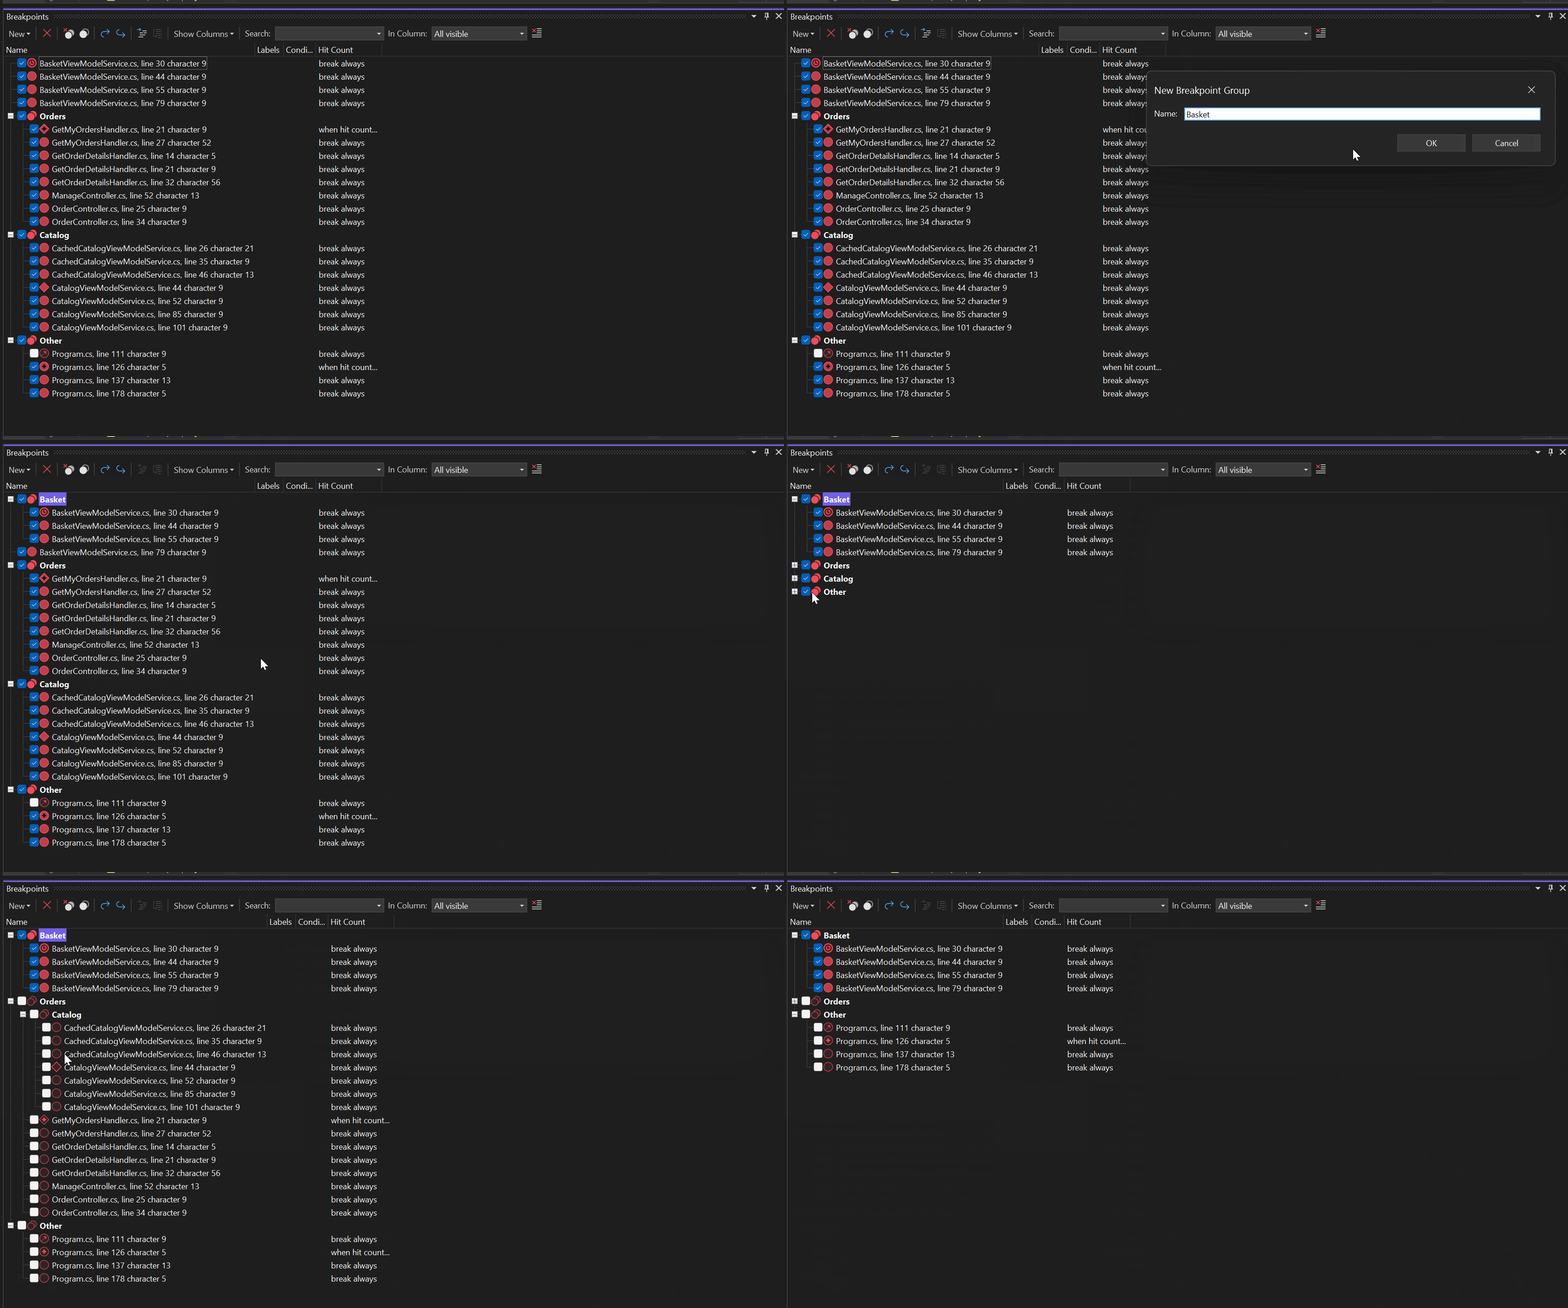
Now let’s see how I can simplify this scenario using Breakpoint Groups. With this feature, I created a Breakpoint Group named “Basket”. You can create a new breakpoint group using the “New” dropdown in the breakpoints window or using the Debug > New Breakpoint menu on the top.
I added all the breakpoints I need to debug my current issue in the “Basket” Group using the “Add to Breakpoint Group” right-click option. You can also simply drag and drop breakpoints into the desired group. I created some other groups for my prior breakpoints. This is how my breakpoint window looks now.

For my scenario, I only kept the breakpoints from the “Basket” group enabled and disabled everything else. This way, I was able to quickly step through the code only focusing on the “Basket” scenario to find the root of the issue. I can still toggle other breakpoints individually or in groups as needed. In addition, all my breakpoints were organized in a hierarchical structure which made it much easier to locate them.

To sum it up, breakpoint groups can play a pivotal role in software development since they allow developers to quickly narrow down sources of issues and bugs and enable the seamless working of multiple projects and investigations simultaneously.
Coming up, we have several exciting enhancements such as dependent breakpoint groups, breakpoint group import/export, and others. Keep an eye out for upcoming Preview releases for these!
We want your feedback!
The Breakpoint Groups feature in Visual Studio is a game-changer for both experienced developers and those new to the platform. As the feature continues to evolve, we invite you to test it out in 17.6 Preview 2 and provide your feedback on the Allow creation of breakpoint groups ticket on Developer Community.
Additionally, you can easily report bugs, offer suggestions, ask questions, and share your thoughts on other Visual Studio features by using Developer Community.


Unrelated comment, but best way i figured to reach the responsible person @Harshada Hole:
I have a bug report and feature request for the IEnumerable visualizer. Its a great little feature!
When I debug the Headers of a HttpRequest, I get the situation that I have a IEnumerable of KeyValuePair[string, StringValues]. The visualizer shows the Key twice but no value.
At least the KeyValuePair.Value field should be displayed (I expect the result of its ToString). I would see the current behaviour as a bug.
There could be even some special converter to map them... the StringValues (and in general Properties...
@Jonas Brekle, thanks for reaching out. Can you please file a feedback ticket (https://learn.microsoft.com/en-us/visualstudio/ide/how-to-report-a-problem-with-visual-studio?view=vs-2022) so I can pass this on to our Engineering team?
submitting it there did not work due to login issues “Sorry, we couldn’t send your report, because the server connection timed out. Please retry now or sign out from Visual Studio, sign in using Visual Studio and try again” i tried but to no effect. Giving up.
This is a great feature!
I can imagine it’s not simple, but that would be even better if breakpoints could sync accross branches on git.
On switching branch all the breakpoints in modified files are misaligned.
love it
Great initiative!,
in addition to manual group naming, it would be even more powerful , if allowed to group by Project, Namespace, Class, Folder e.t.c
Similar to what exists in the Test Explorer.
I understand that breakpoints aren’t specific to the .NET ecosystem.
Nice. I’ve wanted this for years. Hopefully I can upgrade to Visual Studio 2022.