Hello everyone! As you may have heard, today we announced the first CTP of the Roslyn project! You can visit the Roslyn MSDN Page to learn more about the project and to download the CTP. You can also read more about Roslyn at the following links –
- Soma’s Blog
- Eric Lippert’s Blog
- C# Frequently Asked Questions Blog
- Visual Basic Team Blog
- Visual Studio Blog
In this post I will present a brief overview of two samples that are installed as part of the CTP – the Syntax Visualizer Tool Window and the Syntax Debugger Visualizer – and discuss how to install and use these samples. These samples are in essence tools that can simplify inspection and exploration of Roslyn Syntax Trees. You can use these visualizers as debugging aids when you develop your own applications / code issues / code refactorings using the Roslyn APIs.
Getting Started
Lets begin by downloading and installing the CTP from Roslyn CTP Download Page. Once installed, the best place to start is to open Start Menu -> Microsoft Codename Roslyn CTP -> Getting Started. This will launch the the “Getting Started” guide which provides a great overview of what’s included in the CTP as well as links to launch the documents, walkthroughs and samples that are included in the CTP.
To understand the concepts presented in this blog post better, I would strongly recommend reading the Roslyn Project Overview Document. This document provides a great overview of the Roslyn Syntax API including Syntax Trees, Syntax Nodes, Syntax Tokens and Syntax Trivia. This document is installed on your machine when you install the CTP and you can open this document using the link in the “Getting Started” guide.
Next, lets navigate to the Samples section in the “Getting Started” guide by clicking on the link titled ‘Samples’ under the section titled ‘Contents’. Then click on the link titled ‘Roslyn Development Tools’. This should bring you to a section that gives a brief overview of two samples that are the subject of this post –
Lets take a closer look at these samples.
Syntax Visualizer Tool Window
The Syntax Visualizer Tool Window sample is a Visual Studio Extension that enables inspection of ‘live’ Roslyn Syntax Trees for any C# or VB code file that is open inside the Visual Studio IDE when the Roslyn Language Service is present. The Roslyn Language Service is present whenever you are running or debugging other Roslyn extensions (like code issues and code refactorings). It is also present whenever you debug (F5) or run (Ctrl + F5) the project for the Syntax Visualizer Tool Window sample.
Lets open the Syntax Visualizer Tool Window sample in Visual Studio by clicking on the link with the corresponding title in the “Getting Started” guide. Once the project is open inside Visual Studio, you should find a file named ‘Readme.html’ under the ‘SyntaxVisualizerExtension’ project as shown in the below image. This file contains a brief overview of this sample and also details the steps for installing and running this sample.
Now lets build and run this sample by clicking on Debug –> Start Debugging (F5) or Debug –> Start Without Debugging (Ctrl + F5). This should bring up a new instance of Visual Studio (within which the Roslyn Language Service is present).
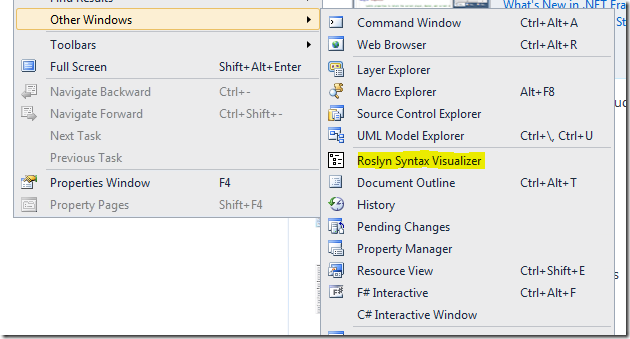
In this new Visual Studio instance, click on View –> Other Windows –> Roslyn Syntax Visualizer to bring up the Syntax Visualizer.
This should bring up a tool window that looks like below. Lets dock this tool window at a convenient location inside Visual Studio. I usually dock this window on the left side.
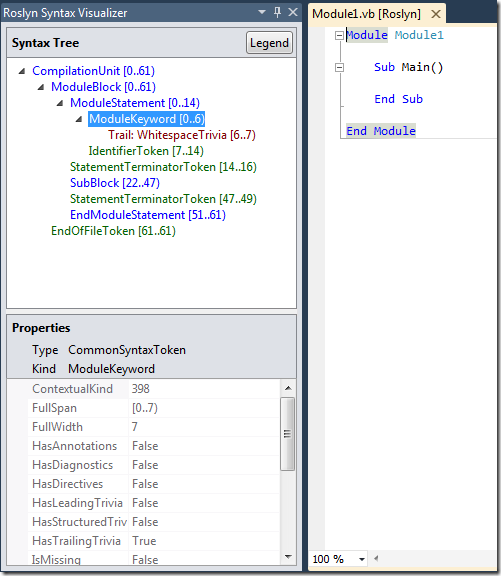
Now in the same Visual Studio instance, create a new project by clicking on File –> New Project. You can create either a VB / C# project. As soon as Visual Studio opens the main code file for this project, you should see the Syntax Tree for this file in the visualizer tool window as shown in the below image. You can open any existing C# / VB file in this Visual Studio instance and the Syntax Tree for the opened file will be displayed in the visualizer tool window. If you have multiple code files open inside Visual Studio, the visualizer will always display the Syntax Tree for the currently active code file (i.e. the code file that has keyboard focus).
As you can see in the above image, the visualizer tool window displays the Syntax Tree at the top and a property grid at the bottom. The property grid displays the properties of the item that is currently selected in the tree, including the .NET ‘Type’ and the ‘Kind’ (SyntaxKind) of the item.
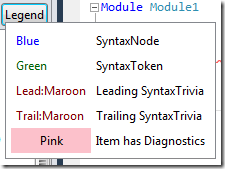
Roslyn Syntax Trees are comprised of three types of items – Syntax Nodes, Syntax Tokens and Syntax Trivia. You can read more about these types in the Roslyn Project Overview Document. Items of each type are represented using a different color. You can click on the button titled ‘Legend’ for a better understanding of this color coding.
Each item in the tree also displays its own ‘Span’. In the above example, the selected item “ModuleKeyword [0..6)” has a Span that is 6 characters wide i.e. [0..6).
There are a couple of different ways in which you can navigate the tree –
- You can navigate the tree by expanding / clicking on items in the tree. If you click on an item in the tree, the visualizer will automatically select the text corresponding to this item’s Span in the code editor.
- You can also navigate the tree by clicking on / selecting text in the code editor. In the above example, if you select the line containing “Module Module1” in the code editor, the visualizer will automatically navigate to the corresponding “ModuleStatement [0..14)” item in the tree. In essence, the visualizer will try to find and highlight the item in the tree whose span best matches the span of the text that you select.
Next, lets see what happens when we modify the code in the active code file. In the above example, lets type the statement “Console.WriteLine()” inside the “Sub Main()” block. As you type, notice that the visualizer refreshes the tree to match the most current version of the typed code.
Pause typing once you have typed “Console.” Notice that the tree has some items colored in pink. This is because at this point, there are errors (also referred to as ‘Diagnostics’) in the typed code. These errors are attached to Syntax Nodes / Syntax Tokens / Syntax Trivia in the Syntax Tree and the visualizer shows you which items have errors attached to them by coloring them specially. You can inspect the errors that are present on any item colored pink by hovering over the item with your mouse. Note that the visualizer will only display syntactic errors (i.e. errors related to the syntax of the typed code) – it will not display any semantic errors.
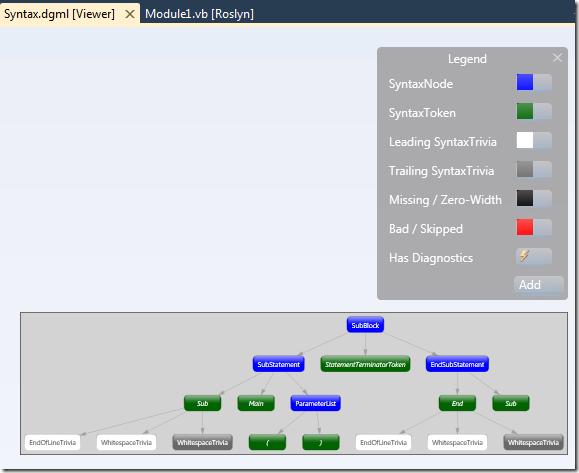
In Visual Studio Premium and Visual Studio Ultimate, you can also right click on any item in the visualizer tool window and click on Directed Syntax Graph. This will display a graphical representation of the sub-tree rooted at the selected item. This feature is not available in Visual Studio Professional.
Lets try this for the “SubBlock [22..47)” item in the above example. This should display a Syntax Graph that looks as follows.
As you can see the Syntax Graph also displays a legend for the coloring scheme it uses. You can hover over individual items in the Syntax Graph with the mouse to view the properties corresponding to that item.
You can view Syntax Graphs for different items in the tree repeatedly and the graphs will always be displayed in the same window inside Visual Studio. You can dock this window at a convenient location inside Visual Studio so that you don’t have to switch between tabs to view a new Syntax Graph. I usually dock this window at the bottom (below my code editor windows).
Below is the docking layout that I normally use for the visualizer tool window and the Syntax Graph window.
You can close the visualizer tool window at any time and once closed it should cease to have any impact. You can also disable / uninstall the visualizer extension completely using Tools –> Extension Manager in Visual Studio.
With that we come to the end of the overview for the Syntax Visualizer Tool Window sample.
Syntax Debugger Visualizer
Next, lets take a look at the Syntax Debugger Visualizer sample. This sample is a tool that can be used within a Visual Studio debug session to visualize Roslyn Syntax Trees, Syntax Nodes, Syntax Tokens and Syntax Trivia.
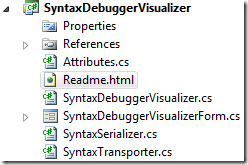
Open the Syntax Debugger Visualizer sample in Visual Studio by clicking on the link with the corresponding title in the “Getting Started” guide. Once the project is open inside Visual Studio, you should find a file named ‘Readme.html’ under the ‘SyntaxDebuggerVisualizer’ project as shown in the below image. This file contains a brief overview of this sample and also details the steps for installing and running this sample.
The ‘SyntaxDebuggerVisualizer’ project itself is just a library, and cannot be run. Lets build this project by clicking on Build –> Build Solution in Visual Studio. Next, lets navigate to the bin directory of this project and copy the files present in this directory to the …\Documents\Visual Studio 2010\Visualizers directory. You may need to create the …\Documents\Visual Studio 2010\Visualizers directory in case it doesn’t exist already on your computer.
Once copied, the debugger visualizer is ready for use within Visual Studio. Close and reopen Visual Studio to make sure that the debugger visualizer is recognized.
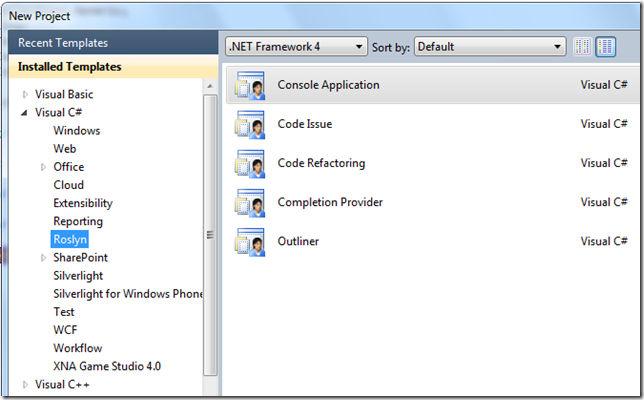
Lets write a small test program to test the debugger visualizer. In the new instance of Visual Studio that you just opened, create a new Roslyn Console Application using the File –> New Project dialog.
In the “Main()” function of this Roslyn Console Application, paste the following code –
var tree = Roslyn.Compilers.CSharp.SyntaxTree.ParseCompilationUnit(@"class c1 { }");
var token = tree.Root.DescendentTokens().First();
Console.WriteLine(token.Kind);
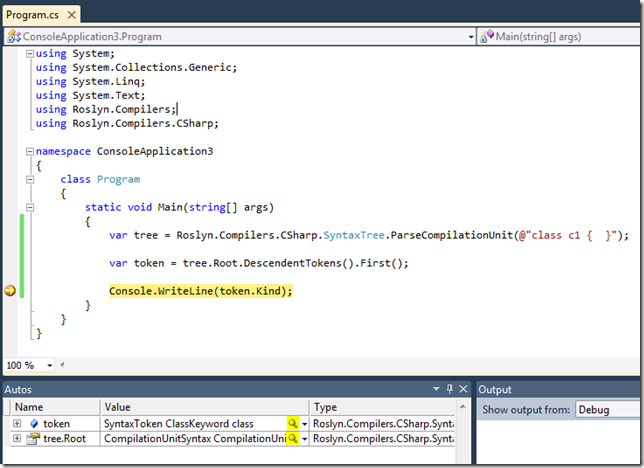
The above code uses the Roslyn API to create a Syntax Tree, selects a Syntax Token from this tree and prints the ‘Kind’ of this Syntax Token on the console. Lets put a breakpoint on the “Console.WriteLine(token.Kind);” line above and run the program under the debugger by clicking on Debug –> Start Debugging (F5).
Once the execution breaks at the breakpoint, lets bring up Visual Studio’s Autos window. Notice the magnifying glass icons that appear next to the two variables in the Autos window. The presence of this magnifying glass icon indicates that the debugger visualizer was correctly installed and that it is available for use.
In fact, once the debugger visualizer is installed, the above magnifying glass icon should appear in debugger windows next to any object with type –
- Roslyn.Compilers.Common.CommonSyntaxTree
- Roslyn.Compilers.Common.CommonSyntaxNodeOrToken
- Roslyn.Compilers.Common.CommonSyntaxNode
- Roslyn.Compilers.Common.CommonSyntaxToken
- Roslyn.Compilers.Common.CommonSyntaxTrivia
- Roslyn.Compilers.CSharp.SyntaxTree
- Roslyn.Compilers.CSharp.SyntaxNodeOrToken
- Roslyn.Compilers.CSharp.SyntaxNode
- Roslyn.Compilers.CSharp.SyntaxToken
- Roslyn.Compilers.CSharp.SyntaxTrivia
- Roslyn.Compilers.VisualBasic.SyntaxTree
- Roslyn.Compilers.VisualBasic.SyntaxNodeOrToken
- Roslyn.Compilers.VisualBasic.SyntaxNode
- Roslyn.Compilers.VisualBasic.SyntaxToken
- Roslyn.Compilers.VisualBasic.SyntaxTrivia
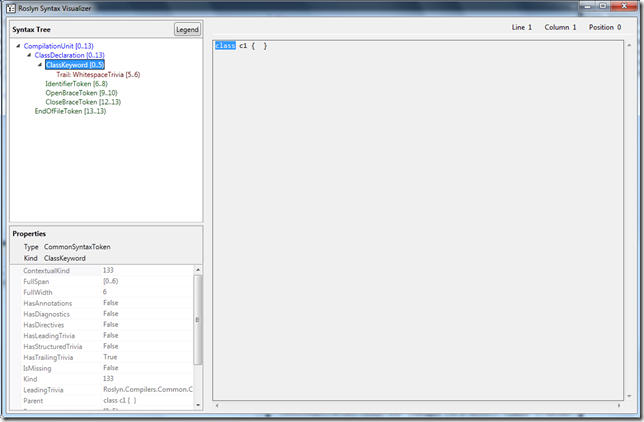
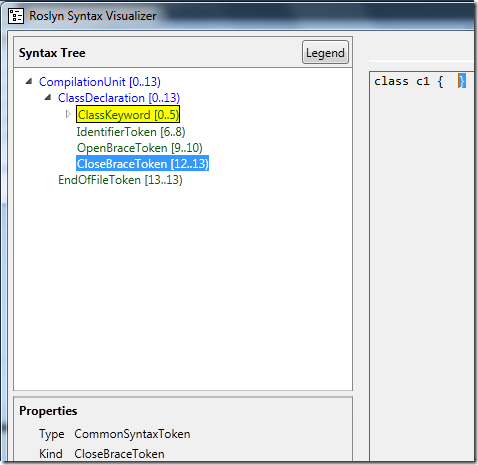
Lets click on the magnifying glass that appears next to the variable “token” in the Auto’s window above. This should bring up the following debugger visualizer window. The Syntax Token that you selected in the Autos window is highlighted in the tree and the text corresponding to the Span of this Syntax Token is also highlighted in the text box.
The visualizer displays the Syntax Tree at the top and a property grid at the bottom and the operation of these controls is essentially the same as in the case of the Syntax Visualizer Tool Window sample that we discussed earlier in this post. The rich Visual Studio code editor in the Syntax Visualizer Tool Window is replaced with a read-only text box in the Syntax Debugger Visualizer. However, you can still navigate the tree by either clicking on / expanding items in the tree or by clicking on / selecting text in the text box.
For example, lets select the closing brace “}” in the text box using the mouse – this will automatically select the corresponding item in the tree as shown in the below image.
Notice also that the Line, Column and Position info corresponding to the currently selected text in the text box are displayed at the top right portion of the visualizer window.
Note: The debugger visualizer does not support visualizing the following types of objects. It will display an error message if it encounters an object that it cannot visualize correctly.
- Syntax Nodes / Syntax Tokens / Syntax Trivia from a Syntax Tree that was parsed using non-default Parse Options.
- Syntax Nodes / Syntax Tokens / Syntax Trivia generated using Roslyn Syntax Factory Methods (such as Syntax.ParseExpression(), Syntax.ParseStatement(), Syntax.CompilationUnit() etc.).
Note: There is a known bug in the implementation of the Syntax Debugger Visualizer sample. Please take a look at this Roslyn Forum Post (that contains a list of known issues for the Roslyn CTP) for a description of this bug and how you can fix this.
Feedback
I hope you had a fun time learning about the two Syntax Visualizers. Do try them out and use them as you explore the Roslyn APIs and develop new code issues / code refactorings!
We are very excited to get an early preview of the Roslyn technology in your hands and would love to hear your feedback, ideas and suggestions about the CTP and also about the visualizer tools described in this post. Please use the CTP to build rich code tools and extensions so that you can learn more about the APIs and provide feedback.
Please note that this is a technology preview and there are known limitations and bugs. The primary goal of this CTP is to give you an early preview of the Roslyn APIs and gather feedback. While the shape of the public API surface is complete, only a subset of the C# and Visual Basic languages have been implemented end-to-end in the CTP. You can find a complete list of known issues and non-implemented language features on this Roslyn Forum Post.
Please use the Roslyn Forum to ask questions and provide feedback and Microsoft Connect to log bugs and suggestions.
Thank You! Shyam Namboodiripad Software Development Engineer in Test (Roslyn Compilers Team)






0 comments