“Why is this value changing unexpectedly and where or when is this occurring?!”
This is a question many of us dread asking ourselves, knowing that we’ll have to do some tedious trial-and-error debugging to locate the source of this issue. For C++ developers, the exclusive solution to this problem has been the data breakpoint, a debugging tool allowing you to break when a specific object’s property changes. Fortunately, data breakpoints are no longer a C++ exclusive because they are now available for .NET Core (3.0 or higher) in Visual Studio 2019 Preview 2!
Data breakpoints for managed code were a long-requested ask for many of you. They are a great alternative to simply placing a breakpoint on a property’s setter because a data breakpoint focuses on a specific object’s property even when it’s out of scope, whereas the former option may result in constant, irrelevant breaks if you have hundreds of objects calling that function.
How do I set a data breakpoint?
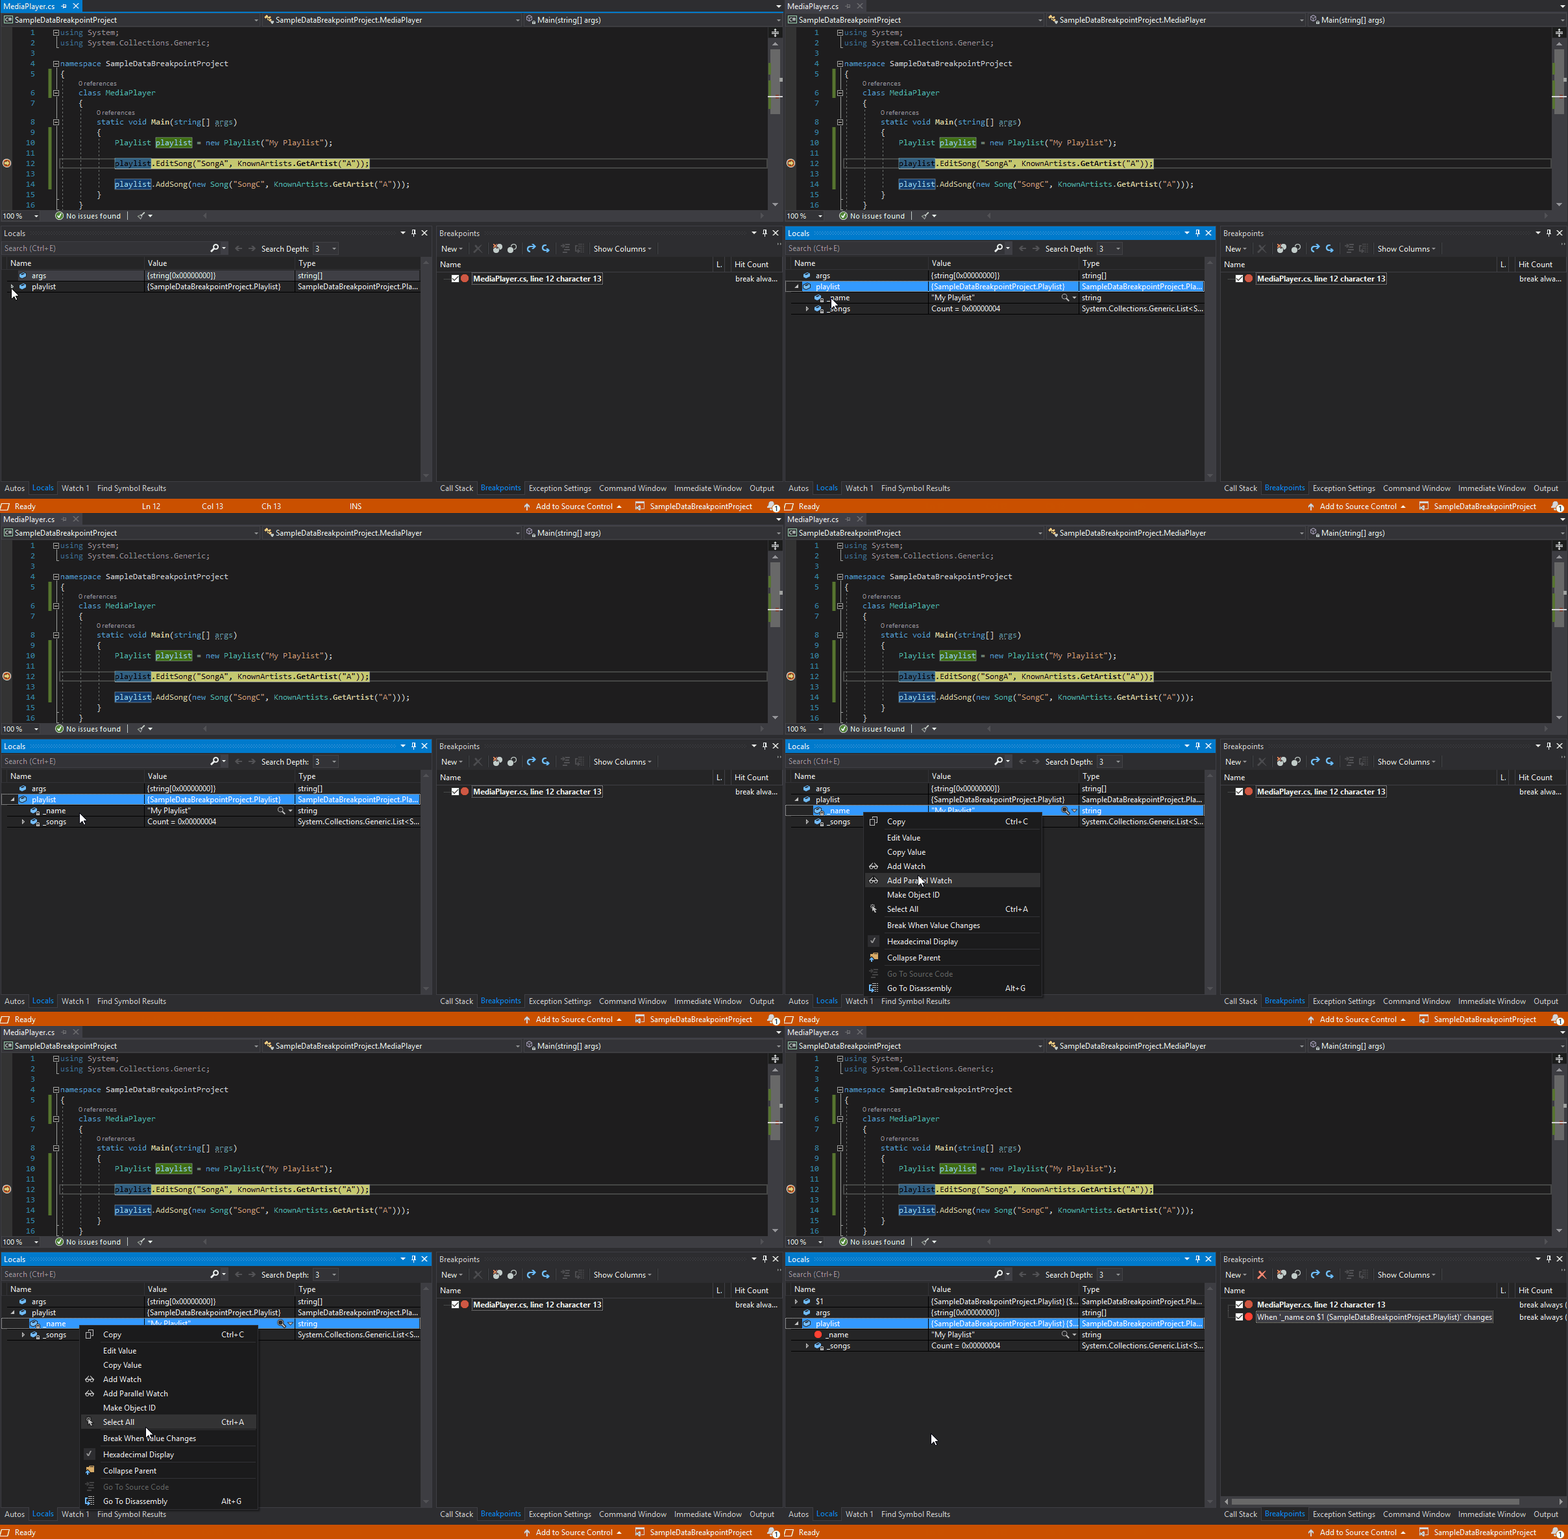
Setting a data breakpoint is as easy as right-clicking on the property you’re interested in watching inside the watch, autos, or locals window and selecting “Break when value changes” in the context menu. All data breakpoints are displayed in the Breakpoints window. They are also represented by the standard, red breakpoint circle next to the specified property.

When can I use data breakpoints?
Now that you know how to set a data breakpoint, now what? Here are some ways to take advantage of data breakpoints when debugging your .NET Core applications.
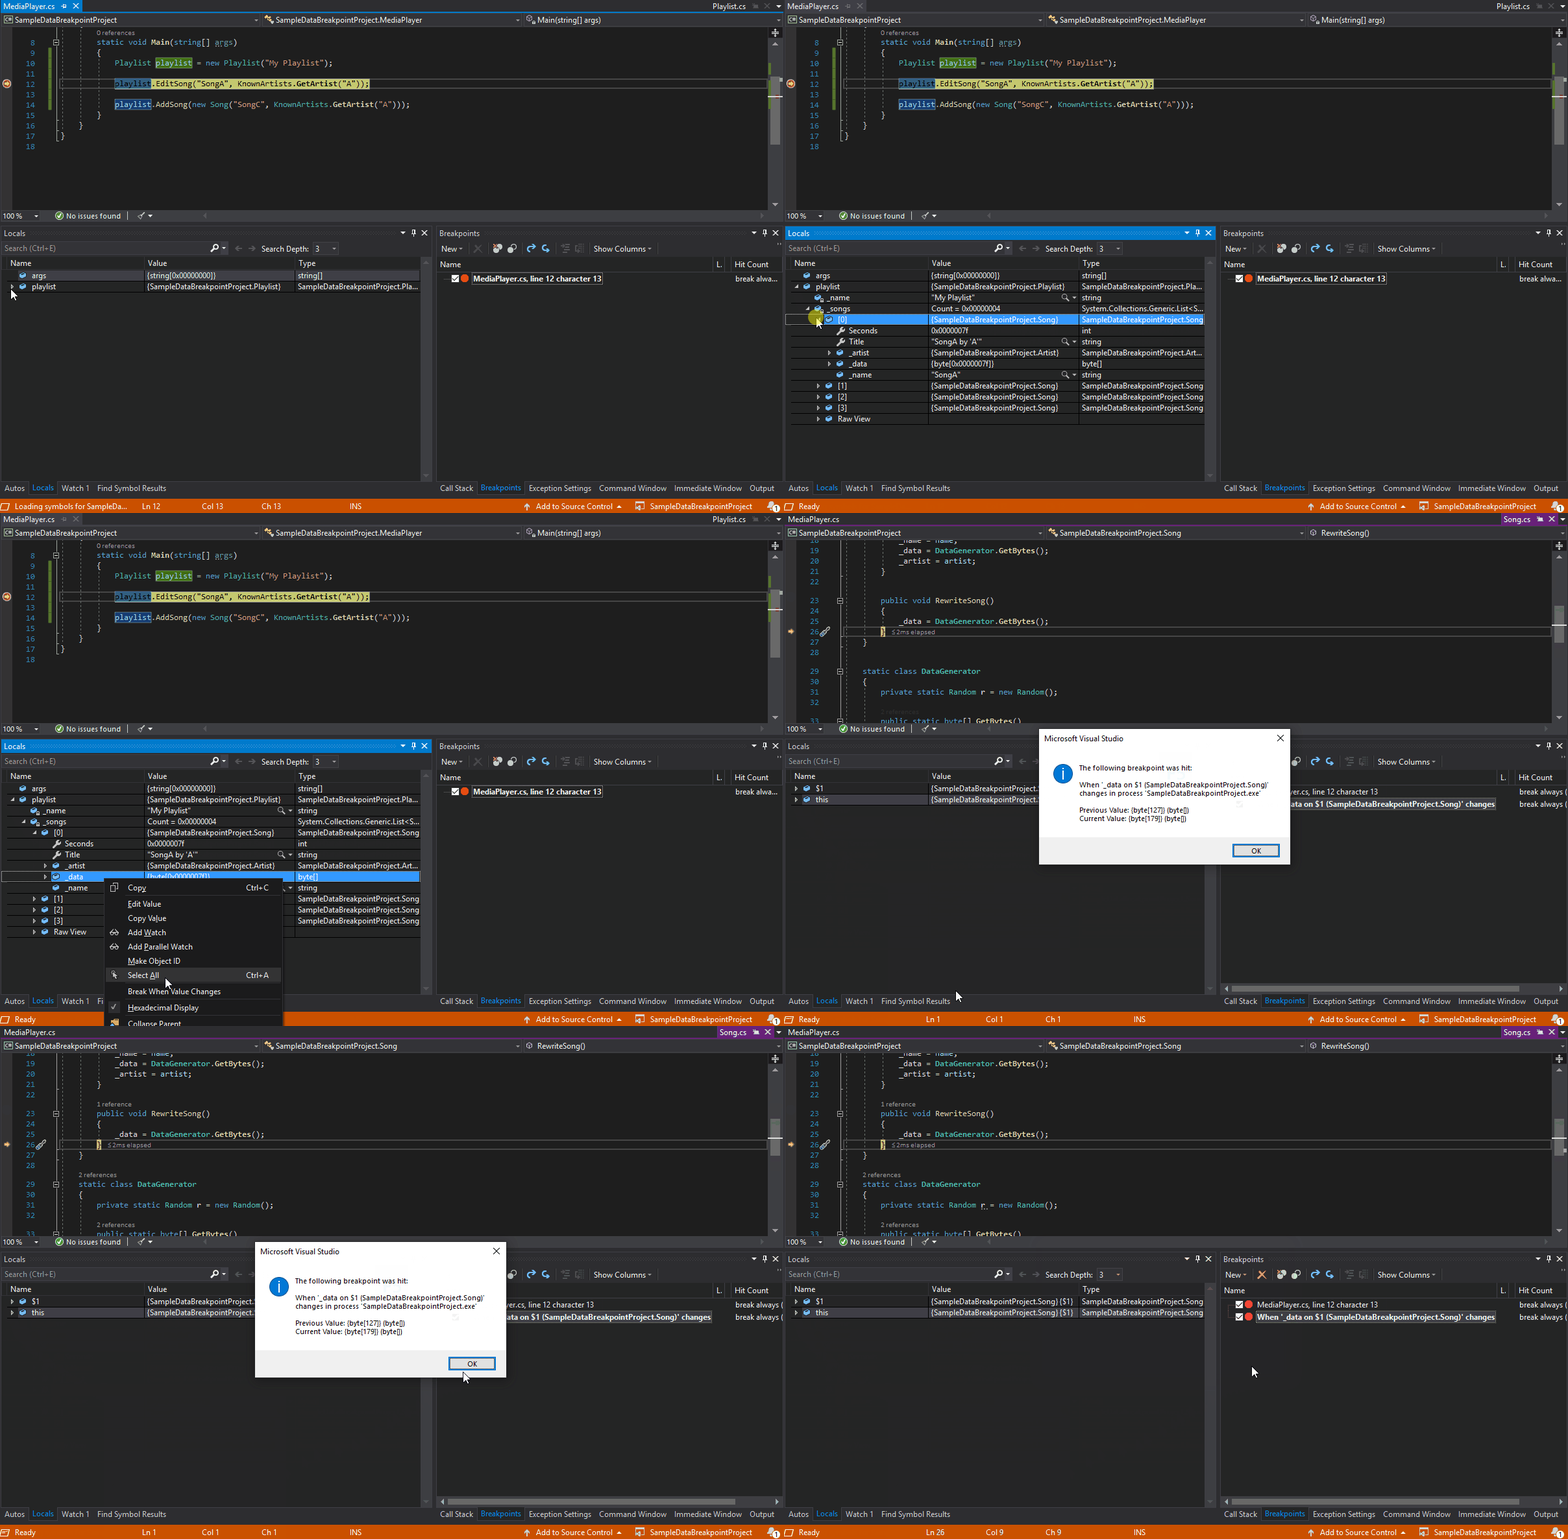
Let’s say that you want to figure out who is modifying a property in an object and for most of the time, this property change does not happen in the same file. By setting a data breakpoint on the property of interest and continuing, the data breakpoint will stop at the line after the property has been modified.

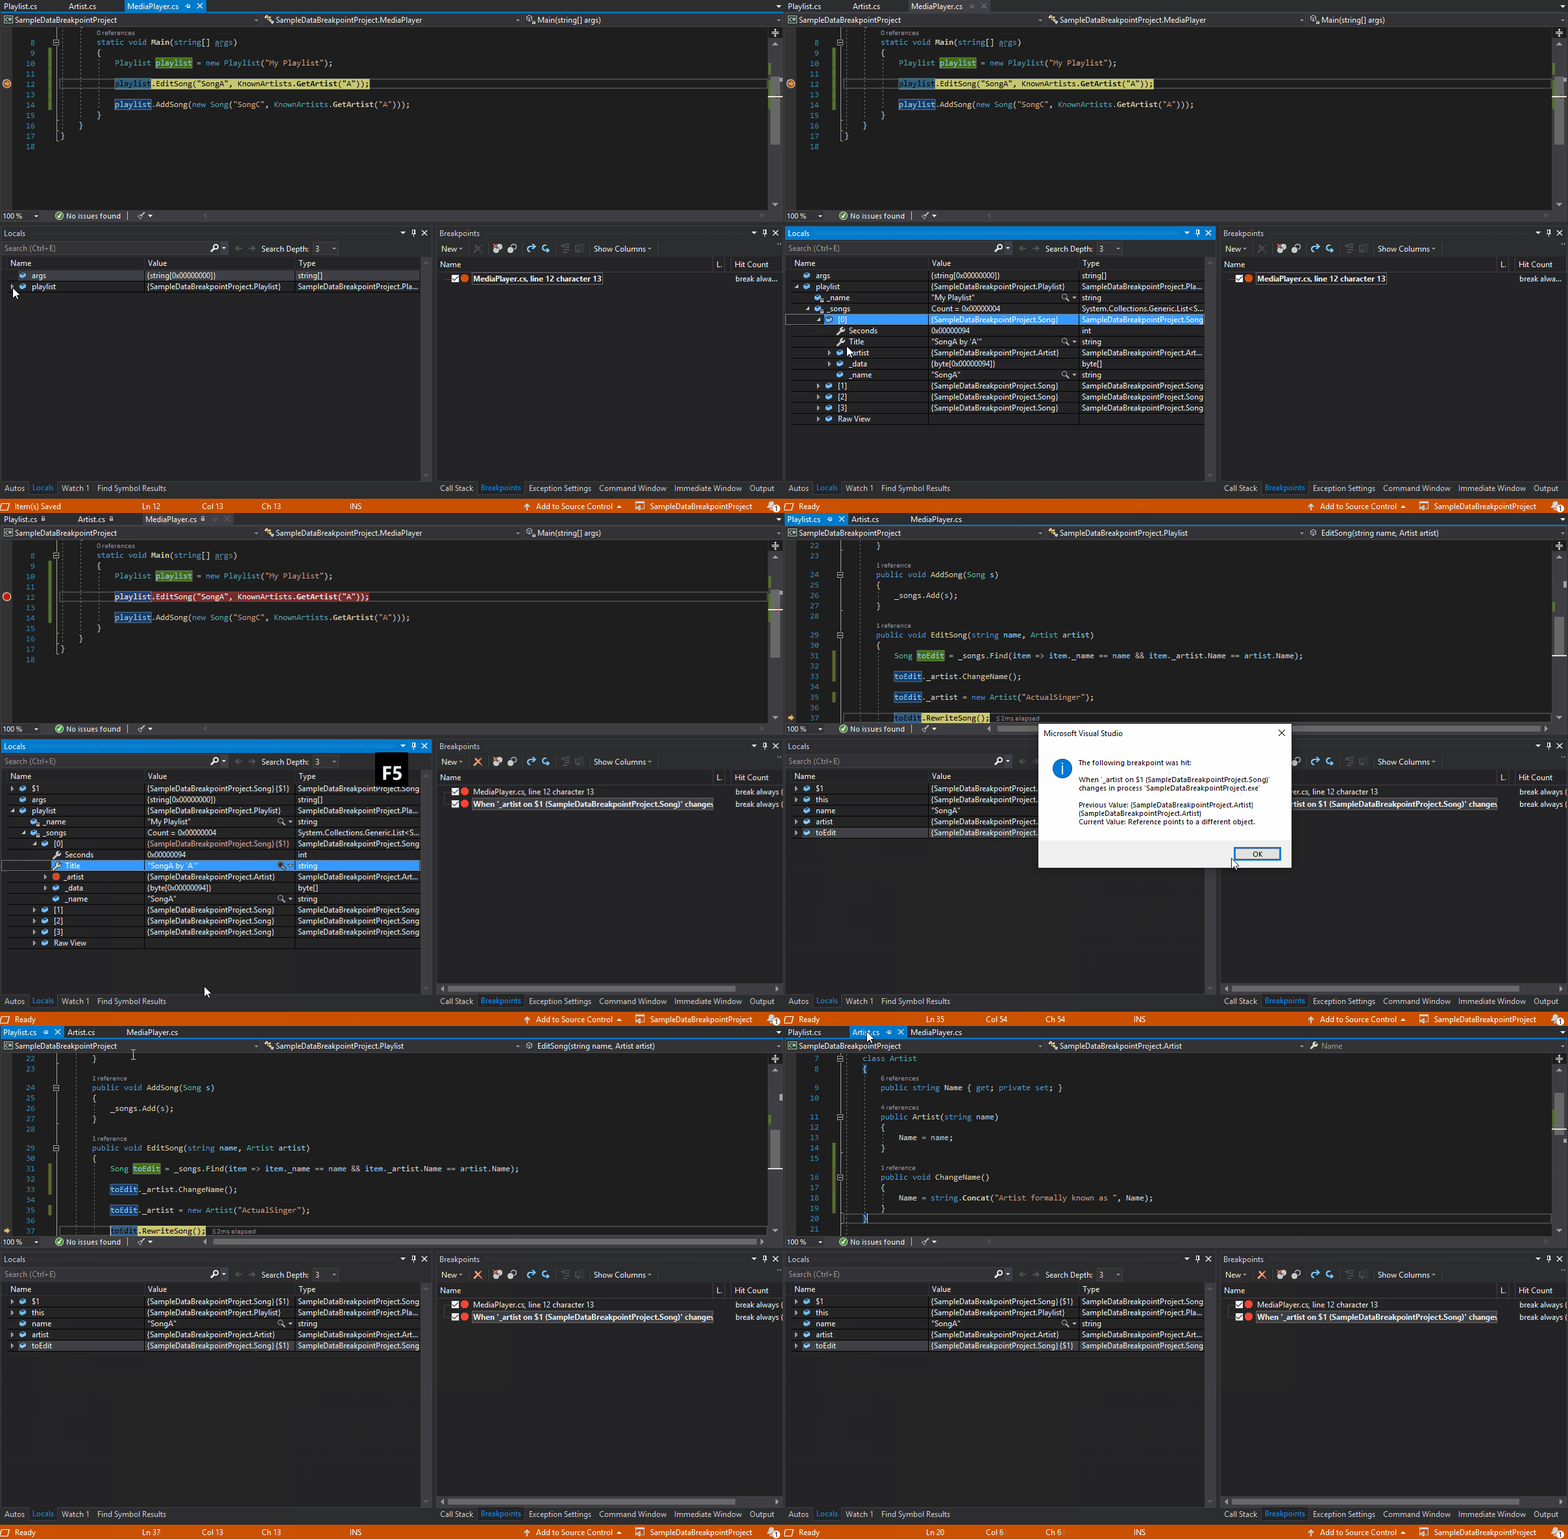
This also works for objects. The data breakpoint will stop when the property referencing the object changes value, not when the contents of the object change.

As illustrated in the GIF above, calling the toEdit._artist.ChangeName() function did not cause a breakpoint to hit since it was modifying a property (Name) inside the Song’s Artist property. In contrast, the data breakpoint hits when the _artist property is assigned a reference to a new object.
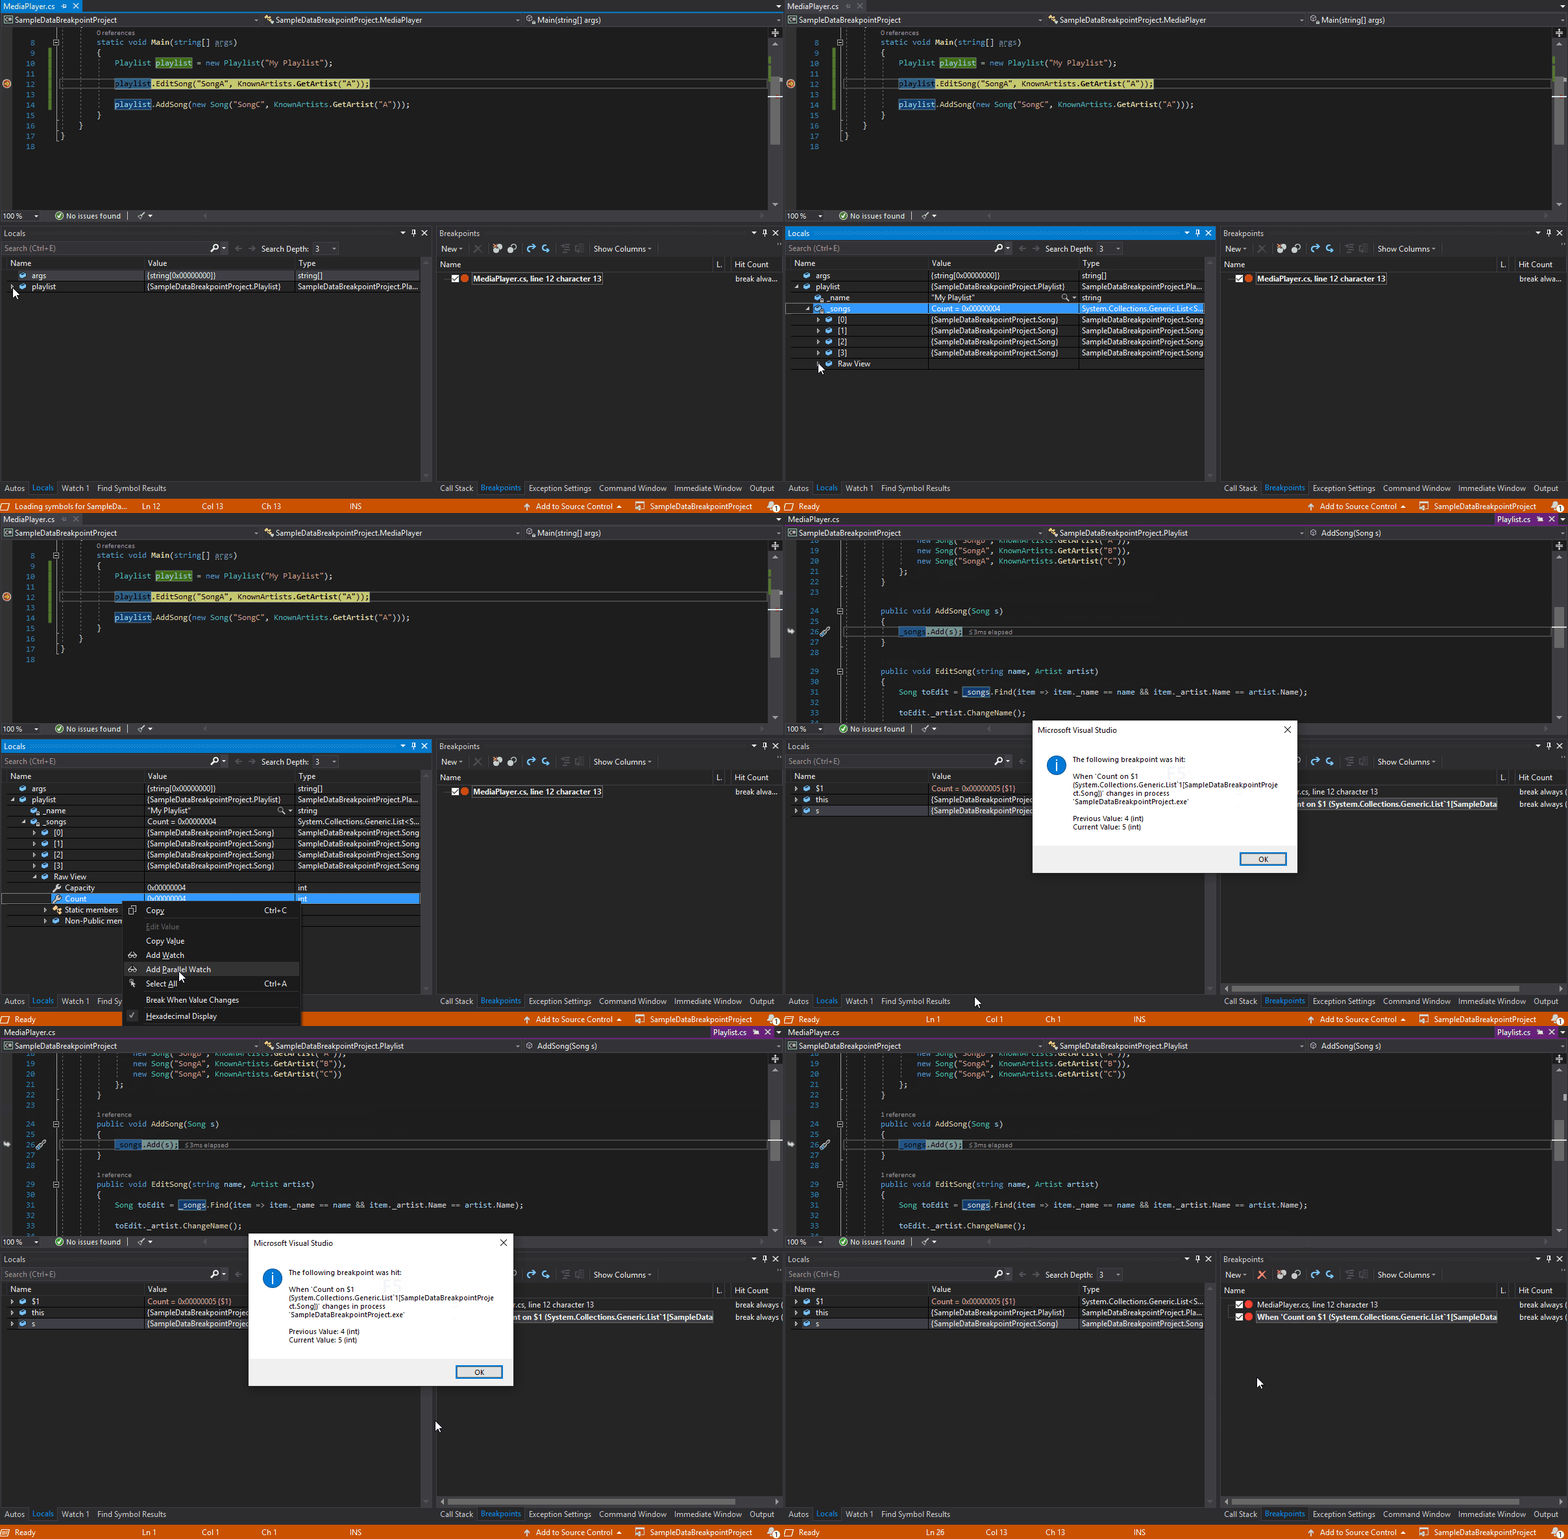
Data breakpoints are also useful when you want to know when something is added or removed from a collection. Setting a data breakpoint on the ‘Count’ field of classes from System.Collections.Generic makes it easy to detect when the collection has changed.

Are there opportunities for improving managed data breakpoints?
Since Visual Studio 2019 is still in preview, we highly encourage you to experiment, play around with, and provide feedback for this iteration of data breakpoints. Here are some known scenarios where data breakpoints currently cannot be set that we are working on erasing and improving in future Visual Studio updates:
- Properties that are not expandable in the tooltip, Locals, Autos, or Watch window
- Static variables
- Classes with the DebuggerTypeProxy Attribute
- Fields inside of structs
Managed data breakpoints also exclude properties that call native code and properties that depend on too many fields.
Ready to try data breakpoints in your .NET Core applications? Let us know in the comments!
For any issues or suggestions about this feature, please let us know via Help > Send Feedback > Report a Problem in the IDE or in the Developer Community.


I have been longing for this feature for C# when using the Unity game engine. Unfortunately, the .NET Core-support did not mean that yet. I hope it will come… The survey asking if we want it (https://www.research.net/r/DataBreakpoints1) was from 2017, so it seems that it takes some time though.
This looks really cool, but I’m sad that it’s limited to .NET Core. Why won’t .NET Framework be supported?
Oof…I could *really* use this in .Net Framework right about now! I’ve got a property mysteriously being set, and I can’t catch it, even with setting a function breakpoint on set_PropertyName (which works in other areas).
This is an excellent debugger feature, but I am surprised that it is only comming now – the VAX\VMS debugger already had this feature when I started using it in the mid eighties!