The Visual Studio debugger is a magical beast that can save you loads of time while finding and fixing issues in your application. It is chock-full of tools that can make debugging easier… if you know they exist, and where to find them! Let’s look at 7 lesser known goodies you can use to help you #SuperChargeYourDebugging.
1. Click to Set Next Statement
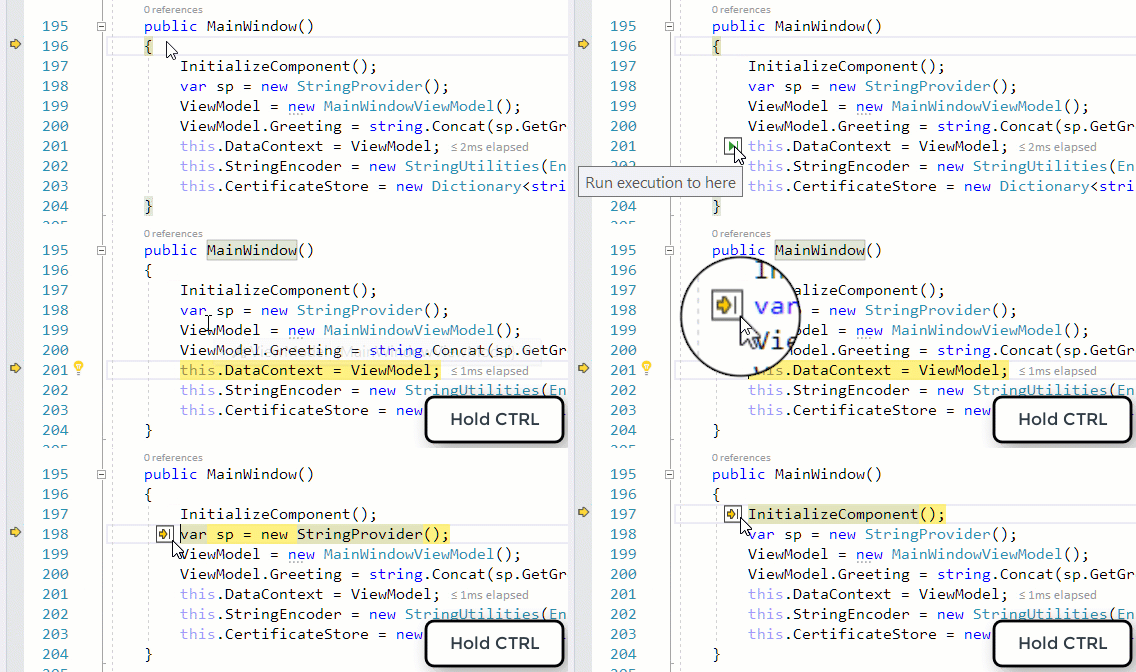
Many of you may know about the context menu item Set Next Statement (Ctrl+Shift+F10) that moves the yellow arrow (the instruction pointer) to the target line of code. You may also know that you grab and drag the yellow arrow up and down in the gutter to move it. What you probably didn’t know is that as of Visual Studio 2017 version 15,3 Preview there is an even easier way to target a line and Set Next Statement.
1. Hover over the line of code where you want to move the yellow arrow.
2. Hold the CTRL key and notice the Run to Click (Run execution to here) glyph changes into the Set Next Statement glyph.
3. Click on that glyph and the yellow arrow will move to that line.
4. This line will be the next statement to execute when taking a step or pressing Continue (F5).
2. Break when a value changes
Have you been in a situation while debugging where you inspect an object’s property at one breakpoint and by the time you get to the next breakpoint that property has changed unexpectedly. You can set a breakpoint on the setter in the class, but this breaks for every instance of the object type! What if you only care about one problematic instance? When debugging C++ code, Data Breakpoints can help you out. If you are debugging managed code, you can use Make Object ID plus a Conditional Breakpoint to narrow your search for the problem area.
- When you get to a breakpoint with the interesting instance right click on the object and select Make Object ID. This gives you a handle to that object in memory, referenced by “$1”.
- Go to the setter of the property you care about and add a condition to the breakpoint, “this == $1”
- Press Continue (F5) and now you will break in the setter when that property changes for that instance.
- Look at the Call Stack and double click on the previous frame. This will take you to the line of code that is changing the property for this specific instance of the object.
Note: The object ID refers to the object’s address in memory and consequently will change with every new debug session. So, if you need to restart debugging, be sure to right click and re-create the object ID. The handle ($1) won’t change, so you can leave your breakpoint as is between debug sessions.
3. Reattach to Process
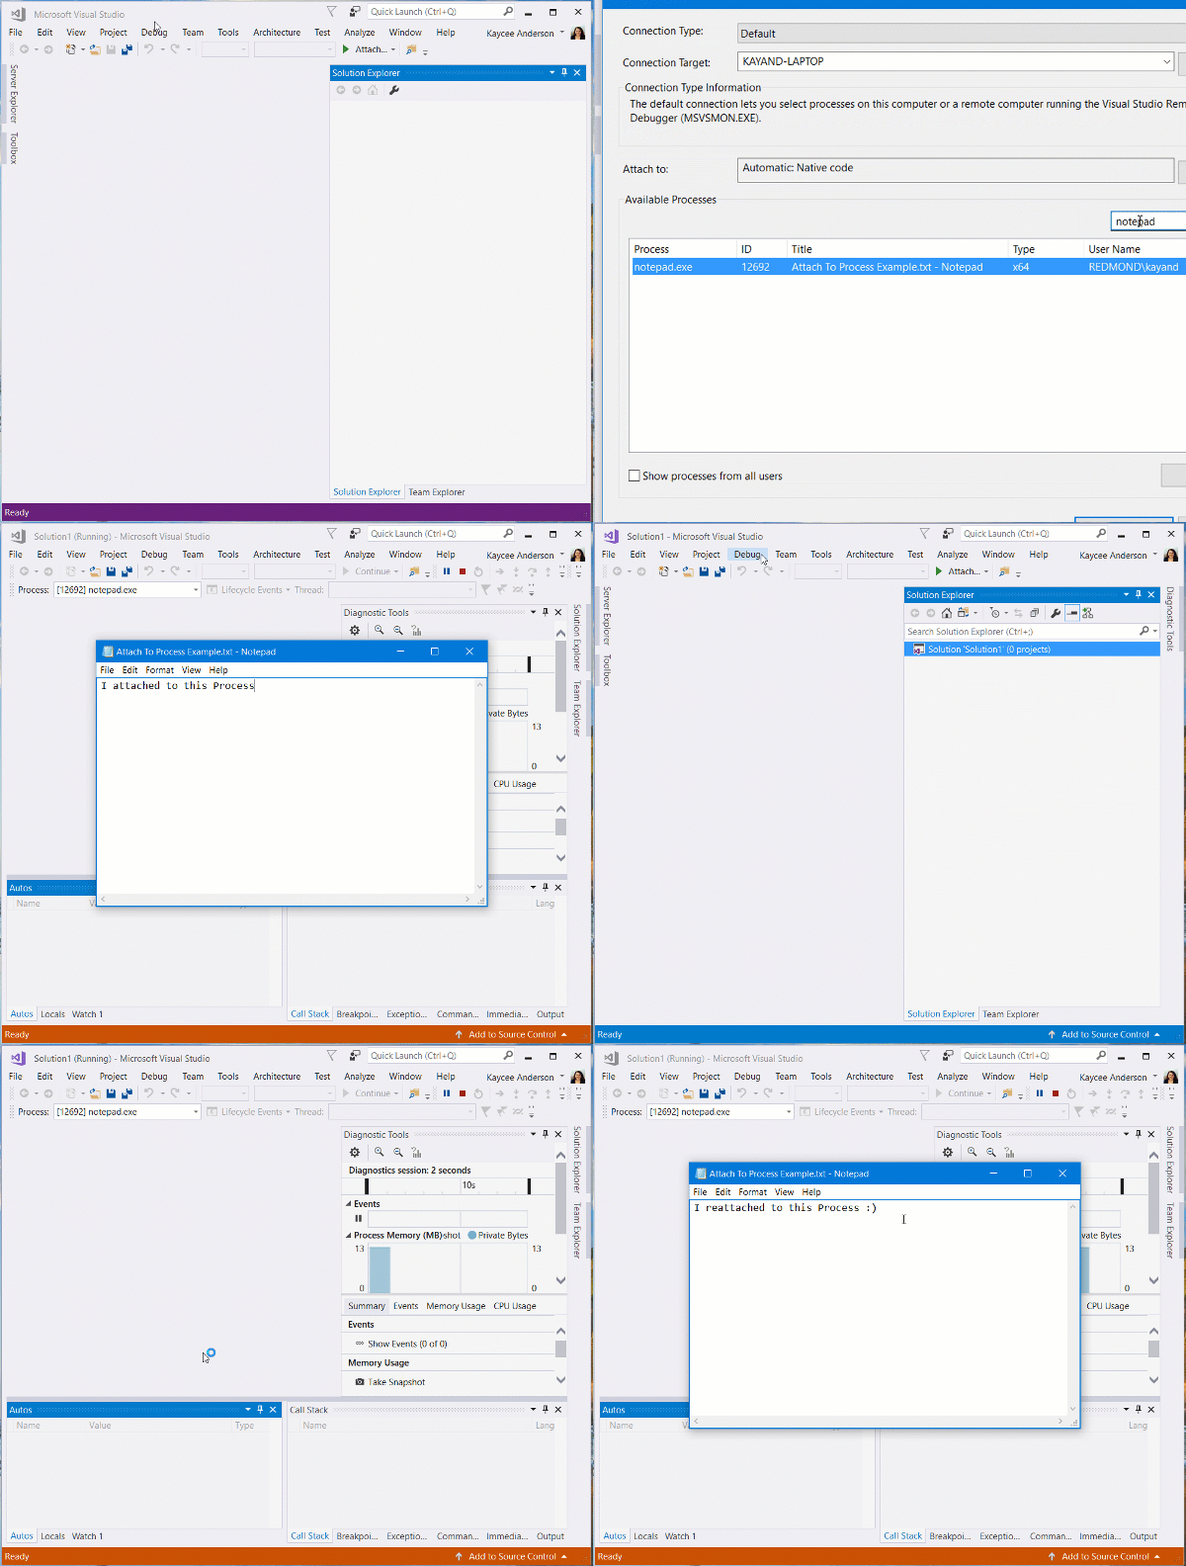
This is a true time-saver introduced in Visual Stuido 2017 that many of you have yet to discover. It is extremely helpful when you are working on a project where you need to use “Attach to Process” but you find yourself consistently attaching to the same thing session after session.
- Start from the Attach to Process dialog (Ctrl+Alt+P) and select the process or processes that you want to debug and click “Attach”.
- When you terminate that debugging session go to the Debug menu on the toolbar.
- Click Reattach to Process or use shortcut key (Shift +Alt+P).
For more in-depth details about Reattach to Process check out this blog post.
4. Show Threads in Source
Debugging a multithreaded application is rarely easy, but when you can see in the editor what lines of code each thread in currently on, it gets a lot better.
- In the debugger toolbar, toggle the button “Show Threads in Source”
- A glyph will appear in the breakpoint gutter next to each line of code where at least one thread is currently stopped.
- Hover over the thread marker icon to see the thread ids and names for all threads currently stopped on that line of code.
- Right click on the thread to see available actions you can perform like freezing and switching the active thread.
Note: This functionality comes with some performance overhead and can feel like it slows down debugging. We recommend turning it off when you aren’t actively using it.
5. Step through one single thread without jumping around
How often are you debugging multithreaded code, when you hit your first breakpoint, take a step, and then suddenly you are stopped with the yellow arrow on another thread? The unexpected behavior comes from the breakpoint still being set and consequently being hit. By default, the debugger will stop on a breakpoint any time it is hit. This means that when you take a step, all threads are allowed to run, and one of your running threads hit this breakpoint before the step completes on your current thread. Next time you get in this situation try this:
- Disable or delete the breakpoint that has been hit by the new thread the debugger switched to.
- Press Continue (F5)
- Observe how your first initial step on that first thread completes and now is the active debugging context.
- Since your breakpoints are deleted or disabled, you can continue stepping on that single thread without interruption.
6. Debug.ListCallStacks -allThreads
When there are lots of threads, there can be lots of call stacks to figure out. You may need to inspect all of them to get a good picture of what state your application is in. You can always see a visual representation of the call stacks for each thread by using the Parallel Stacks window (Debug/Windows/ Parallel Stacks). You can also see a text based, copy/paste-able version of the call stack for each thread using the Command window.
- Open the Command Window (View/Other Windows/Command Window).
- Type “Debug.ListCallStacks – allThreads”
- You can also use the popular WinDBG command “~*k”
- See how each thread is listed with its call stack displayed in the window.
7. Side Effect Free Function Evaluation “, nse”
Have you ever innocently typed an expression into the Watch window or Immediate window, then had to deal with the side effects of a debug session where you changed the state of the application without meaning to? Often this can happen when trying to evaluate an expression that calls a function in your program and it causes side effects (state changes to the program without running the actual application). While this may be okay if you know what functions will be called, what if you’re not sure? Here is a way to evaluate expressions in C# without the risk of side effects corrupting your program.
- You can add “, nse” (stands for “No Side Effects”) after any expression you type into the Watch window or Immediate window.
- This will use a sandbox of sorts that will interpret the expression without causing any side effects.
- If the expression can’t be interpreted and can only be resolved by an evaluation, it will show you an error in the window.
- If you are sure that you want to evaluate it anyway, remove the “, nse” modifier and try again.
Learned Something? Let us know!
What is your favorite lesser known debugging feature? Comment below!
 |
Kaycee Anderson, Program manager, Visual Studio Debugger, and Diagnostics
@KayceeSue
Kaycee is a program manager working on the Visual Studio Debugger. She is passionate about delighting developers with core debugging experiences to help them find and fix issues in their code faster. She wants to help you #SuperChargeYourDebugging. |


Dear KayceeSue,I loved your web page about "7 lesser known hacks for debugging in VS".Please forgive this unsolicited interruption to your day, and I apologize right now for my English accent.I am wondering if there is a way to programmatically (in a Windows.Forms application) determine whether or not any breakpoints are set?The reason I ask is that if the ap. hits a break point with FormWindowState.Maximized and after BringToFront() and TopMost I find myself up a creek without a paddle.I can't even run TaskManager.All I know to do is Alt-Cntrl-Delete, sign off and brace myself for the arduous document recovery...
Thank you for taking the time.