Summary: Microsoft Scripting Guy Ed Wilson talks about looking at the message field in a packet log with Windows PowerShell.
Microsoft Scripting Guy, Ed Wilson, is here. Yesterday I begin analyzing a packet trace log.
Note For more information about setting up and making a packet trace, see Packet Sniffing with PowerShell: Getting Started. For more information about doing basic analytics, see Use PowerShell to Parse Network Log.
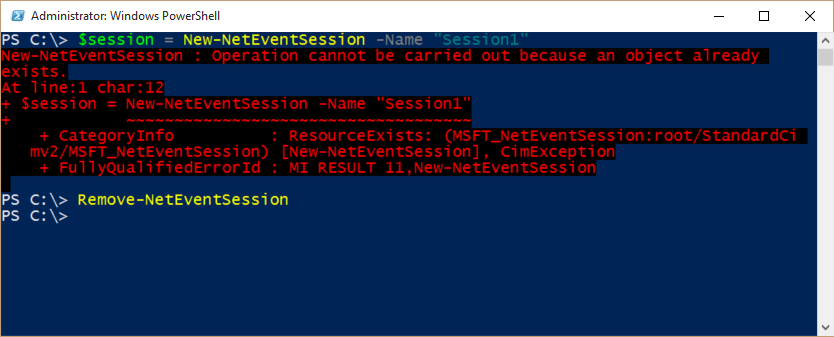
You may be surprised if you have rebooted your computer, logged off and back on, and opened and closed Windows PowerShell. If you go to create a new net event session, and you call it session1 (like I did yesterday), you will get an error message today.
How can that be? Well, obviously Windows PowerShell remembers what you did yesterday when you created the session in the first place. A big red error message appears stating that an object already exists. Well, duh. Obviously an object already exists or it would not be an object.
That is a somewhat ambiguous error to say the least. True, but ambiguous. To clear up the matter, I need to use the Remove-NetEventSession cmdlet. The error message and the solution are shown in the following image:
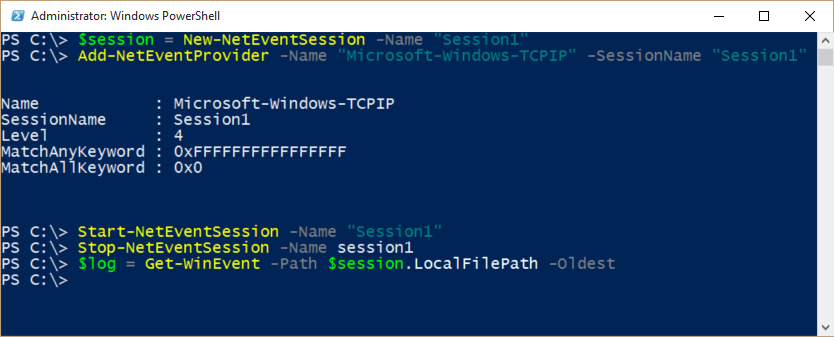
Now I have removed my error, so I can create the session anew, add NetEventProvider, and start the net event session:
$session = New-NetEventSession -Name "Session1"
Add-NetEventProvider -Name "Microsoft-Windows-TCPIP" -SessionName "Session1
Start-NetEventSession -Name "Session1"
Now, I reproduce my problem, and then I stop my net event session:
Stop-NetEventSession -Name session1
I read the contents of the network trace log. I have to specify the –Oldest switch to avoid errors due to the way the log contents are read. This command is shown here:
$log = Get-WinEvent -Path $session.LocalFilePath –Oldest
The following image shows these commands and any associated output.
Now I want to see what timespan is documented by this trace, so I use New-Timespan:
New-TimeSpan -end ($log | select -Last 1).timecreated -start ($log | select -first 1).Timecreated
I can see that it covers 2 minutes and 15 seconds. This might be enough to document my problem. I also want to see how many entries I have. It turns out that I have over 11,000 entries:
PS C:\> $log.Count
11328
Sure is a good thing that Windows PowerShell is great at parsing log files!
Look at the Message field
In the trace log, the basic fields of the log are TimeCreated, ID, LevelDisplayName, and Message. The ID can be a great way to correlate events. But the Message field shows what is going on. To parse this message field, one can use Select-String.
Note Luckily beginning with Windows PowerShell 3.0, PowerShell has what I call an automatic foreach—that is, it will automatically expand a collection of objects and allow me to examine a single property. This is a huge time saving feature, and one of my favorites. I wrote about it in PowerShell Looping: The Automatic Foreach.
All I need to do is access the message property from my collection of 11,000 events stored in the $log variable. I pipe the output to the Select-String cmdlet and do a simple match on the word fail. The command is shown here:
$log.message | Select-String -SimpleMatch 'fail'
The output includes a lot of records. They tend to look like the following:
TCP: connection 0xffffe000577e2430 (local=192.168.0.7:54083
remote=127.0.0.1:443) connect attempt failed with status = {Device Timeout}
The specified I/O operation on %hs was not completed before the time-out period expired.
It appears that there are different connection attempts that are failing with a timeout. Hmmm…how often is this happening? Well, I pipe the output to Measure-Object (measure is an alias):
PS C:\> $log.message | Select-String -SimpleMatch 'fail' | measure
Count : 81
Average :
Sum :
Maximum :
Minimum :
Property :
81 times in a 2 minute time frame. That sounds like it could be bad, and it would certainly explain the slowness of my computer. But what is it really? Well, I need to dive into the message field and see what is really connecting to what, and how many times the connections are failing.
Before Windows PowerShell 5.0, this could have caused me some concern. I would have been falling back to write complicated REGEX patterns, and that would have taken some experimenting to get right. But with Windows PowerShell 5.0, I can parse this in no time at all because I have the ConvertFrom-String cmdlet. Here is the command I use:
$log.message | Select-String -SimpleMatch 'fail' | ConvertFrom-String
The output that comes back is a collection of 27 fields. The default name is p1 – p27, but the doesn't matter because I see that I want P4 (my local IP address and port) and P5 (the remote IP address and port).
As shown here, I also already know the connections are failing with a timeout because that is what I found earlier:
PS C:\> $log.message | Select-String -SimpleMatch 'fail' | ConvertFrom-String
P1 : TCP:
P2 : connection
P3 : -35182904204240
P4 : (local=192.168.0.7:54083
P5 : remote=127.0.0.1:443)
P6 : connect
P7 : attempt
P8 : failed
P9 : with
P10 : status
P11 : =
P12 : {Device
P13 : Timeout}
P14 : The
P15 : specified
P16 : I/O
P17 : operation
P18 : on
P19 : %hs
P20 : was
P21 : not
P22 : completed
P23 : before
P24 : the
P25 : time-out
P26 : period
P27 : expired..
<output truncated>
All I need to is select P4 and P5. This command is shown here:
$log.message | Select-String -SimpleMatch 'fail' | ConvertFrom-String | select p4, p5
Here is the output now:
PS C:\> $log.message | Select-String -SimpleMatch 'fail' | ConvertFrom-String | selec
t p4, p5
P4 P5
— —
(local=192.168.0.7:54083 remote=127.0.0.1:443)
(local=192.168.0.7:54085 remote=127.0.0.2:443)
<output truncated>
I want to dive in and see where I am really having my problem. To do this, I want to group the output. This will show me the actual number of times each connection to each server is failing. The command I use is:
$log.message | Select-String -SimpleMatch 'fail' | ConvertFrom-String | select p4, p5 | group p5 | sort count –Descending
Here is the output:
PS C:\> $log.message | Select-String -SimpleMatch 'fail' | ConvertFrom-String | selec
t p4, p5 | group p5 | sort count -Descending
Count Name Group
—– —- —–
7 remote=127.0.0.1:80) {@{P4=(local=192.168.0.7:54228; P5=remote=127.0….
7 remote=127.0.0.2:… {@{P4=(local=192.168.0.7:54199; P5=remote=127.0….
6 remote=127.0.0.3:80) {@{P4=(local=192.168.0.7:54204; P5=remote=127.0….
<output truncated>
That is all there is to using Windows PowerShell to parse a network trace log. Join me tomorrow when I will talk about more way cool stuff.
I invite you to follow me on Twitter and Facebook. If you have any questions, send email to me at scripter@microsoft.com, or post your questions on the Official Scripting Guys Forum. See you tomorrow. Until then, peace.
Ed Wilson, Microsoft Scripting Guy


0 comments