Summary: Ed Wilson, Microsoft Scripting Guy, talks about using Windows PowerShell to analyze packet trace logs.
Microsoft Scripting Guy, Ed Wilson, is here. Today I want to finish my discussion about analyzing a network trace log that was captured by using the cmdlets from the NetEventPacketCapture module.
Note
- For more information about setting up and making a packet trace, see Packet Sniffing with PowerShell: Getting Started.
- For more information about doing basic analytics, see Use PowerShell to Parse Network Log.
- To learn about converting text to objects and parsing the log, see Packet Sniffing with PowerShell: Looking at Messages.
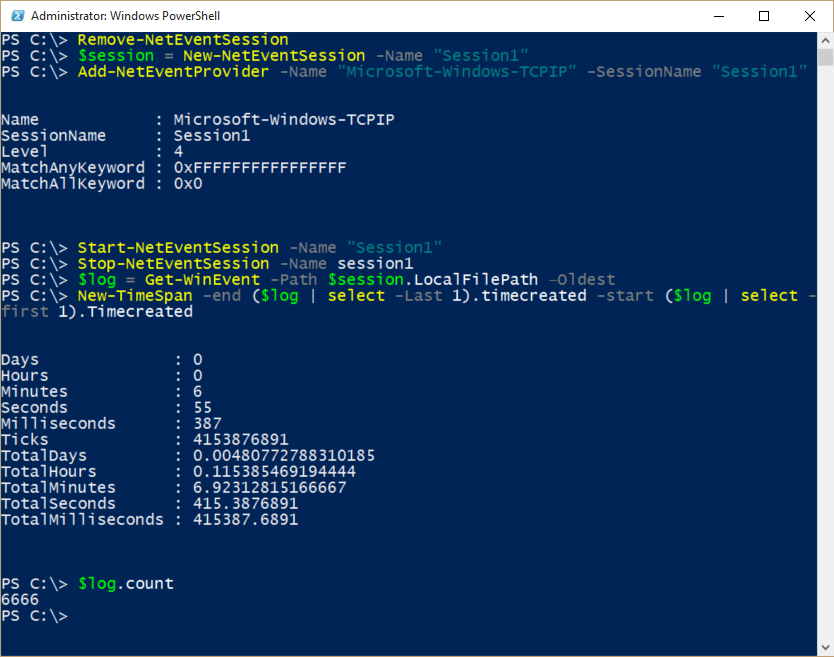
To start my network trace, I need to use the following four commands:
Remove-NetEventSession
$session = New-NetEventSession -Name "Session1"
Add-NetEventProvider -Name "Microsoft-Windows-TCPIP" -SessionName "Session1”
Start-NetEventSession -Name "Session1"
After I have duplicated the problem, I use the Stop-NetEventSession cmdlet:
Stop-NetEventSession -Name session1
I need to read the contents of the network trace log into a variable. I will use the variable to explore my problem and to avoid having to load and to reload the log file. This command is shown here:
$log = Get-WinEvent -Path $session.LocalFilePath –Oldest
Now I want to check the amount of time that is covered by the log:
New-TimeSpan -end ($log | select -Last 1).timecreated -start ($log | select -first 1).Timecreated
It tells me that I have nearly 7 minutes of activity in the log. And by checking the count, it tells me that I have 6,666 events in my log.
Note I must launch Windows PowerShell with elevated permissions to create network trace logs.
The commands and their associated output are shown here:
These are the same commands that I create on a regular basis. I could easily create a function that I call Get-NetworkTrace that would duplicate all of these steps, and perhaps even capture a specific amount of network traffic.
Filter by ID number
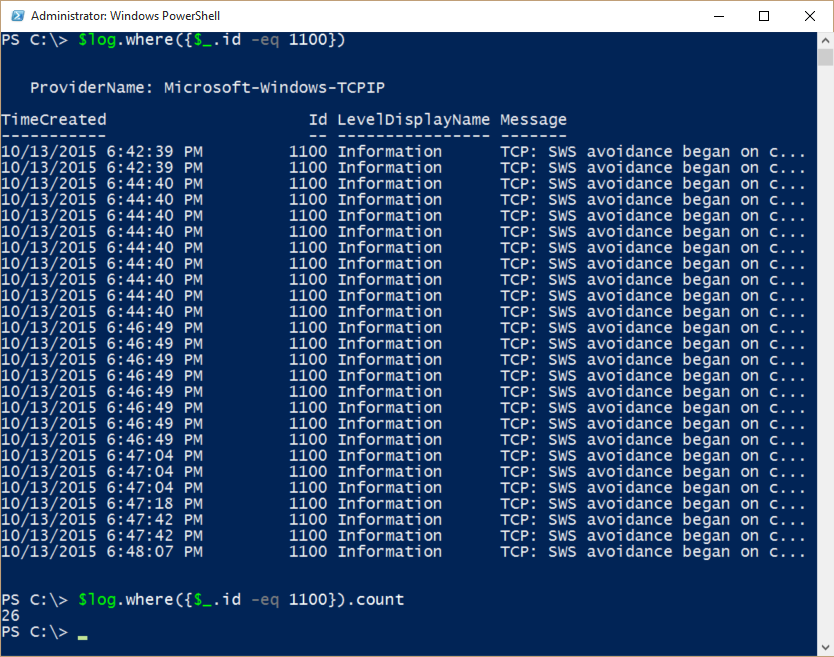
If there is a problem that I am experiencing, and if I know the associated ID number, one of the easiest things to do is to filter by that specific event ID. I can do this by using the where method that was introduced in Windows PowerShell 4.0:
$log.where({$_.id -eq 1100})
If I do not have Windows PowerShell 4.0, I can pipe the output to Where-Object, but this will take a lot more time. It is shown here:
$log | where {$_.id -eq 1100}
The following image shows that there were 26 silly window syndrome avoidance events. Silly window syndrome is when the sliding window size shrinks to the point that network communication is restricted. Windows implements specific algorithms to detect and to correct this issue. When that happens, a silly window syndrome avoidance event is triggered.
There are also a number of retransmissions recorded in the log. I found these by looking for the string retransmit:
PS C:\> $log.message | select-string retransmit | measure
Count : 120
Average :
Sum :
Maximum :
Minimum :
Property :
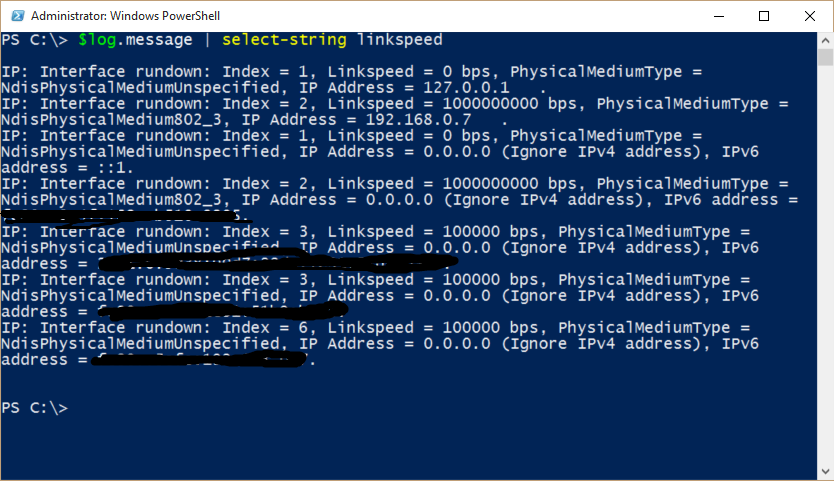
I might want to check for the link speed. I can do this by searching the log for LinkSpeed. Here are command and the results:
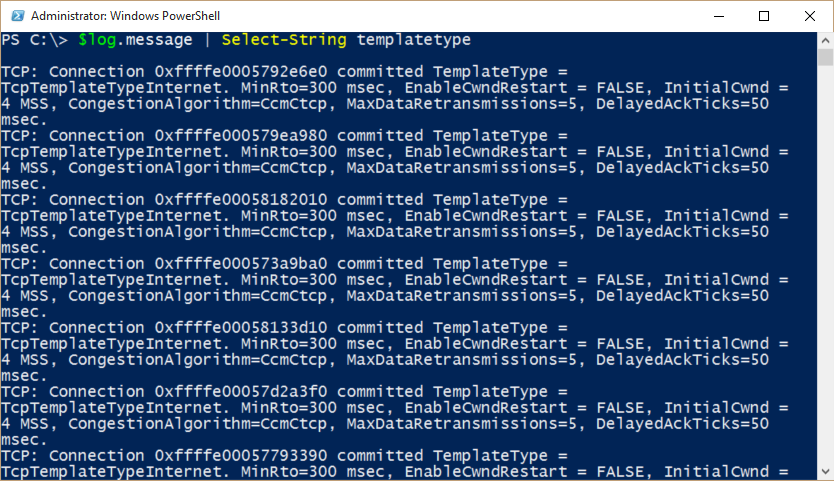
I can also see what type of TCP template is detected:
$log.message | Select-String templatetype
The output is shown here:
That is all there is to using Windows PowerShell to parse packet traces. Join me tomorrow when I will talk about more cool Windows PowerShell stuff.
I invite you to follow me on Twitter and Facebook. If you have any questions, send email to me at scripter@microsoft.com, or post your questions on the Official Scripting Guys Forum. See you tomorrow. Until then, peace.
Ed Wilson, Microsoft Scripting Guy


0 comments