Get some insight into debugging .NET code on non-Windows operating systems with this post from Premier Developer consultants Gustavo Varo and Ben Williams.
I have been working more and more with .NET Core and one question I keep getting from our customers and partners is about the debugging experience when using operating systems other than Windows. It is not a secret to anyone that Windows has an incredible debugging experience, whether you like to use Visual Studio or you like to script your debugging tasks using WinDbg. But for everyone who is not using Windows, missing those tools is, in my opinion, one of the biggest sources of complaints when discussing the debugging experience.
With the introduction of .NET Core, the community got really excited with the possibility of running .NET code either on Linux or Mac, but how could we try to improve the debugging experience on those platforms? Today we will talk a little bit on how we can do that on Linux using the SOS debug extension. That’s correct, the SOS extension is now available on Linux as well.
What is the SOS extension?
The SOS extension is a debugging extension shipped with Windows that allows developers to debug managed code within WinDbg, CDB or NTSD
Remember that when you execute managed binaries, the runtime generates native code that is platform specific. The SOS extension allows you to debug that native code in a “managed way”.
How do I get started with SOS on Linux?
The very first step is to install a debugger. The debugger I will be using is called LLDB. LLDB is very similar to WinDbg and is also the debugger the SOS team has being using, so I have adopted it as my default debugger for Linux.
You can install LLDB from the follow link:
https://lldb.llvm.org/download.html
or you can also install it by running the following command:
sudo apt install lldb-3.5
Once you have lldb installed in your Linux machine, open the Terminal, go to lldb/Ubuntu/bin and launch the debugger by typing the following command on the prompt:
./lldb
Make sure the debugger was launched properly.
You will get the lldb prompt like the one below, if lldb was launched properly.
![]()
Create a .NET Core application …that crashes!
Now let’s create and run our console app on Linux, for that create a new folder and on the Terminal prompt type:
dotnet new
dotnet restore
dotnet run
The result of this operation should be something like this:
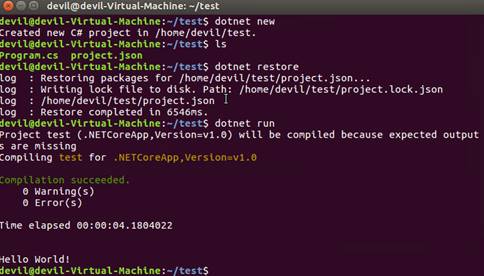
Let’s make our app a little bit more interesting. Open the Program.cs file and change your file like that:
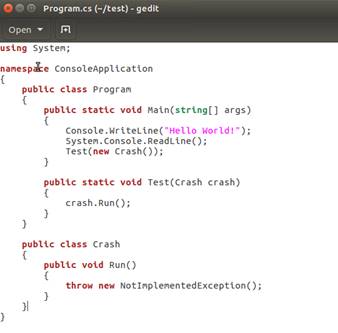
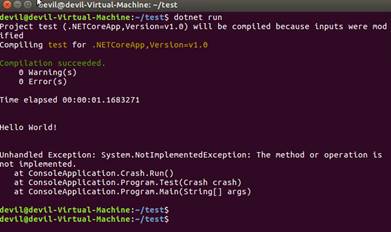
Save the file and run again the app. Remember to press ENTER after you see the Hello World! message.
You should see something like this:
Now it is time to debug it!
Run again the app, but at this time don’t press ENTER after you see the Hello World! Message. Instead open a new Terminal window and get the process list in order to find the process id of the running app. You can do that by running the follow command on the prompt:
ps -ejH

Once you find it, start the debugger and attach the process by entering the following command on lldb:
process attach -p [ProcessId]
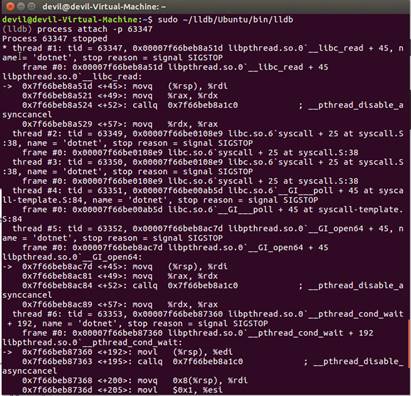
Once attached lldb should present the list of threads. You can also run use the bt command to retrieve the callstack of the current thread, however will be very hard to debug it since you can’t see the stack in a “managed way”
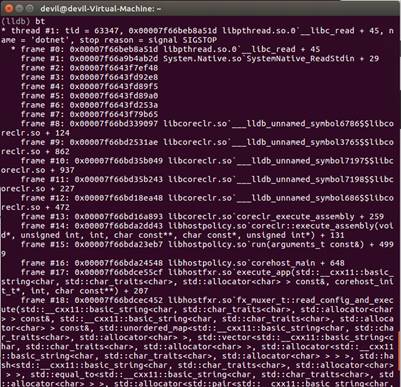
Load the SOS Extension
Loading the SOS extension will make things easier for us.
The first step is to find the extension, you can find it by running the following command:
find /usr/share/dotnet -name libsosplugin.so
![]()
Once you find the location we can load the extension with the follow command:
(lldb) plugin load /usr/share/dotnet/shared/Microsoft.NETCore.App/1.0.1/libsosplugin.so
Alright the extension is loaded and now you can use the managed commands to debug your application.
To test that lets run the clrstack command and now we get a much better view of what is going on.

We can also run other SOS commands like Threads to find out all the manage Threads, to do that we type:
sos Threads

If you want to try out other SOS commands on your own, they are listed in the .NET Framework documentation
That’s it for now guys. Hope this can be useful for you!

A number of screenshots in this post seem… not quite right. I wouldn’t expect this walkthrough to suddenly present me with a browser window showing an Azure portal screen, as an instance. Nor the SDKs download page, nor the “Change Authentication” dialog in Visual Studio.
Thanks for your note Damien. We recently migrated all this content off MSDN and as you noticed some of the images didn’t transfer as they should. I have updated the article with all the original content. If you find any other issues with content on our blog, please let us know… we’ll fix it ASAP. Appreciate your participation in the development community!