
Today we released PIX version 2107.01 which can be downloaded here.
This release is mostly about servicing, including fixing some regressions in 2104.20 that several users hit:
- Shader PDBs not loading
- Missing macro definitions in a shader’s Compile Options view (also causing problems with edit-and-continue)
- Discovery of accesses within dynamically-indexed unbound descriptor ranges (as shown in the pipeline view)
That said, we have a few new “quality-of-life” features in this release:
- Buffer viewer enhancements, including:
- New “globals” buffer, allows you to define structures that are available to all buffers
- Import/export of buffer formats
- Better layout of formats list and buttons, and a splitter for size control
- Buffer format editor is now available in Settings tab
- Show display mode option for GPU Signal/Wait arrows in timeline view
- GPU event list navigation improvements:
- user-curated filter mask
- event path explorer
- search
- GPU event list column statistics
- Quick-navigate drop-down for the event list
- Added theme colors for EventColor indexed colors
- A new Dr PIX experiment to vary MaxCommandCount usage with timing data
- A new warning about invalid root descriptors
- New Storage Device Bandwidth Counters
-
Added support for debugging x64 applications on ARM64 devices
- The Metrics View in PIX Timing Captures now includes bandwidth counters for each storage device.
- These new counters make it easier to optimize file io patterns.
User-Curated Filter Masks
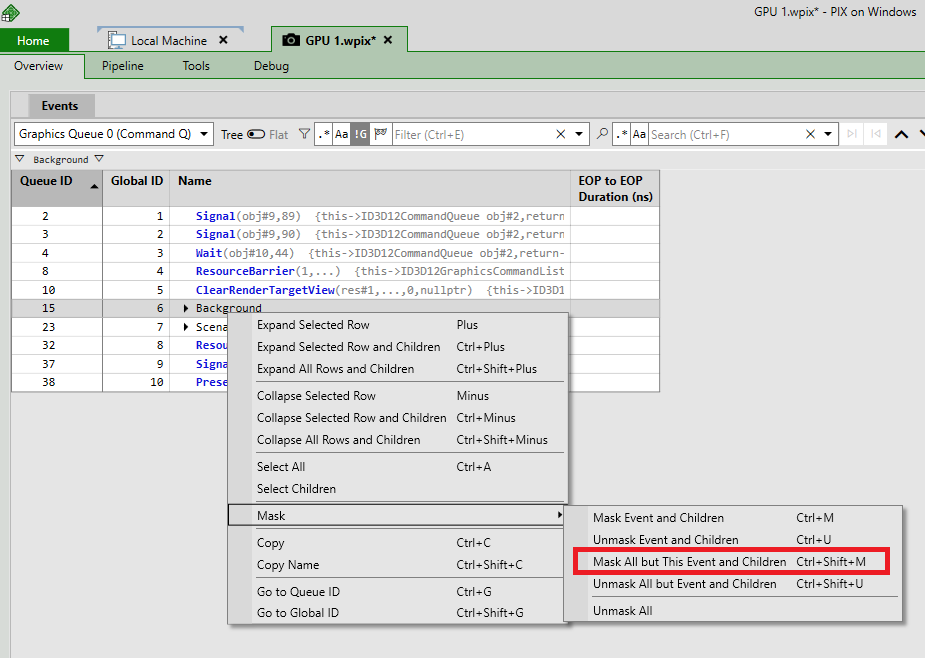
You can now focus on subsets of the GPU event list by using “filter masks”. Filter masks allow you to select and hide large or small sections of the event list, allowing for much easier navigation between distant events. Note that masked events still contribute to the playback, so expect no changes to any resources or timings etc., with the exception of column statistics discussed below. For example, you can mask all but a single node of PIX markers like this:
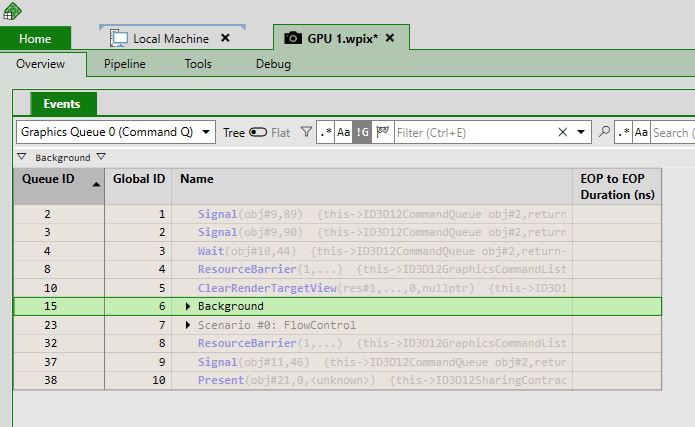
…which has this effect:
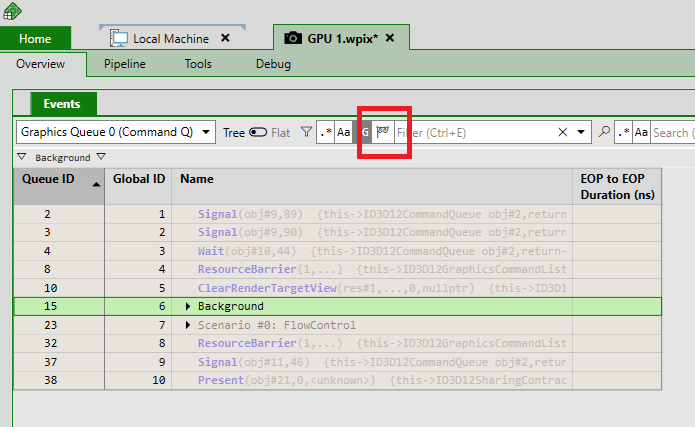
Now you can hide the masked events by clicking the “Exclude masked events” flag highlighted here:
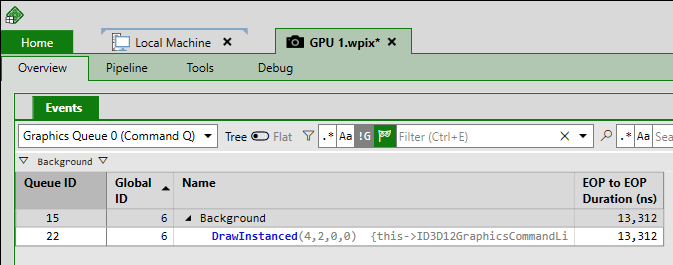
with this result:
Column Statistics
You can now view a few simple stats about counters shown in the event list. If we collect timing data for a trace and turn on column statistics (the new button highlighted in red here), the new statistics (highlighted in yellow) panel will appear.
Any filter or mask setting will affect which events contribute to the stats. The stats will only reflect the unmasked events, whenever the “Exclude masked events” button (blue) is active. Anything you can’t see does not contribute to the stats.
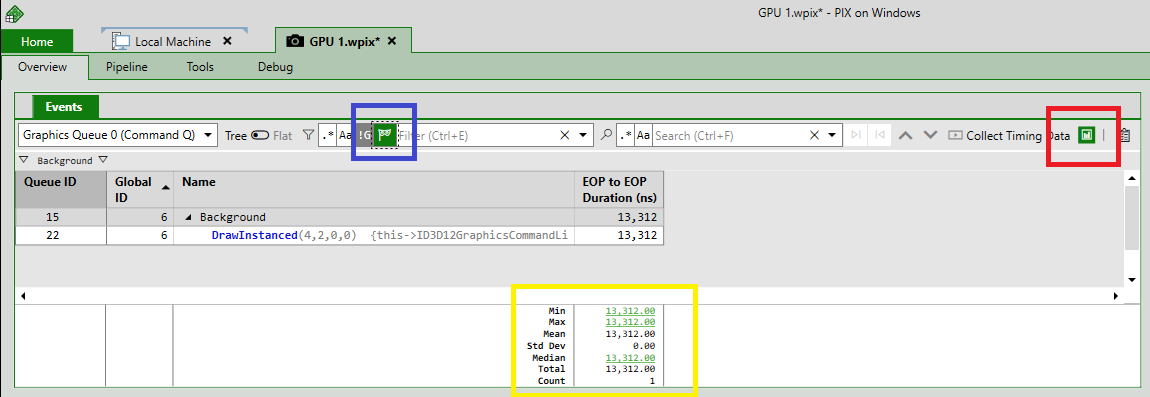
Note that Wait events tend to dominate the timing statistics, but filtering is an ideal mechanism for excluding those waits if you so choose.
Event List Searching
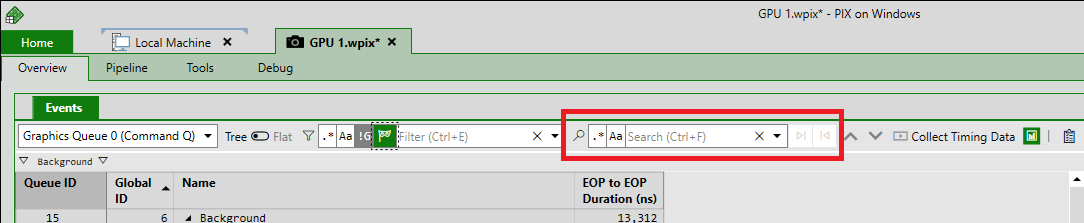
In addition to the existing filter edit-box, a new search edit-box has been added that lets you cycle through matches to your search string without hiding any other events. Highlighted here in red:
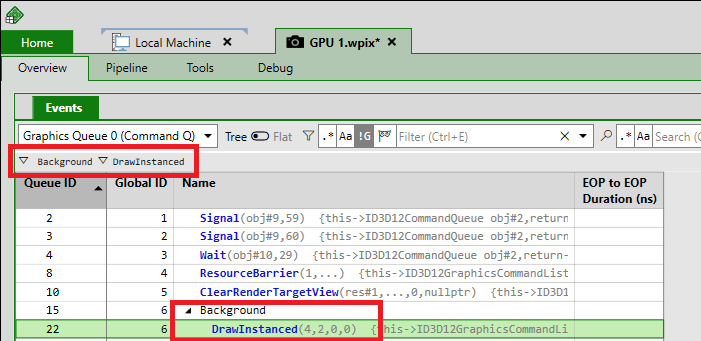
Event Path Explorer
The event list is typically a tree of PIX events and GPU activity, and it can be hard to navigate quickly. (If your event list isn’t a tree of PIX events, learn how to make it one here.) There is now a drop-down explorer that will show up whenever the top level of the event list tree has a manageable number of entries (fewer than around 200). At first, only the one drop-down will show, from which you can select any top-level event or event category. If you select such a category, a drop-down for the next level of events will appear. Like so:
Bug Fixes:
- Fix graph bar legend sometimes being empty
- Fix crash when viewing Vertex Buffers at the IA stage
- Handle signed-int mesh shader output in pipeline view visualizer
- Add support for HLSL macro definitions without values
- Fix sizes of array resources, clarify that sizes are only estimates
- Fix error message when trying to view GS/tessellation shader output
- Fix capture/replay of apps that use >=2GB default heap buffer
- Several dark theme fixes
- Fix regressions with:
- -Shader PDB path discovery
- -Missing macro definitions in shader’s Compile Options view
- -Discovery of dynamically-accessed resources for unbound descriptor ranges
- Fix occupancy graph when timeline changes
- Perf optimization for DXIL/DXBC colorizer
- Fix handling of UpdateTileMappings when given null region sizes
- Fix off-by-one in buffer viewer
- Fix leaking of temporary files
0 comments