
The 2107.01 release of PIX on Windows adds drive bandwidth counters to the Metrics view in Timing Captures. These new counters, along with the existing drive utilization counters and the ability to view data on all file accesses, helps give you a clear picture of how file io is impacting title performance.
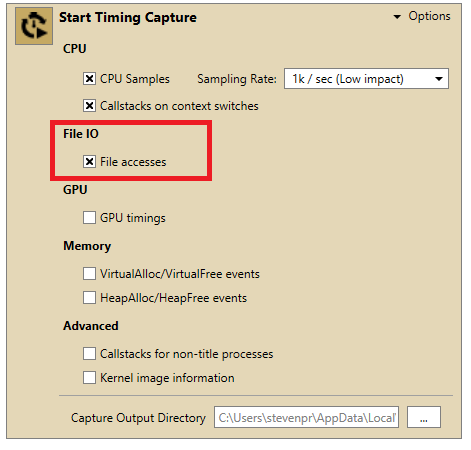
To collect the counters and the data on file accesses, select the File accesses checkbox before starting the capture.
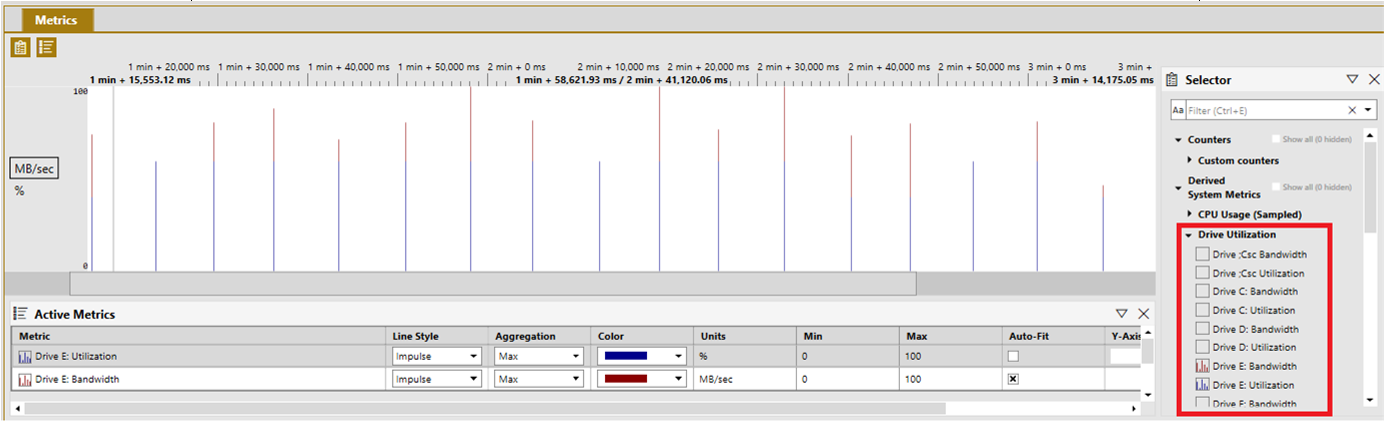
The drive utilization and bandwidth counters can be found under the Derived System Metrics/Drive Utilization node in the Metrics View Selector Panel. Bandwidth and utilization counters are provided for each storage device in your PC.
As described in Analyzing Win32 File IO Performance, file io data also appears in the:
- Disk lanes in the Timeline view
- Range Details view when File IO events is selected from the Items to Show dropdown
- Element Details view when a file access is selected in either the Timeline or the Range Details view
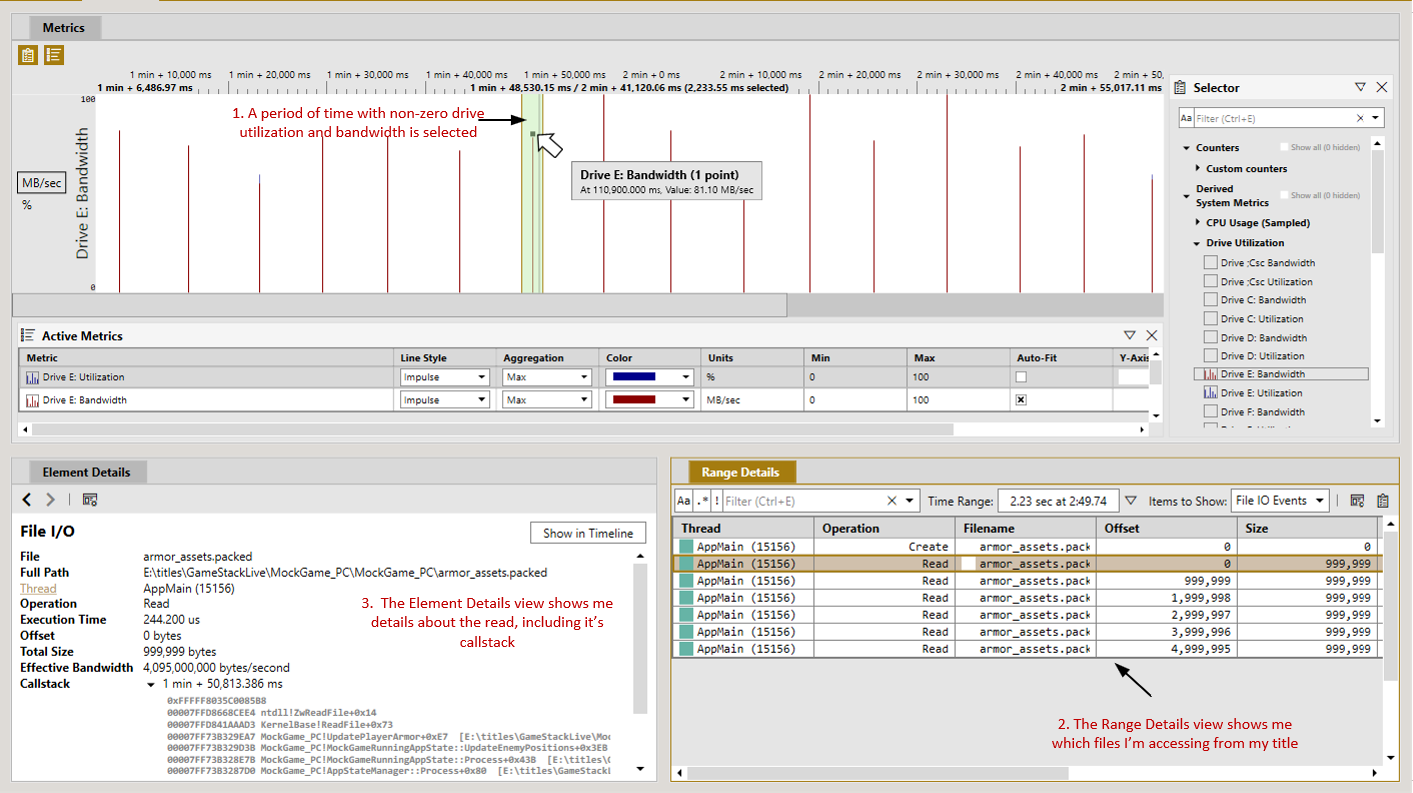
The integration between views in PIX makes it easy to draw correlations between the various pieces of file io data. To illustrate, I’ve created a custom layout comprised of a Metrics view, a Range Details view, and an Element Details view. The Range Details view is configured to display data corresponding to the selected time range in the Metrics view.
In the following picture, I’ve selected a period of time in the Metrics view corresponding to spikes in drive utilization and bandwidth. By selecting File IO Events from the Items to Show dropdown in Range Details, I can see the set of file accesses made by my title during that period of time. Selecting an individual read populates the Element Details view with details about that read, including the callstack.
Going one step further, clicking the Show in Timeline button in the Element Details view will scroll the Timeline to the point in time in which that read occurred. By viewing my main thread and my storage drive next each other, I can see what code was executing in my title at the time my file access occurred.

As always, use the feedback button in the upper right corner of the PIX UI to report bugs or request feature updates.
Steven.
0 comments