
Today we released PIX 1704.27 beta. New in this release:
- PIX warnings can now automatically detect some common but inefficient D3D12 usage patterns
- First couple of Dr. PIX queries are now available on Windows
- CPU hotpath analysis in timing captures
- Create sections of your package layout file from File IO captures
- Merge multiple traces into a single analysis in File IO captures
- Added support for new D3D APIs introduced with Windows 10 Creators Update (ID3D12Device2, ID3D12GraphicsCommandList1)
- Fixed bug that was preventing PIX from displaying GPU shader disassembly
- Rendertarget visualizer robustness improvements
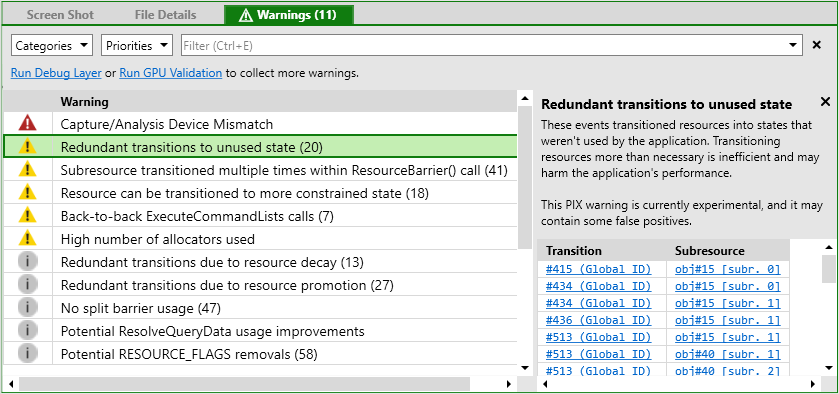
Warnings
New GPU capture warnings are available in the Warnings pane. To analyze a capture for them, click on Collect Experimental Warnings.
Each new warning will be marked experimental until we build up confidence that it is working reliably and not reporting too much noise. We would greatly appreciate feedback about whether useful warnings were reported for your title, any false positives, suggestions for other things you would like PIX to warn about, etc.
Warnings added in this release are:
- Redundant transitions to unused state
- Resource can be transitioned to more constrained state
- Unnecessary DEPTH_WRITE to DEPTH_READ transitions
- Subresource transitioned multiple times within ResourceBarrier() call
- Redundant resource transitions due to resource decay or promotion
- Split Barrier recommendations
- Various other resource barrier warnings (e.g. consecutive calls, potentially incorrect)
- Back-to-back ExecuteCommandLists calls
- Command allocator usage warnings
- Various SetPipelineState warnings (e.g. unused, already set)
- Various D3D12_RESOURCE_FLAGS recommendations (e.g. add DENY_SHADER_RESOURCE)
- ResolveQueryData usage recommendations
Dr. PIX
Dr. PIX is a long-standing feature of PIX on Xbox. It provides a set of queries which analyze GPU workloads in different ways, measuring statistics and seeing how performance is affected by different ways of modifying the workload. In this release we have enabled Dr. PIX on Windows for the first time, initially supporting just a couple of queries. We will be adding more over time, and would love to hear from you if there are specific things you would like us to prioritize here.
Dr. PIX is accessed in the Tools tab after opening a GPU capture. It will analyze only the selected region of the event list, or the entire capture if nothing is selected. To repeat the analysis on a different part of your capture, change the event list selection, then click the Run Query button inside Dr. PIX.
The Basic Information page measures the GPU time of the selected workload, and compares this against two modified versions of that workload:
- Only 1 pixel changes viewport sizes to 1×1, thus removing almost all pixel shading work and framebuffer/depth writes. The resulting performance improvement indicates how much the workload was bottlenecked by pixel fill work.
- Disable MSAA removes any use of multisampling. The resulting performance improvement indicates how much the workload was bottlenecked by MSAA overheads.

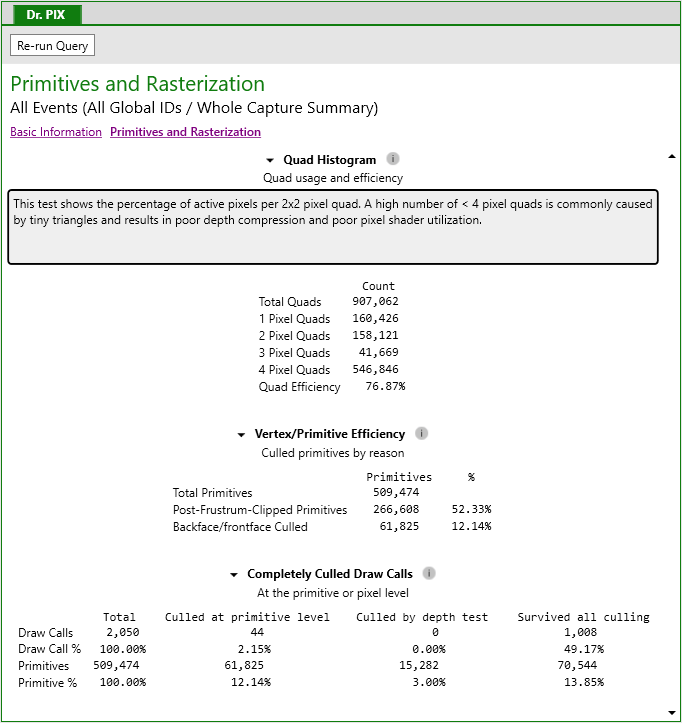
The Primitives and Rasterization page measures how many 2×2 pixel quads were fully vs. partially covered by geometry during triangle rasterization, and how many primitives were culled at different parts of the rendering pipeline:
CPU hotpath analysis in timing captures
Timing captures now include an analysis that identifies the set of events that represents the hotpath in terms of CPU time for a frame. Reducing the time taken by this set of events will have the most direct impact on frame time from a CPU perspective. You must select “Compute Hot Path for PC Timing Captures” to use this feature.
Create sections of your package layout file from File IO captures
After profiling the startup of your title or the loading of a level, you can use the Usage tab to determine the set of files that belong in that content group of your package layout. Once those files are identified, the File IO profiler can now generate the XML that defines that content group. This section of XML can then be pasted into your layout file.
Merge multiple traces into a single analysis in File IO captures
The Usage tab in File IO captures now includes the ability to add existing traces to the file usage analysis. The ability to merge multiple traces in this way enables you to get a more complete picture of each file’s usage. It’s common to have different portions of an asset file touched by different playthroughs of a given level. Merging the data from multiple play-throughs provides a more accurate analysis of the set of data that is required for a given level.
0 comments