The 2201.24 version of PIX on Windows includes a new feature that uses the CPU context switch data collected during a Timing Capture to compute the critical path for a selected PIX event. The critical path is the series of events and thread dependencies that, if shortened, would reduce the overall duration of the selected event.
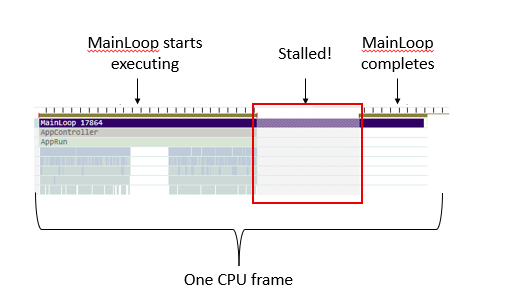
As an example, consider the following PIX event named MainLoop 17864. This event represents one frame of CPU time. In this frame, we can see where execution begins and ends, as represented by the dark blue boxes. However, there is also a significant portion of the frame drawn in a dim hatched color. This period of time represents a stall, or a period of time in which our main thread is not running.
If we can reduce, or eliminate this time altogether, we can reduce the overall duration of the frame. This is where critical path analysis comes in.
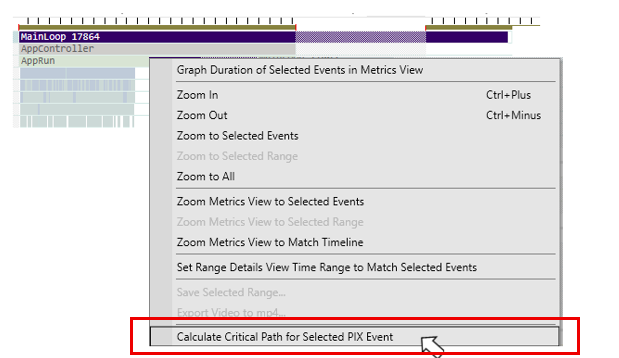
To compute the critical path, right click on the event and select Calculate Critical Path for Selected PIX event from the context menu.
The critical path is displayed in a new lane in the Timeline named “Critical path” followed by the event name. As before, we can see the periods of time at the beginning and the end of the frame when our main thread is executing. But now, the shaded area representing the stall is filled in with information about the events that were running during the stall, and therefore accounted for the overall stalled time.
The change in color of the thread indicator line during the stall from peach, to green to orange indicates that there are three different threads running during this time.
So now that we’ve seen what’s running, let’s look at why those events ran, which resulted in this long stall.
We’ll start by focusing on the transition from our main thread to the first thread that runs during the stall. Clicking on the vertical red line at the point in time when our main thread stopped running causes a dependency arrow to be drawn. This arrow indicates there is a direct dependency between these two threads.
Tooltips can be used to understand why the dependency exists. Hovering over the new thread displays a tooltip that describes the reason for the dependency. Specifically, the tooltip shows that the Loader thread started running because it was readied by the AppMain thread.
The dependency between the Loader thread and AppMain is one of the reasons for the stall, but it is not the only reason. Two additional threads ran during the time that AppMain was stalled, the thread that ran a series of TaskWrapper events and the thread that ran an event named DoneWorking.
These two threads are unrelated, that is, there is no direct dependency between them. However, the fact that one follows after the other in the timeline means that these events are executing in sequence. But if they’re not dependent on each other, why can’t they run in parallel, thereby reducing the time of our stall?
By hovering over these events, tooltips are displayed that provides the answer. In this case, the two threads were both assigned to the same core (Core 4), and also had the same priority, so core contention is the reason these two events ran sequentially. One way to fix this is to assign these threads to different CPU cores to eliminate this contention.
Analyzing additional context switches and readying events (as represented by the vertical red lines), would show that both the WorkerH1 and Worker threads were readied by the Loader thread, giving us a complete picture of what caused the stall. To summarize:
- AppMain readied the Loader thread. This caused AppMain to stop running.
- The Loader thread then readied WorkerH1 and Worker
- WorkerH1 and Worker further lengthened the stall because they ran on the same CPU core
- AppMain had to wait for WorkerH1 and Worker to finish before resuming execution.
A more complete description of the critical path feature can be found on the XYZ documentation page.
Steven.


0 comments