
Introduction
In the last blog post, we introduced the cross platform open-source .NET Core Microsoft-Performance-Tools-Linux-Android tooling. Recently, we just released version 1.2 adding Perfetto support, which we will cover here.
![]()
Perfetto is Google’s open-source tracing ecosystem covering Linux kernel tracing (and user-mode) and built into Android. Perfetto is best-in-class for Android tracing. The Perfetto ecosystem covers System Profiling, In-App Tracing, Trace Viewer, and Trace Analysis.
The Perfetto ecosystem is Google’s equivalent of the Microsoft Event Tracing for Windows (ETW) ecosystem. We worked with Google to complete their vision of making Perfetto trace processor truly available cross platform, including now on Windows!
With this trace processor support in place, we were able to add value building on top of this great core, to create the Perfetto Microsoft-Performance-Tools-Linux-Android tooling. Among other things, the tooling newly exposes the Perfetto trace processor via .NET Core & C#, does unique post-processing and analysis, and optionally exposes the data to Windows Performance Analyzer (WPA).
In the rest of this blog post, we will walk you through analyzing a simple example trace on Android Open Source Project (AOSP) 12. I will give you a quick tour to get started capturing & analyzing a scenario, otherwise this blog post would get too long.
Android 12, just recently released, has some exciting new trace collection features that devs will love! We have found these similar tracing capture features quite useful for Windows analysis.
- CPU Sampling /w callstacks to see at the exact function level of detail what code is executing on the CPU
- CPU Scheduling Wakeup and latency analysis allowing you to see quickly the longest single or cumulative latency delays between threads. E.g. Thread was blocked for x ms by and was woken up (alerted) by this other process/thread.
If you take a trace on an older Android OS, such as Android 11+ / Q+, then you still get great tracing such as: CPU, GPU, Power, Memory, Android Apps & Svcs, and Chrome. See record new trace.
In this post we will use the following tools and will walk through each of them
- Android Studio /w Android 12 target
- Android Debug Bridge (adb)
- Microsoft-Performance-Tools-Linux-Android
- Windows Performance Analyzer (Preview)
Perfetto – Trace Capture
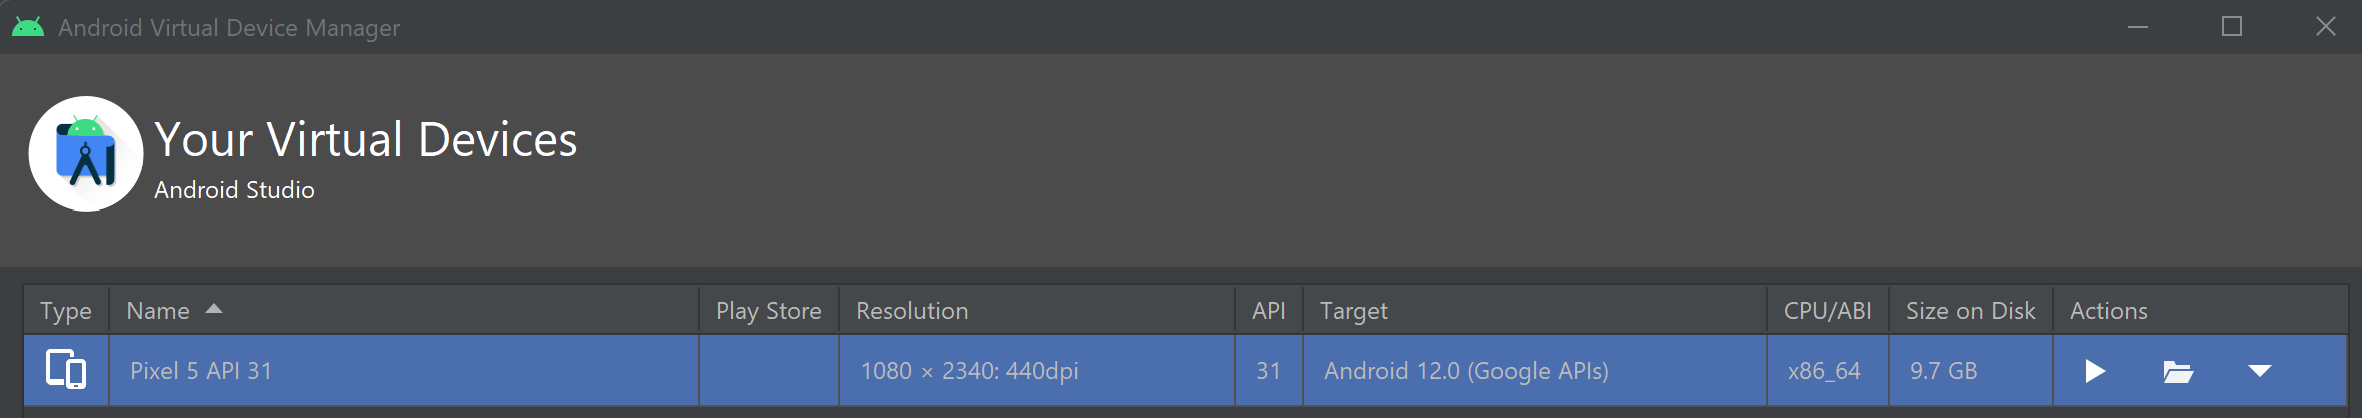
- First off, we will need a target device, real or virtual, to capture a trace on. So that anyone can follow along on multiple OSes, we will be using Android Studio and an Android 12 target in Android Virtual Device Manager. Once the device image is downloaded you should see something like this
- Any project which gets the VM to run should be good, but I chose the Primary/Detail Flow template in Android Studio
- I hit ‘Run app’ and the Android Emulator running Android 12 starts and launches the example app. After hitting the launcher home button, we are back on the home screen ready to start a trace and launch a scenario.
- In general, with tracing you will need to decide on what scenario you are trying to capture and then somewhat customize the tracing to be appropriate to that scenario.
- I decided for this scenario that I will simply capture Chrome launch from the home screen.
- There are various methods to capture tracing on Android documented here. To get started faster capturing a trace, I am a fan of the trace capture GUIs; of which there are at least two
- On-Device Developer Options Debugging -> System Tracing (Record system activity and analyzer it later to improve performance).
- Under System Tracing you can choose Tracing Categories and record a trace. Traces will be recorded under /data/misc/perfetto-traces/, and can be pulled off a device with ‘adb pull’
- If you do not need advanced tracing configs, this works well say for the current version of Windows Subsystem for Android (WSA), where we can simply pick categories that we want to trace. Available via the WSA Settings app -> Manage developer settings
- Perfetto Record Trace GUI, which supports generating trace configs and connecting over USB to a device. We will use the GUI to get a trace config. We will not connect over USB since this a local emulator.
- On-Device Developer Options Debugging -> System Tracing (Record system activity and analyzer it later to improve performance).
- Since we want to capture CPU Sampling, this is currently an advanced configuration that is not yet fully supported by the Perfetto Record Trace GUI. Therefore, we will use an advanced and customized configuration, but start with the GUI; in order to make our life easier
- I do like to start easy with a base configuration applicable to the scenario and enabled by the GUI. I picked these settings under Probes:
- CPU
- Scheduling Details
- CPU Frequency and idle states
- GPU
- GPU Frequency
- GPU Memory
- Power
- Battery drain & power rails
- Memory
- Kernel meminfo
- Low memory killer
- Per process stats
- Virtual memory stats
- Android apps & svcs
- Event log (logcat)
- Chrome (I am only tracing Chrome because it is applicable to this scenario)
- Task scheduling
- Web content rendering, layout and compositing
- UI rendering & surface compositing
- Input events
- Navigation & Loading
- CPU
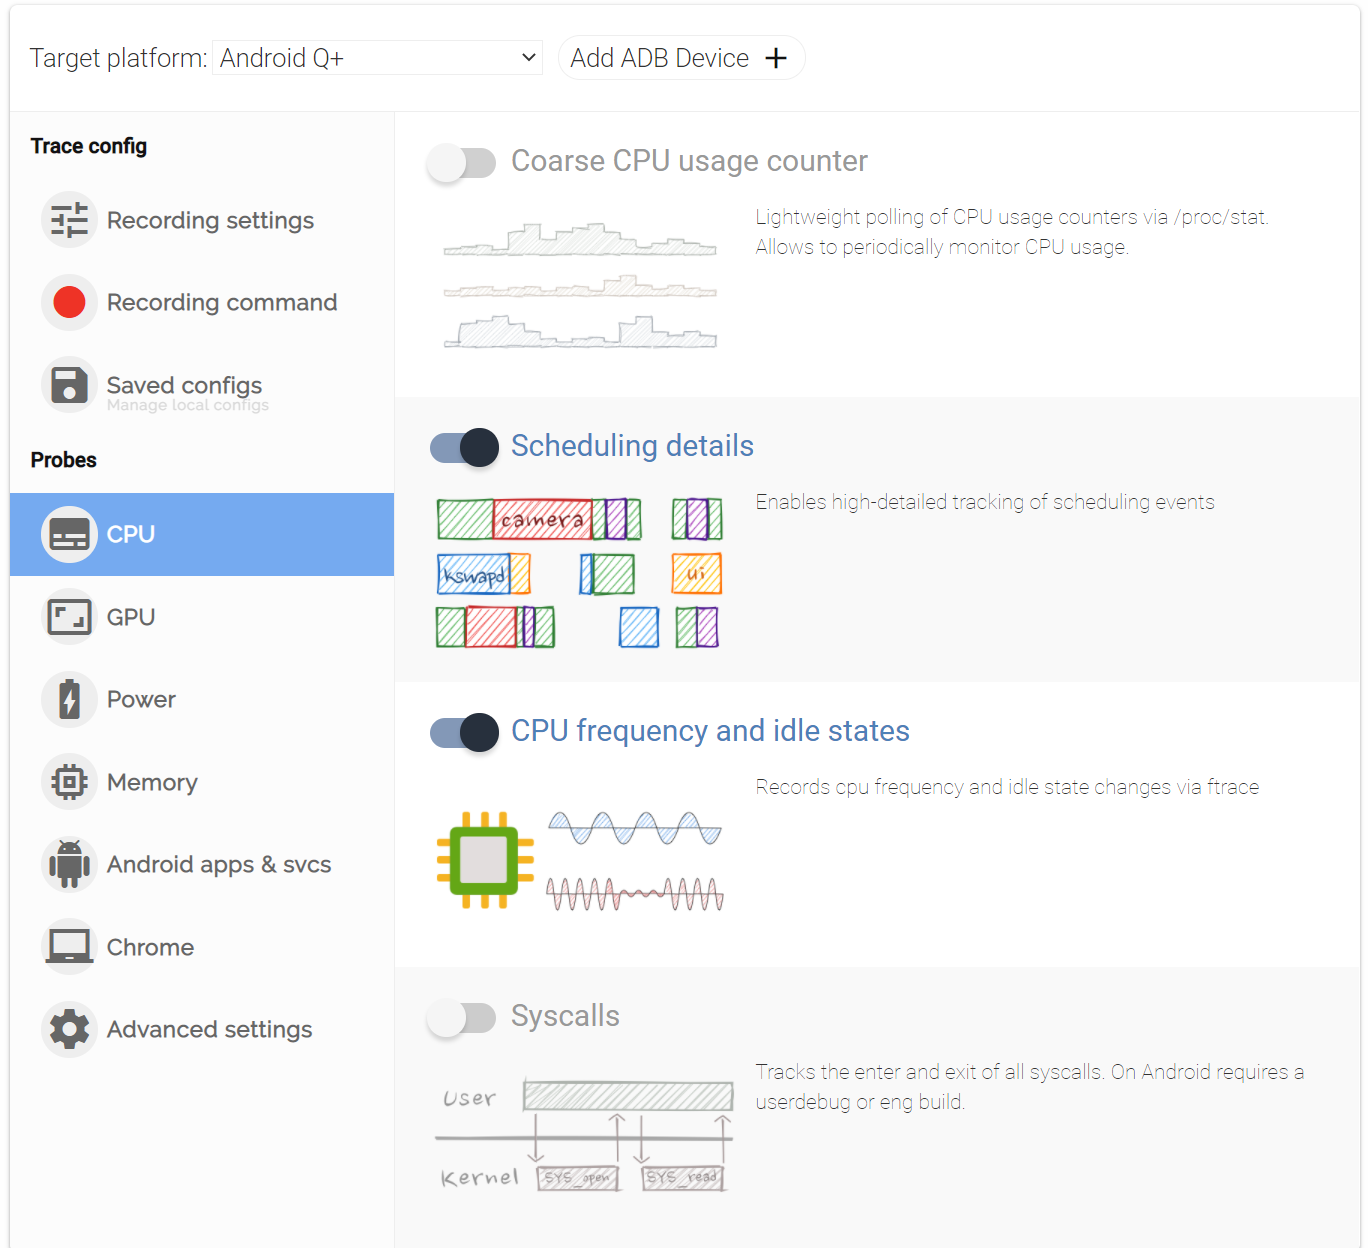
Figure 2 – Perfetto Record UI – CPU Probes
- Under ‘Recording settings’ I increased the ‘Max duration’ from 10s to 1m.
- From here you can choose ‘Recording Command’ to get the current Perfetto recording configuration.
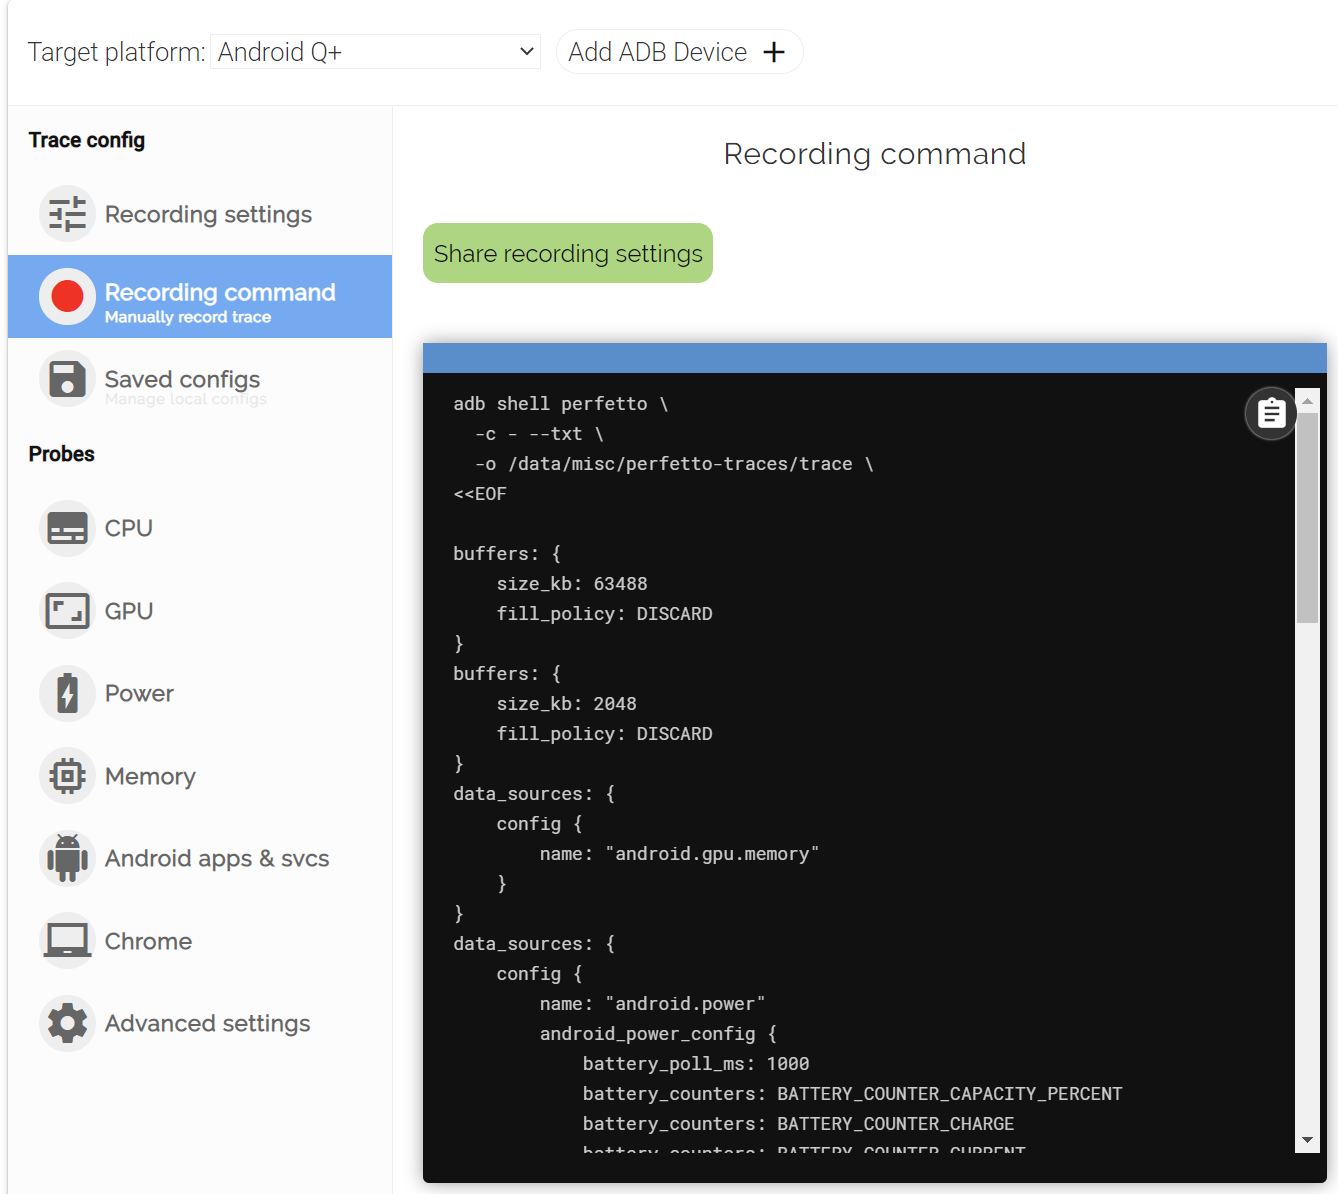
Figure 3 – Perfetto UI – Recording command
- Copy this into a text editor as we will be adding a bit of custom configuration. Only keep the text between the EOFs. I have not found the adb cmd as-is, to work reliably.
- Near the end of the file, but before final duration_ms config, I added a configuration of CPU Sampling every ~1ms of the entire system. Freqency is set to 1000Hz = ~1/1000 or ~1ms. See PerfEventConfig & PerfEventConfig.CallstackSampling for full syntax
data_sources: {
    config {
        name: "linux.perf"
        perf_event_config {
        timebase {
            frequency: 1000
        }
        callstack_sampling {
            kernel_frames: true
        }
        }
    }
}
- Save the advanced tracing config as the filename perfetto_trace_config.
- To execute the advanced tracing and transfer resultant trace file off device we need to download/use Android Debug Bridge (adb).
- With the device running and adb downloaded, list the devices
-
adb devices
-
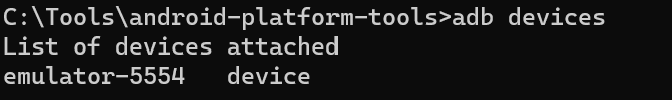
-
- If you don’t see your device present, you can use ‘adb connect’
- Upload the tracing configuration to the device. Note: You can add ‘-s DEVICE_NAME’ if you have multiple devices
-
adb push perfetto_trace_config /data/local/tmp
-
- Connect to the shell
-
adb shell
-

- Inside the adb shell, start tracing with the advanced tracing command
-
cat /data/local/tmp/perfetto_trace_config | perfetto -o /data/misc/perfetto-traces/perfetto_trace.pftrace --txt -c –
- Tracing will now start.
-
![]()
- Now we are ready to start capturing our scenario. Execute a scenario you want to capture a trace for. For this example, I will simply capture Chrome launch from the home screen.
- Click on the Chrome icon in the Android Emulator
- Once complete with executing the scenario, stop the trace with Ctrl-C
- Exit the Shell and transfer/pull the trace off the device
-
exit
-
adb pull /data/misc/perfetto-traces/perfetto_trace.pftrace c:\temp
-
Trace Analysis with Microsoft-Performance-Tools-Linux-Android and WPA
- We will be using WPA (Preview) UI for the rest of the analysis and screenshots, so install it from the Microsoft Store.
- Note: Older versions of WPA are not compatible with the SDK and the toolkit
- Download the Microsoft-Performance-Tools-Linux-Android 1.2 toolset (or later) from GitHub releases
- Extract the zip file and navigate to Microsoft-Performance-Tools-Linux-Android\Launcher\Windows
- Given the release came from the Internet, you may need to unblock the .bat or .ps1 file using right-click properties unblock
- Double-click LaunchWpaPerfToolsLinuxAndroid.bat which will launch the WPA UI pre-configured to load the plugins
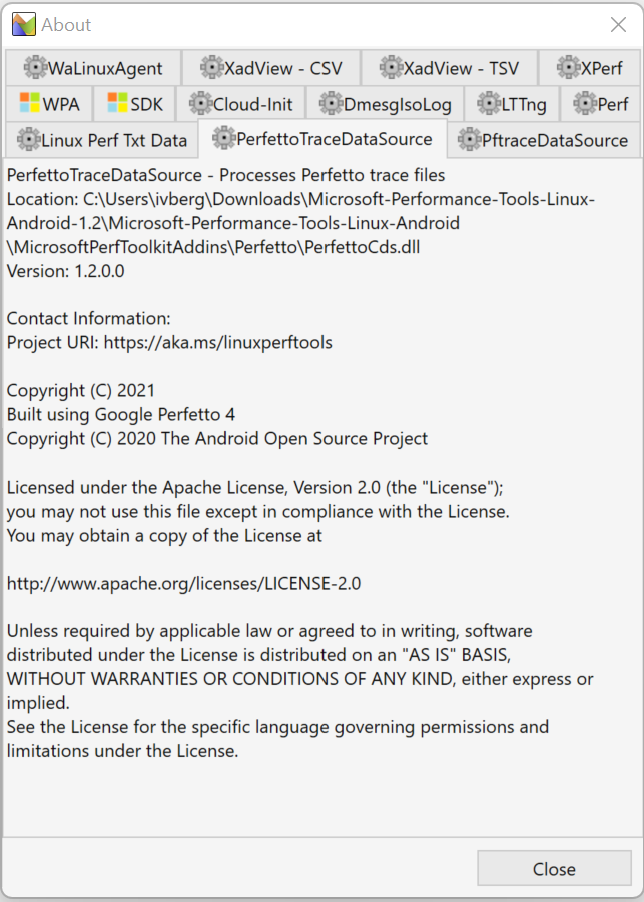
- Once WPA is loaded, click Help -> About and you should see a bunch of plugins pre-loaded including PerfettoTraceDataSource and PftraceDataSource
- From here you should be able to open Perfetto trace files from the File -> Open menu
- Let’s open our trace we already pulled from the device – perfetto_trace.pftrace
- Once open the toolset will show a progress bar loading the trace and display tables once the trace load is complete
- Under the hood, the plugin runs Google’s trace_processor_shell.exe and executes many advanced queries against the trace transferring data via protobuf.
- The queries are then joined together as appropriate, post processed, and enhanced with additional calculations & metadata to make the trace analysis experience more useful.
- You can see detailed queries and trace load information in the WPA Diagnostic Console
Analyzing our example Android 12 trace
- Recall that the scenario I chose to execute/trace was stock AOSP 12 image simply launching Chrome and navigating to Wikipedia
- Once the trace is loaded you will see various top-level graph categories on the left in Graph Explorer
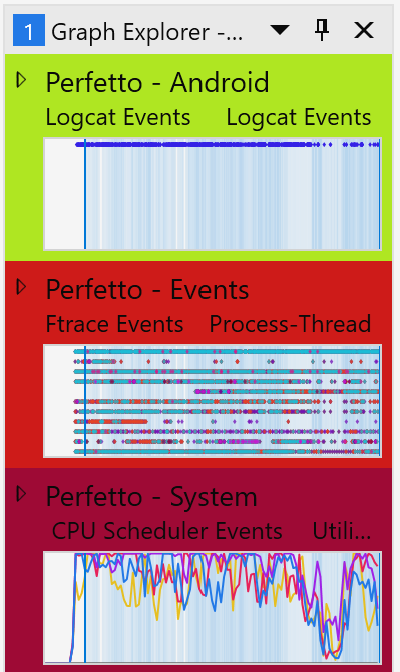
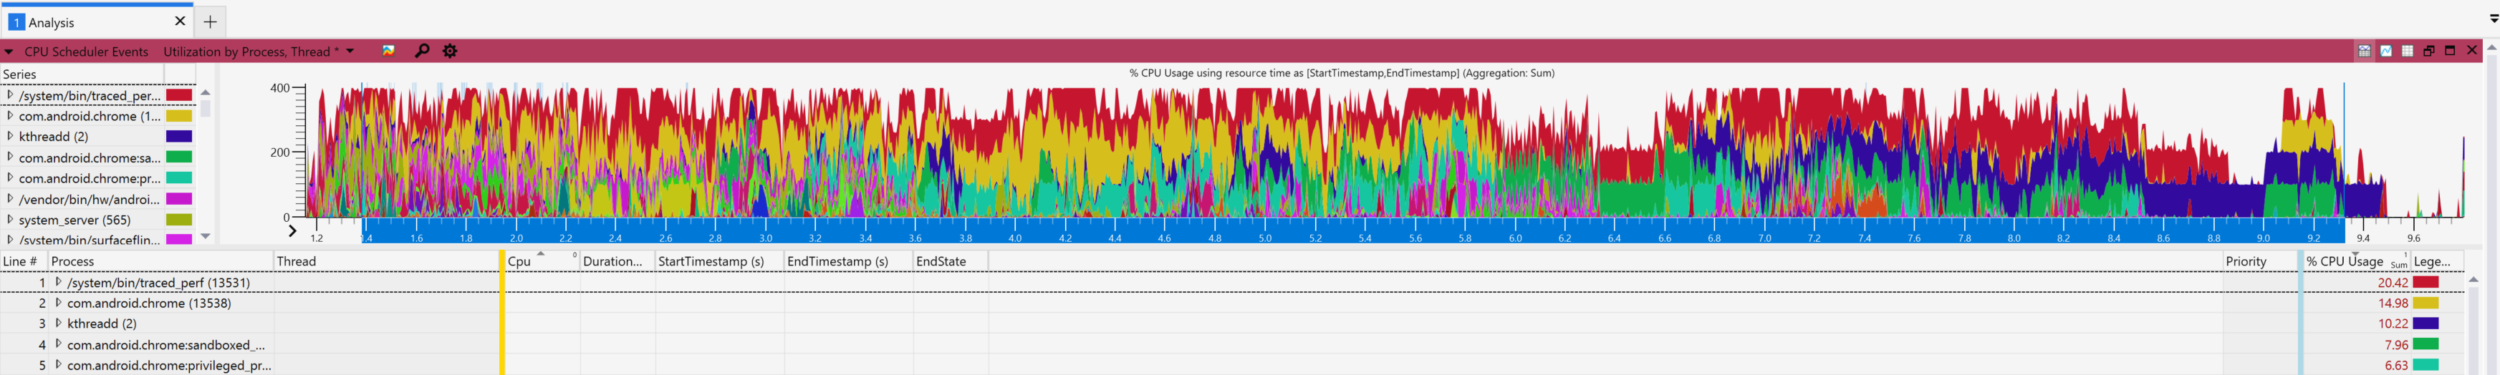
- I like to start with a top-level view of what the system is doing which is usually what work is on the CPU. You can double click or drag CPU Scheduler events
- In CPU Scheduler events I prefer to change the View Preset to “Utilization by Process, Thread” and the “Chart Type” to “Stacked Lines”. I also zoom into the graph so that the data fully covers the width of the chart, and so that the CPU % calculations are correct.
- Here we can easily see the top processes: traced_perf, com.android.chrome, etc
-
- You can easily drill into each process to see which thread is consuming CPU
- There is some neat WaitDuration information added to show how long a thread was waiting or blocked for. This wait duration time is calculated based when a thread is woken up and is an in-depth topic we can explore another time.
- Now we may want to see in detail what functions/stacks were executing on the CPU during this time, which is where the Android 12+ CPU Sampling comes in handy. If you don’t have the CPU samples available, then you are just stuck with only seeing the thread name consuming CPU and hoping there are other useful logs available that might give context on the work being done
- Expand the Perfetto – System node in Graph Explorer so that we can see “CPU Sampling Events”. Again, double click or drag to add to the Analysis tab.
- In CPU Sampling, I switched the View Preset to “By Process, Thread, Stack” and as expected we see our top processes again of traced_perf and com.android.chrome
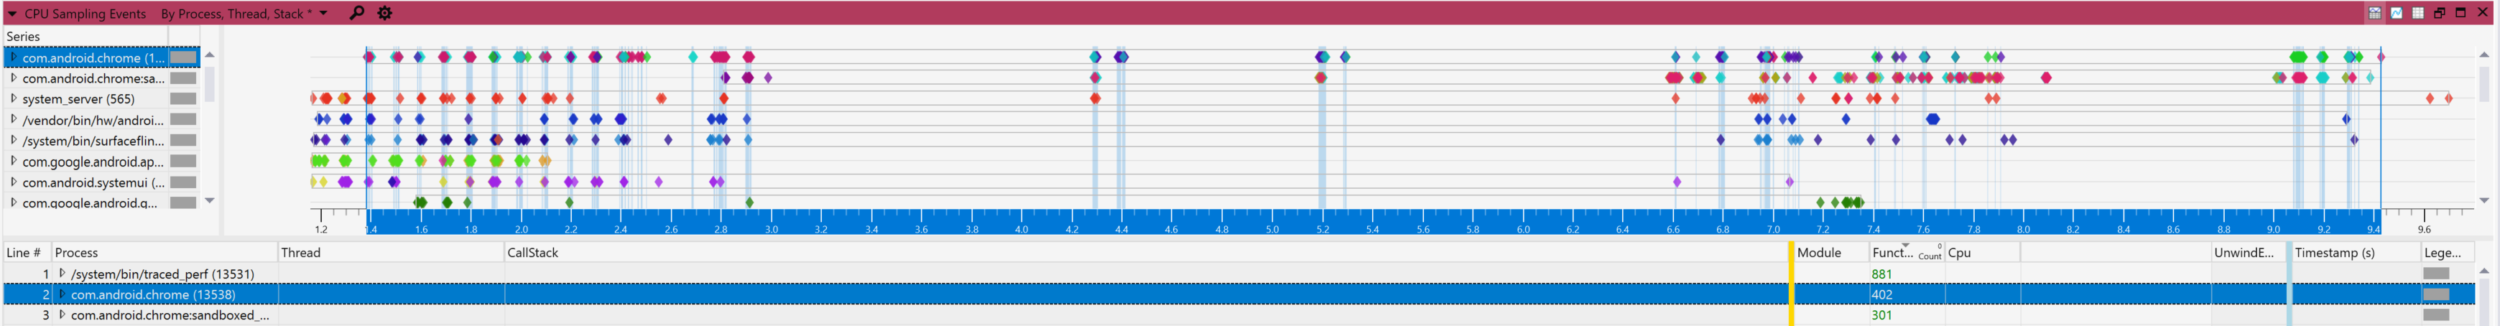
- Once expanded (not shown), interesting things show up here like the traced_perf stack-unwinding thread is performing a lot of Maps parsing. However, since we are interested in Chrome right now we will ignore this and expand the Chrome process. If you can expand enough (or right keyboard arrow) you will see top stacks start to expand. The top occurring stacks are shown at the top of the table; thus ensuring you are looking at the most important data first.
- For example, we see 48 samples corresponding to ~48ms of CPU time spent at the beginning of the trace showing the callstack involved in the launcher and starting Chrome. In addition, simply by selecting rows in the table, you also get auto-highlighting on the graph where those samples are included on the CPU Scheduling graph!

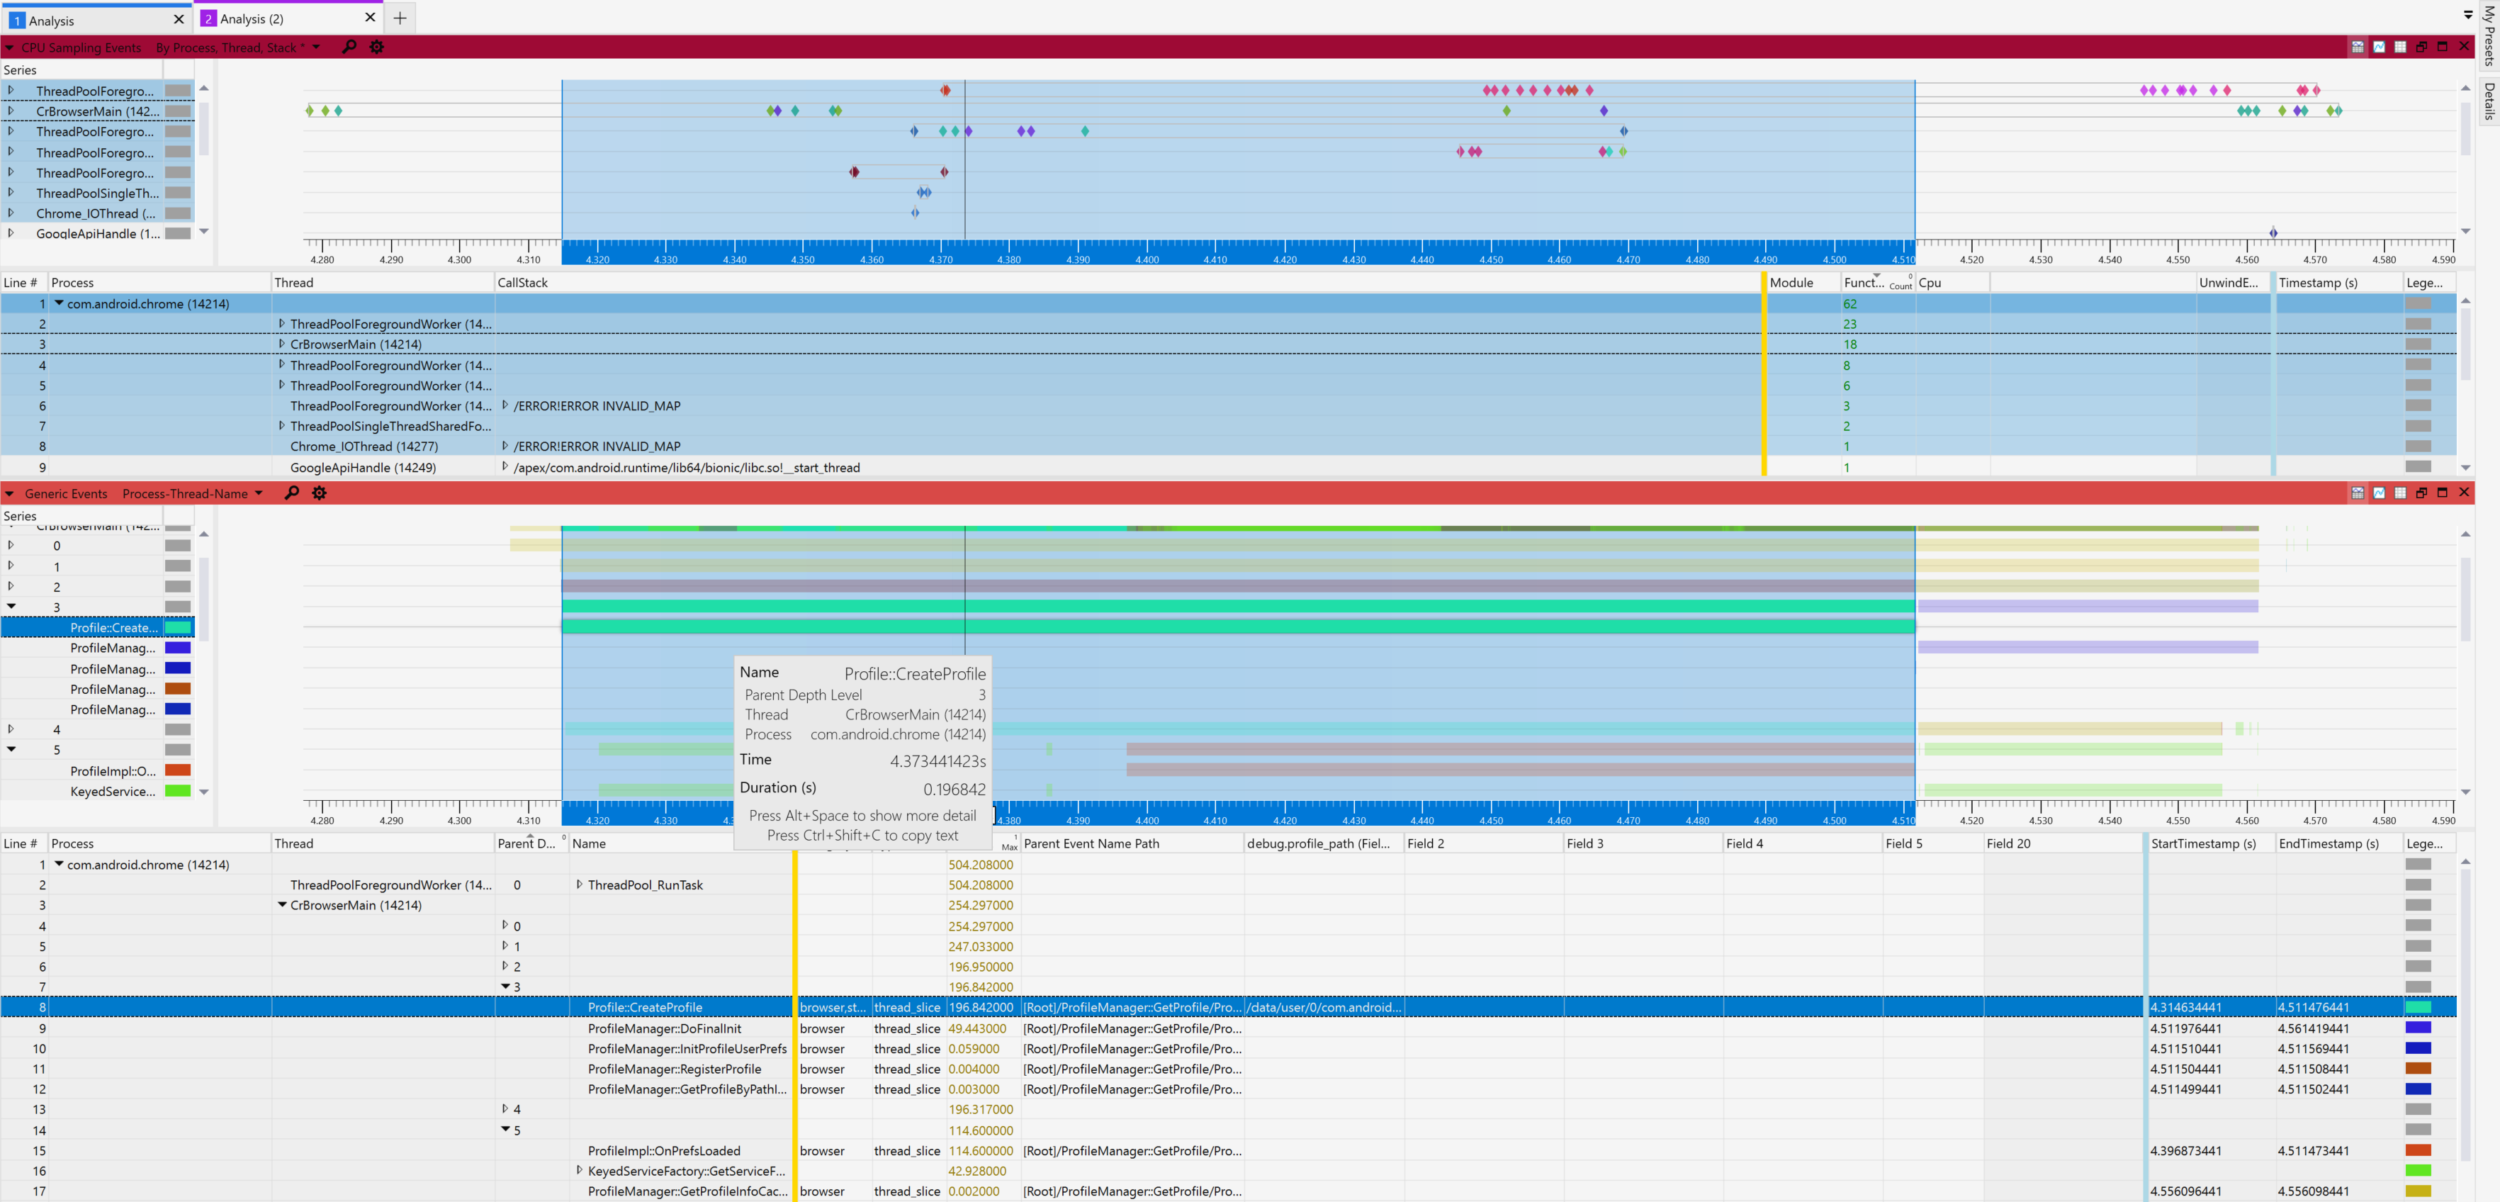
- Almost done! Each process can do its own in process business logic logging to help provide detail and context about what and why it is doing the work it’s doing. Here, Chrome is logging detailed info out via Perfetto due to our trace configuration. You can load up these events in the “Generic Events” graph and get both a visual as well as text representation of the data. Open “Generic Events” under “Perfetto – Events”.
- Here you can see we zoomed in at the start of Chrome launch and the CrBrowserMain thread is loading profiles via the Profile::CreateProfile function. You can see how long the operation took and see the sampled callstacks of the cpu matched on the same timeline.
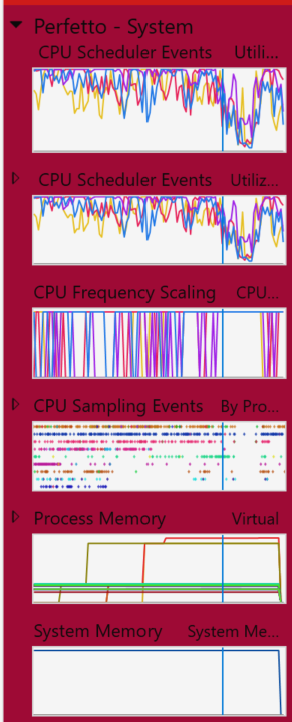
- You can explore other graphs such as: Logcat events, FTrace events, CPU Frequency scaling, Process Memory, and System Memory. These show up as we had a trace capture configuration which specified to collect them.
Wrap-up
Hopefully you can use these powerful Perfetto tools on Android & Chrome to gain insight into what the system and how your code is performing. These are powerful tools you can use as a dev to improve perf!
We walked through how to configure trace capturing and added some new Android 12+ goodness with CPU Sampling.
If this trace is running say inside a Windows VM, such as in Windows Subsystem for Android (WSA), you can optionally co-load an Android Perfetto trace in the same timeline as the Windows ETW trace.
Bonus / Next Steps – Deeper dive into the WPA UI
You may be interested in these other blogs post covering WPA in more detail. The great thing about the integration with WPA, is that the Microsoft-Performance-Tools-Linux-Android plugins are considered first class right along with Windows ETW support.
This means that almost every powerful WPA feature covered in these blog posts, seamlessly is the same experience and also applicable to the Microsoft-Performance-Tools-Linux-Android plugins. Enjoy!
Windows Performance Analyzer “WPA” Intro
Windows Performance Analyzer – Table & Graph Configurations (Part 1)
WPA: Table & Graph Configurations (Part 2)
This is cool stuff. But I have one question: Who on earth thinks that Cpu Scheduler (Context Switch) data without stack traces is useful? The power of ETW is that every event can get a stacktrace attached to it. What was the design rationale that this is not necessary on Android? Are they Google guys smarter that they can guess via CPU sampling data what did take so long?
That's a great question Alois and one I have been partially wondering myself as well. Perhaps you can ask that question on the Perfetto GitHub page - https://github.com/google/perfetto. To be fair some things I see that are useful:
1. CPU scheduling (w/o callstacks) is useful for generating overall and per process CPU Usage %.
2. Android seems to have better thread naming than Windows so that you can get a clue which threads are consuming CPU and what they do.
3. User-Mode processes generally log great detailed track events with parent/child hierarchy such that often you see a sort of...
Thanks Ivan, that helps a lot to understand the design better. It looks like on Android/Linux no WPA (except TraceCompass) like tool did exist so no one was missing it. But once you can correlate CPU sampling and Context switch data together for the hard issues you will not want to live without it.