We recently added support for parsing Android logcat logs to the OSS Microsoft-Performance-Tools-Linux-Android project. Logcat is a text-based dump of system & app messages on Android.
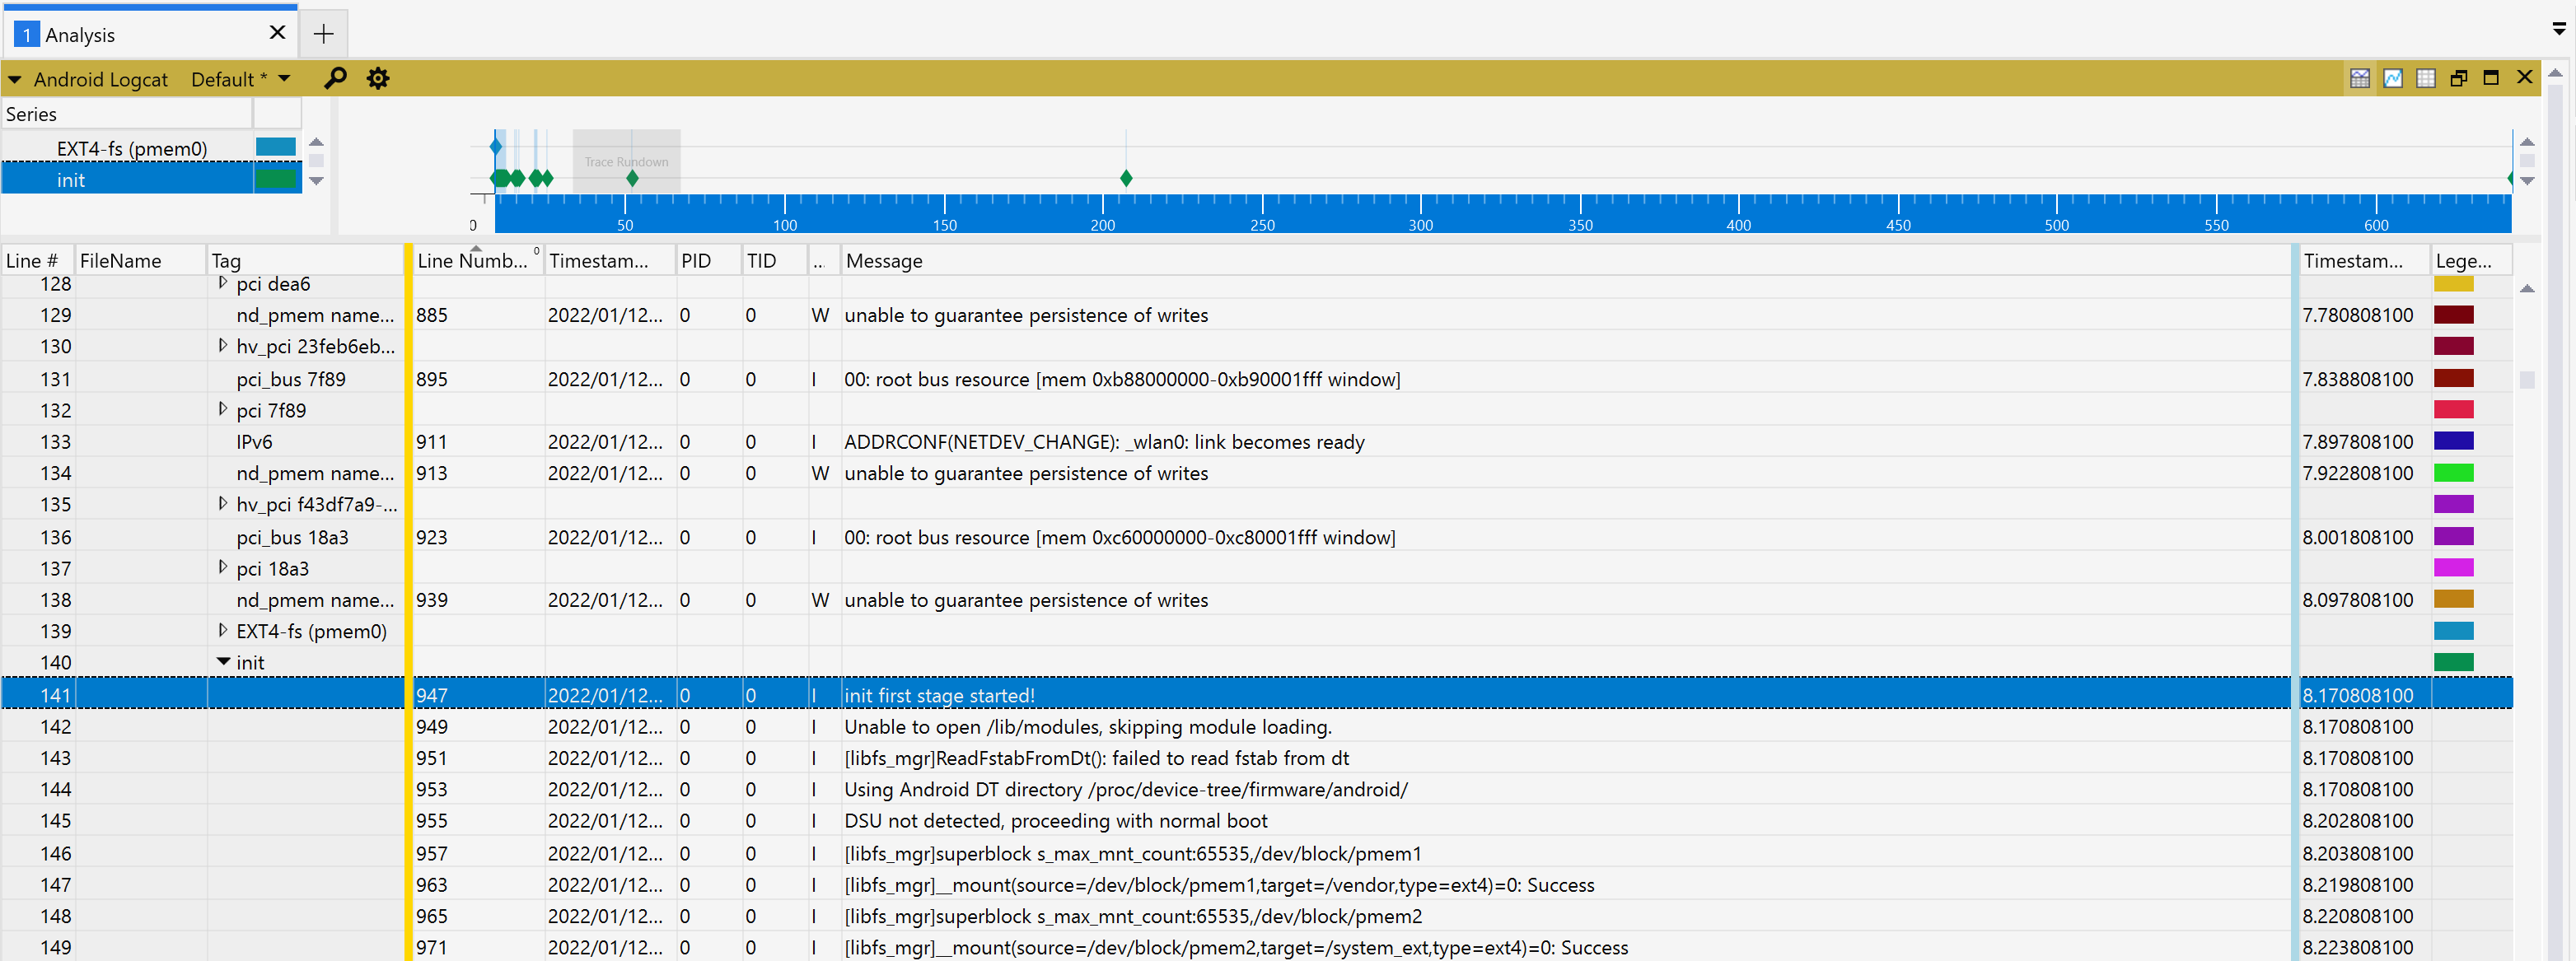
This is what the logcat log would look like when loaded in Windows Performance Analyzer (WPA) 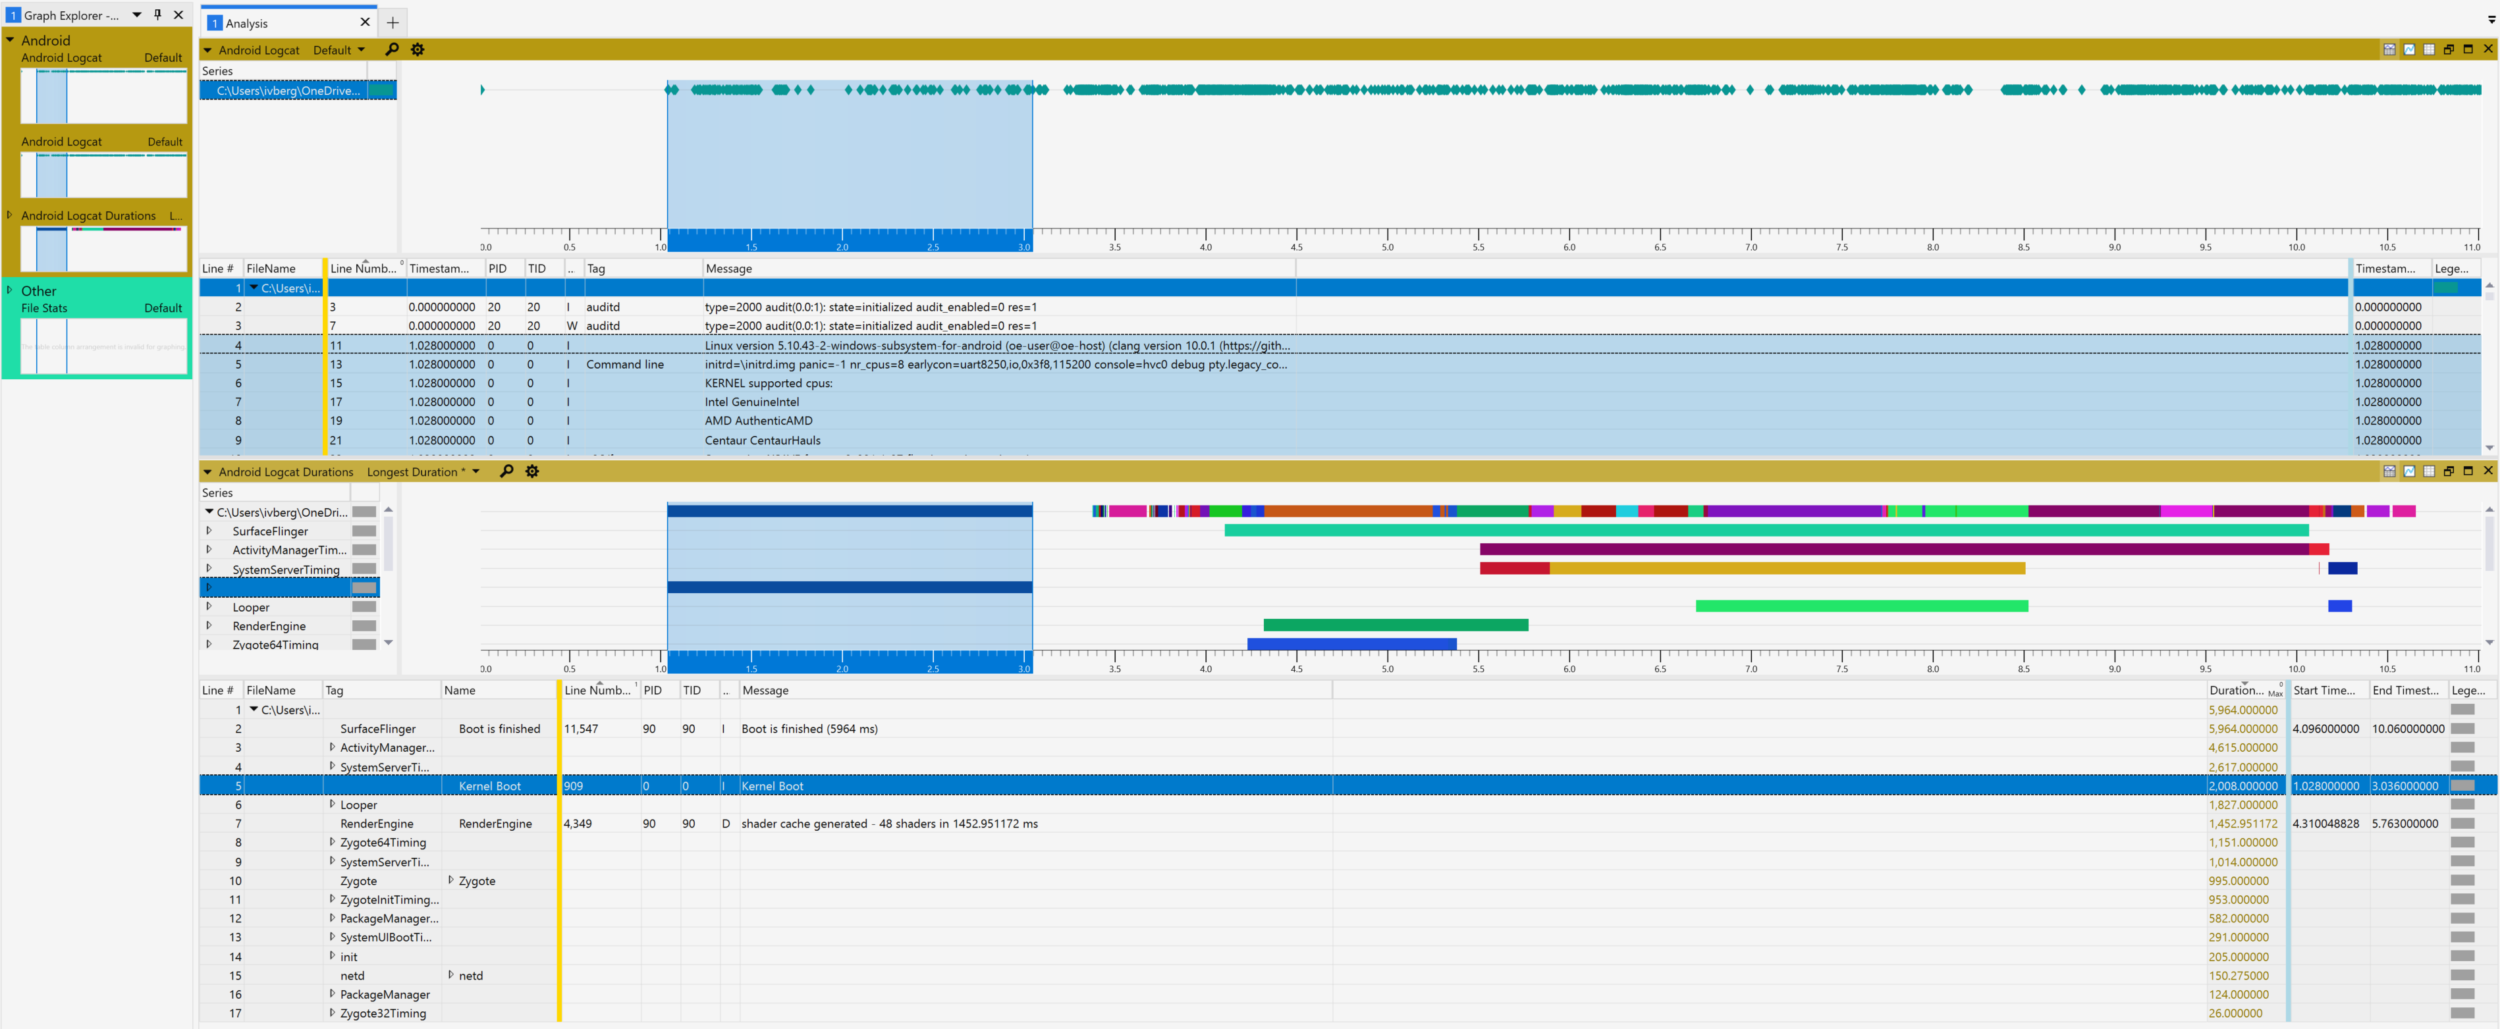
Logcat for performance
Logcat is useful in general, but why do we find it useful for performance work? Don’t we already have an official performance tooling available with a full-featured and system-level Perfetto tracing?
The answer is yes Perfetto is great for deep level system tracing, but one shortcoming is that Perfetto doesn’t cover the boot scenario very well. There is no Linux or Android deep tracing that I know of that covers kernel boot. The Perfetto tracing starts after kernel sometime in usermode, and only captures at best 1/2 to 1/3 of total boot. So Perfetto is great for analyzing run-time perf after the system is booted, but currently doesn’t cover boot very well, even on the upcoming Android 13.
Logcat in tooling
Why is it useful to have this logcat log supported in the tooling?
If you are just looking at diagnostics or errors, looking at the log with grep or your favorite text viewer should suffice. However, when analyzing performance, a bunch of useful features become available that would be cognitively difficult for a human analyst to easily perform. More features will be covered below but initially some of the benefits are:
- Ability to automatically display & measure relative time differences between log statements. This is useful for quickly finding big jumps / gaps in the logs indicative of a long operation.
- Calculation of duration information (how long something took). You have to find which operations are long, which is not trivial with a search pattern looking at thousands of entries with different log formats and time formats. You also want to get quickly be able to jump to where something started without doing the duration math.
- A visual UI showing the longest duration operations and those gaps
- The ability to correlate / show on the same timeline other events. For example, displaying Windows ETW events if Android is running in a VM with Windows Subsystem for Android (WSA).
Walkthrough using Windows Subsystem for Android (WSA)
In our example we will be looking at the boot of a Windows Subsystem for Android (WSA) VM.
In this post we will use the following tools and will walk through each of them
- Microsoft-Performance-Tools-Linux-Android (version 1.3.2 or later)
- Windows Performance Analyzer (Preview)
- Windows Subsystem for Android (WSA) installed on Windows 11
App launch Scenario and log capture
Because the scenario involves running Android in a VM, we will capture both a Windows host trace and the Android guest boot logcat log. The lifecycle of the VM in WSA is covered under VM lifecycle considerations
- Start capturing a Windows trace. We will capture General, CPU, Disk, and Reference Set memory events in a memory buffer.
- From an Administrator command-prompt type
- ‘wpr -start GeneralProfile -start CPU -start DiskIO -start ReferenceSet’
- From an Administrator command-prompt type
- Start the VM via an app launch. In this case ‘Amazon AppStore’ is included in WSA so we will launch that app.
- An app loading UI will be presented. Once the Amazon app is fully launched and you can see the Amazon app launch UI then continue.
- Stop capturing the Windows trace
- From an Administrator command-prompt type
- ‘wpr -stop WSALaunchAmazonAppStore.etl -skipPdbGen’
- From an Administrator command-prompt type
- Copy the latest Android guest logcat to the same location as the .etl file. The logcat log is found under this path
- %localappdata%\packages\MicrosoftCorporationII.WindowsSubsystemForAndroid_8wekyb3d8bbwe\LocalState\diagnostics\logcat
Analyzing the traces – Setup
- We will be using WPA (Preview) UI for the rest of the analysis and screenshots, so install it from the Microsoft Store.
- Note: Older versions of WPA are not compatible with the SDK and the toolkit
- Download the Microsoft-Performance-Tools-Linux-Android 1.3.2 toolset (or later) from GitHub releases
- Extract the zip file and navigate to Microsoft-Performance-Tools-Linux-Android\Launcher\Windows
- Given the release came from the Internet, you may need to unblock the .bat or .ps1 file using right-click properties unblock
- Double-click LaunchWpaPerfToolsLinuxAndroid.bat which will launch the WPA UI pre-configured to load the plugins
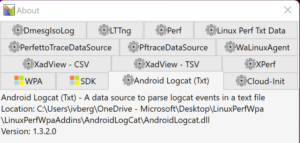
- Once WPA is loaded, click Help -> About and you should see a bunch of plugins pre-loaded including Android Logcat support
Loading our trace in unified mode
- In WPA, from here you should be able to open logcat files from the File -> Open menu
- Multi-select the 2 log files and choose ‘Open Unified’
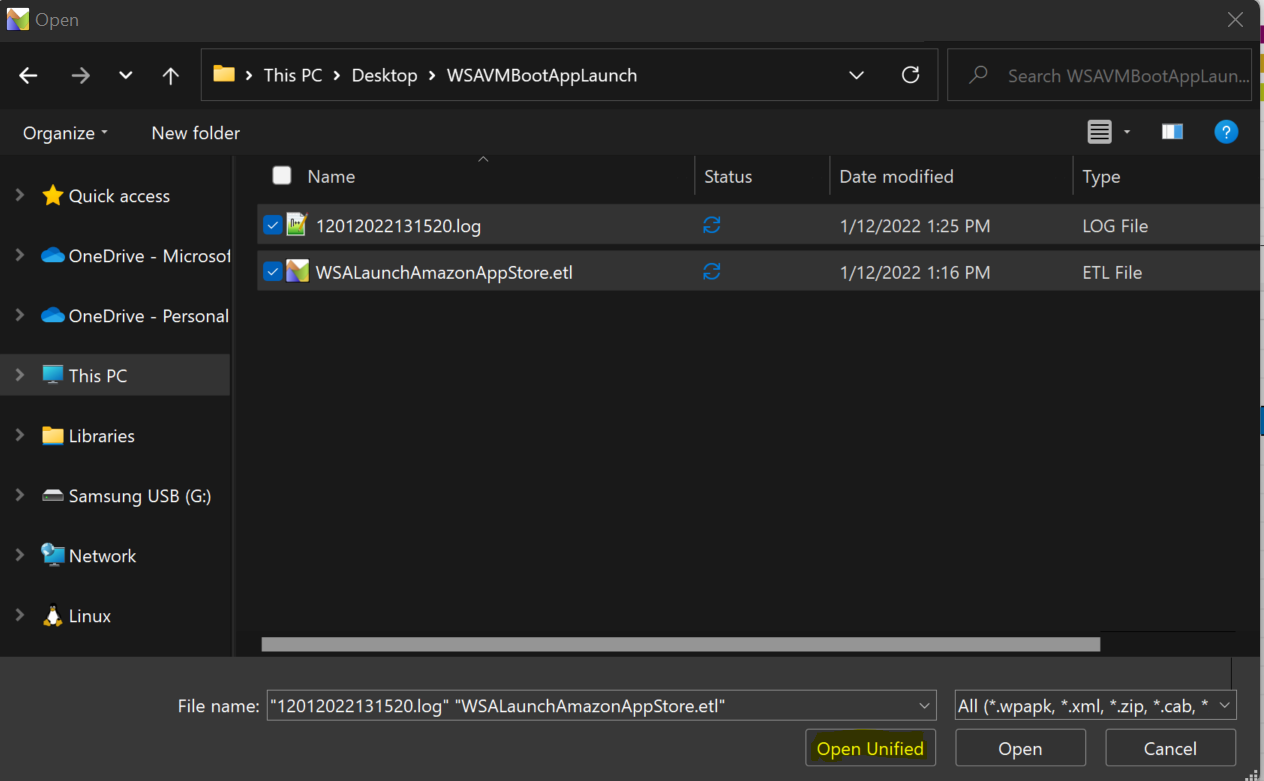
- The 2 trace files timelines will be loaded into the same unified timeline and available side-by-side in the WPA GUI for analysis.
- If you need to open the log in a different timezone other than what it was captured on see this workaround.
- From here on out, we will just focus on the Android logcat features as Windows ETW analysis is a separate deep topic.
- In Graph Explorer, Android Logcat graphs will appear and can be double-clicked to open
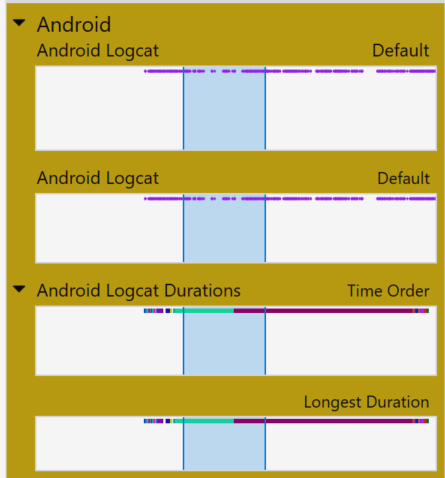
- For Duration Analysis – Open “Android Logcat Durations” “Longest Duration”
- Various durations should automatically appear depending on the loglevel detail. Android userdebug builds will log and show much more detail and thus more durations here.
Logcat Analysis
Here are some various questions that can now be easily answered related to perf.
- What is the duration of kernel boot to init?

- How long is init and its sub-operations?

- What are the longest operations?
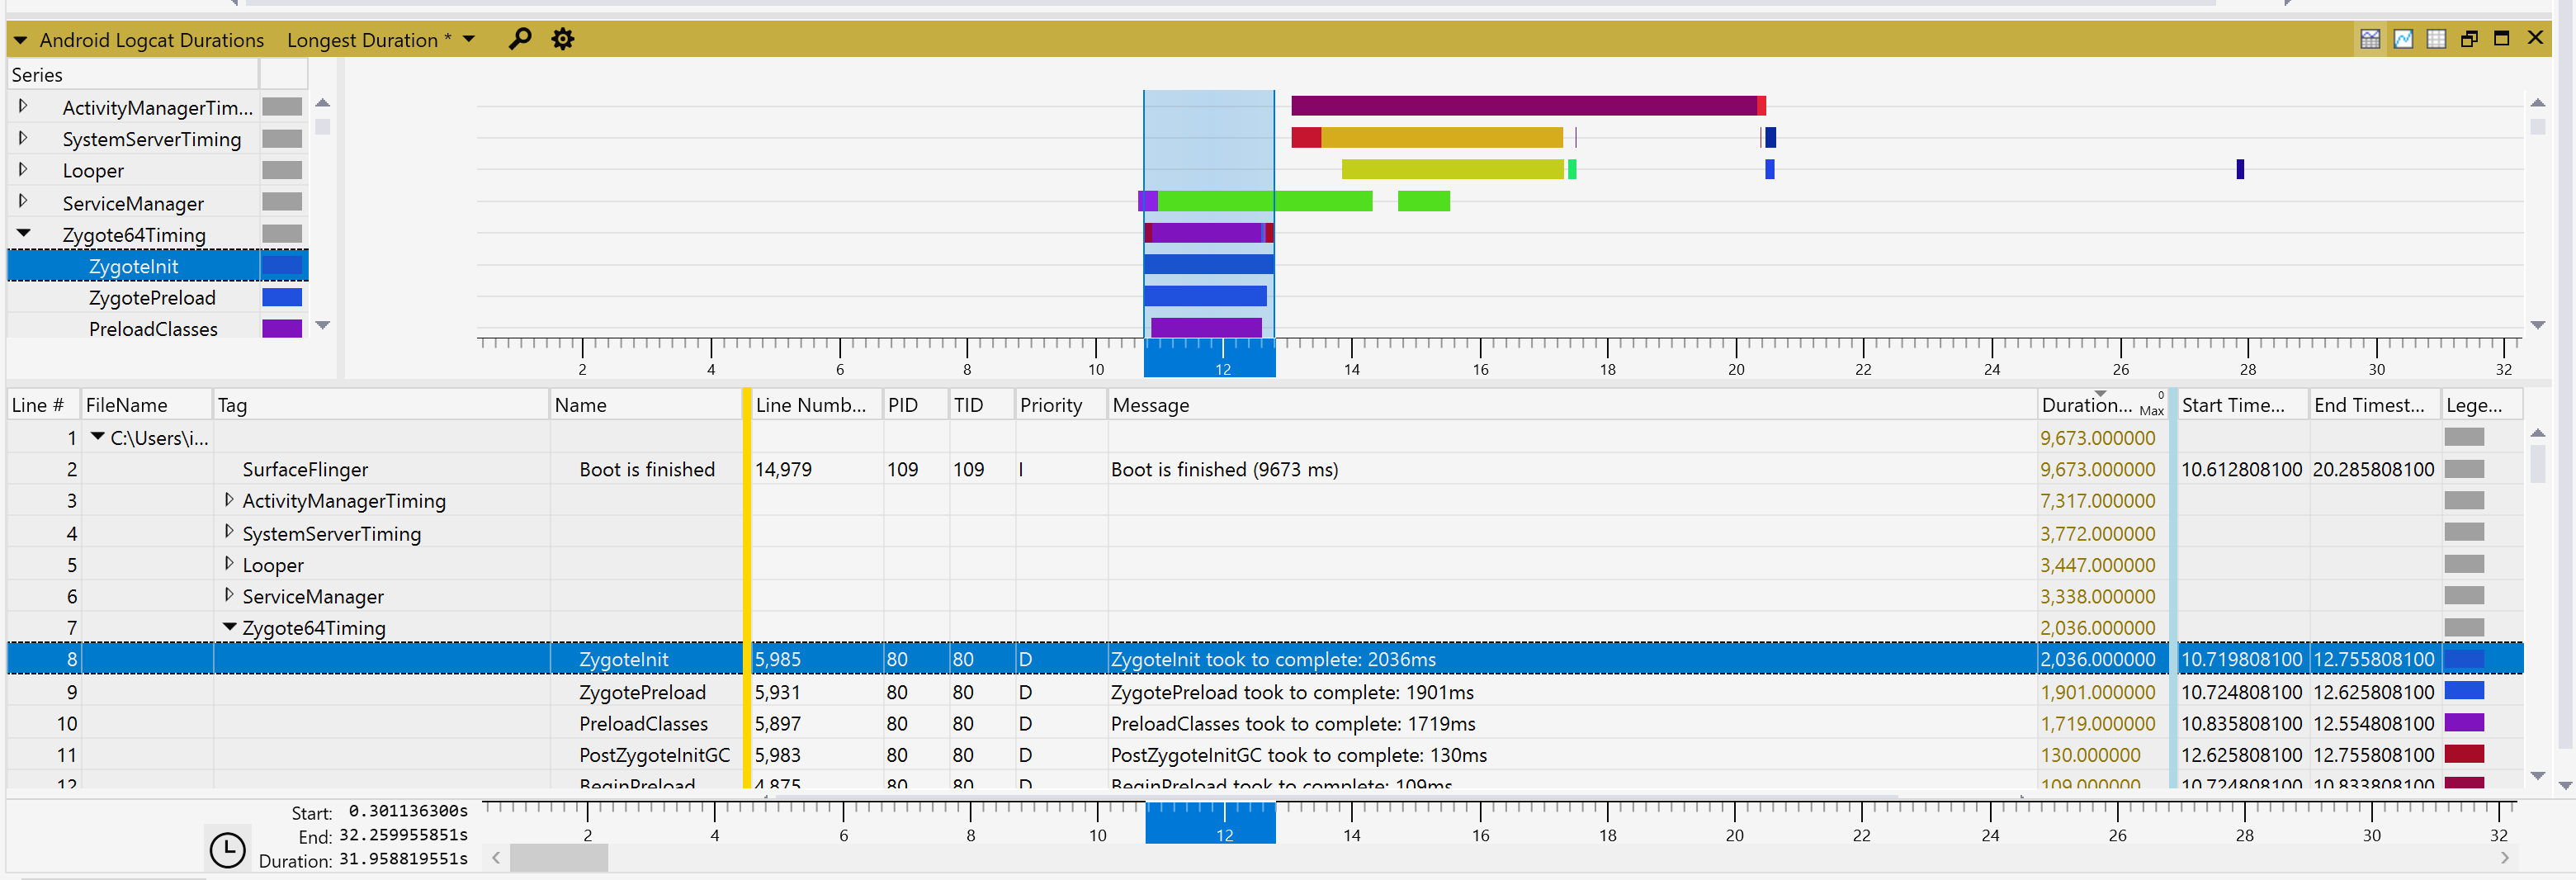
- Are there any Looper message loop delays or OpenGLRenderer perf jank issues?

- Even if there is no duration info in the log, what are the operations with the biggest gaps in the log which might suggest a long operation?
- Here you can visually see gaps, zoom in and simply select events after the gap to find potential long operations quickly

In addition, you get features like aggregation, sorting, filtering and more. One example with aggregation (Tag to left of gold bar) that is useful say if want to see all entries of a given Tag (Category) grouped together.
E.g. Show me all messages from init or some other Tag grouped together
Bonus / Next Steps – Deeper dive into the WPA UI
You may be interested in these other blogs post covering WPA in more detail. The great thing about the integration with WPA, is that the Microsoft-Performance-Tools-Linux-Android plugins are considered first class right along with Windows ETW support. This means that almost every powerful WPA feature covered in these blog posts, seamlessly is the same experience and also applicable to the Microsoft-Performance-Tools-Linux-Android plugins. Enjoy!
Windows Performance Analyzer “WPA” Intro
Windows Performance Analyzer – Table & Graph Configurations (Part 1)
WPA: Table & Graph Configurations (Part 2)

0 comments