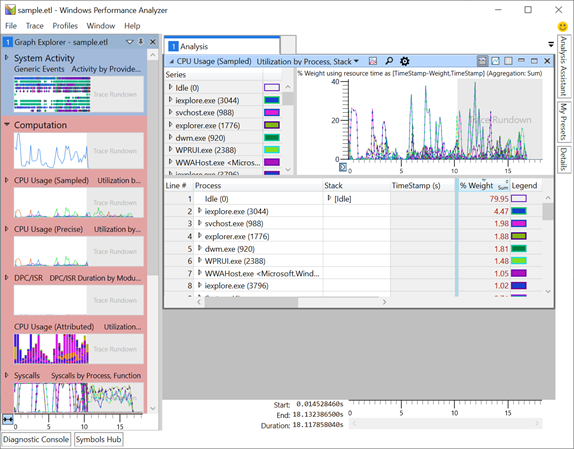
In Part 1, we discussed the different types of columns options available in WPA's table views and how those views can be configured.
This blog will continue the series by digging into how to configure columns for different graph styles that can show numeric aggregations, time, and hierarchical data:
Graphing Overview
Before we ...
In the previous post, we discussed a brief intro into Windows Performance Analyzer (WPA) and its feature set. WPA can display trace data in a wide array of formats, most of which are pre-configured as presets designed for drilling into specific data points.
Here is one for example: WPA's CPU Usage (Sampled) table has a few different presets, ea...
If you do a search online for WPA, you might find information for protecting your Wi-Fi, but that is a different type of WPA.
In the performance & diagnostics space WPA stands for Windows Performance Analyzer, a friendly but intricate UI that allows for developers and analyst to deep dive into performance traces captured on Windows (and beyo...