Hi everyone, welcome to the August update of Visual Studio Code Java. In this month’s update, we have brought more exciting features for Spring as well as improvements for build tools and debugging experience. Let’s get started!
Spring enhancements
Spring enhancements has been one of our top focuses this year. In our latest release, we are excited to bring more Spring features to Java developers.
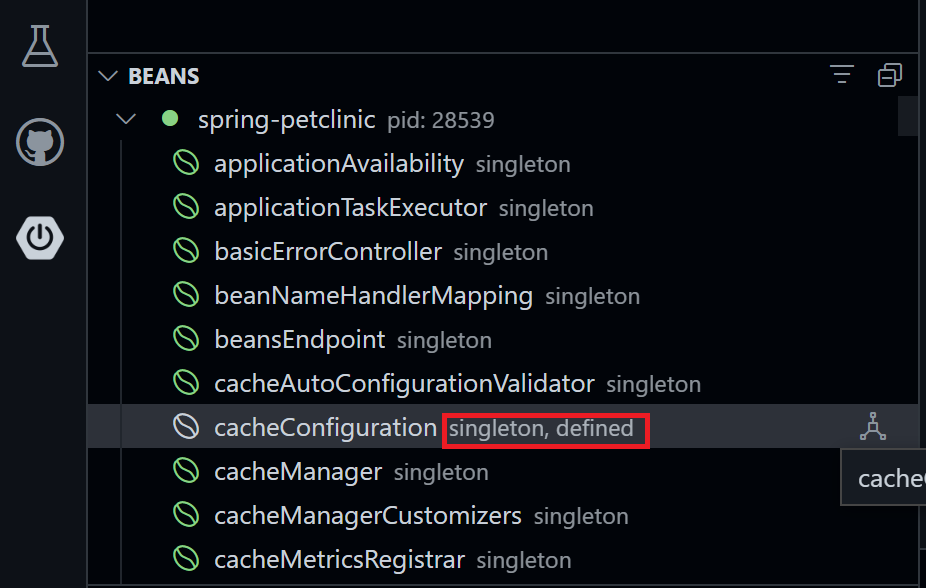
Spring bean properties when live process is connected
Bean property is a key attribute that Spring developer often needs to look at. We have heard about this feedback and added this information to the Spring dashboard under the “Beans” view when live process is connected
When developer starts a Spring app from the Spring dashboard, just wait for the beans to connect to the live process and go “green”, then the bean property information will automatically appear right next to the bean name. You will see if the bean is a singleton, prototype, and so on. If a bean is defined by developer and not by Spring framework, you will also see “defined” as well.
See screenshot below for a demo.
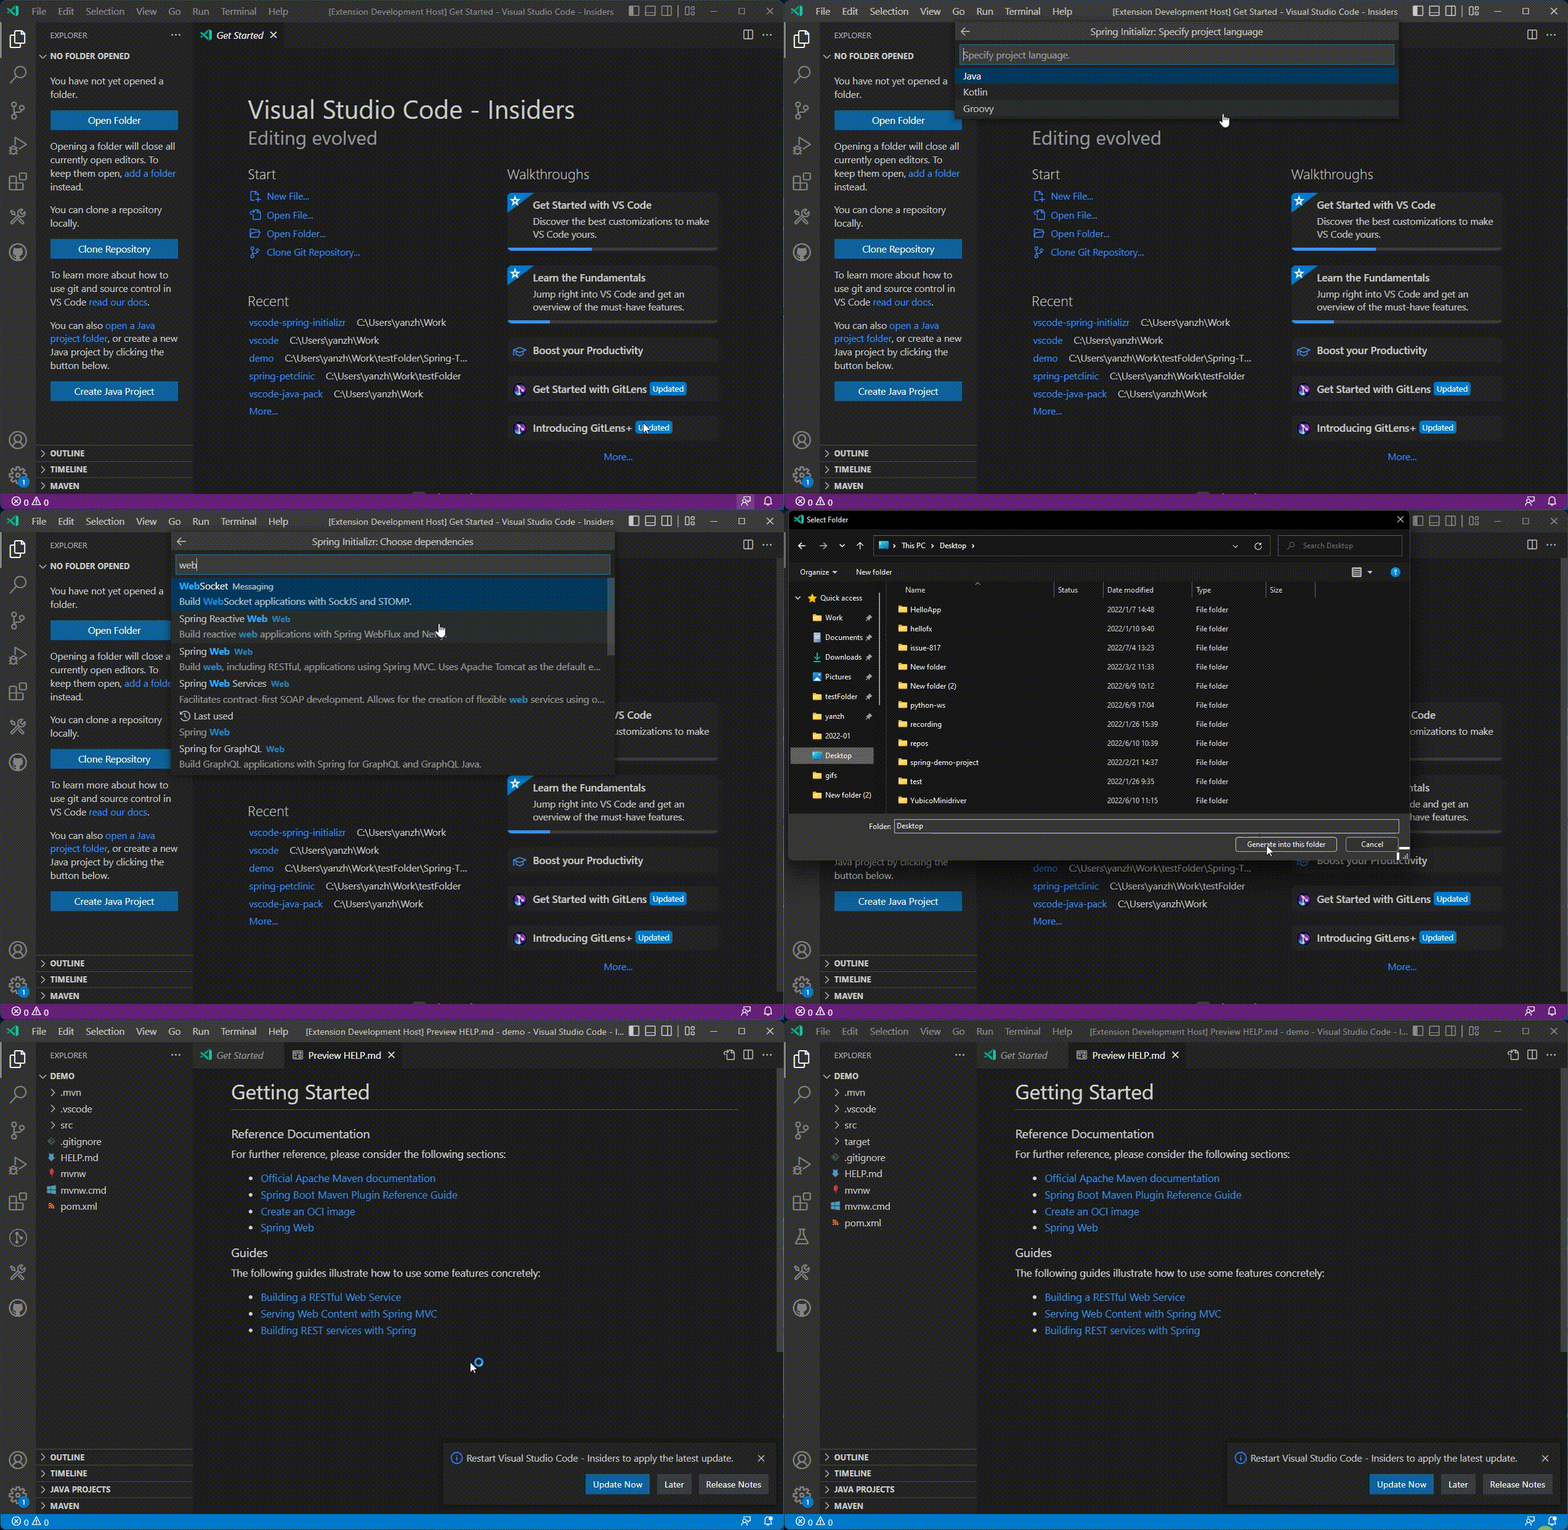
Better getting started experience for Spring Initializer
When a developer uses Spring Initializer to create a new project, it generates a HELP.md which provides useful information to help developer get started. However, previously many developers would not realize this file was there or it was simply ignored. It would be helpful if this file can be automatically opened in Visual Studio Code.
This feature is added recently so that Spring developers can have a more smooth getting started experience. Let’s see a quick demo.
Note that you need to install the Extension Pack for Java and Spring Boot Extension Pack to use the new features above.
Maven and Gradle improvements in Java Project Explorer
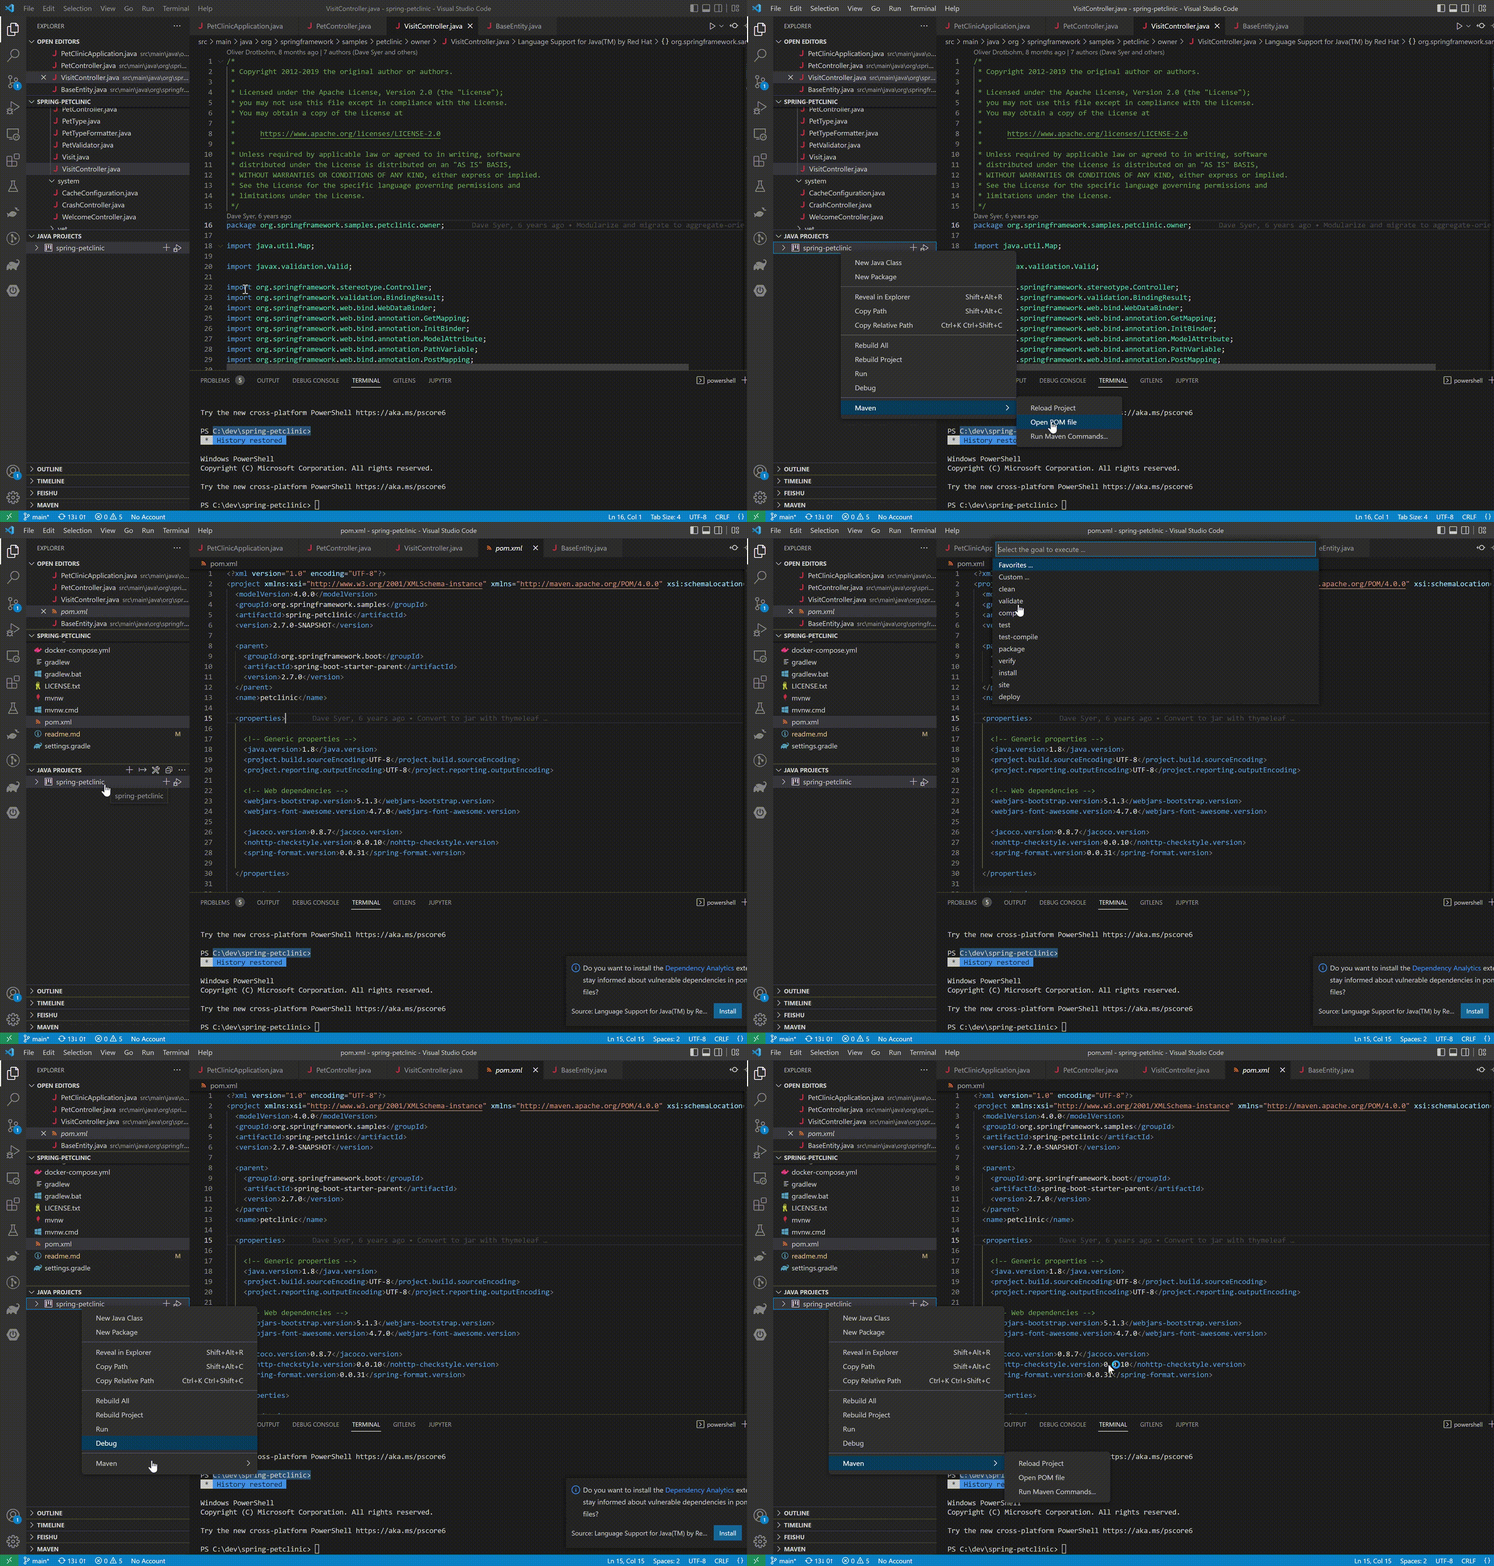
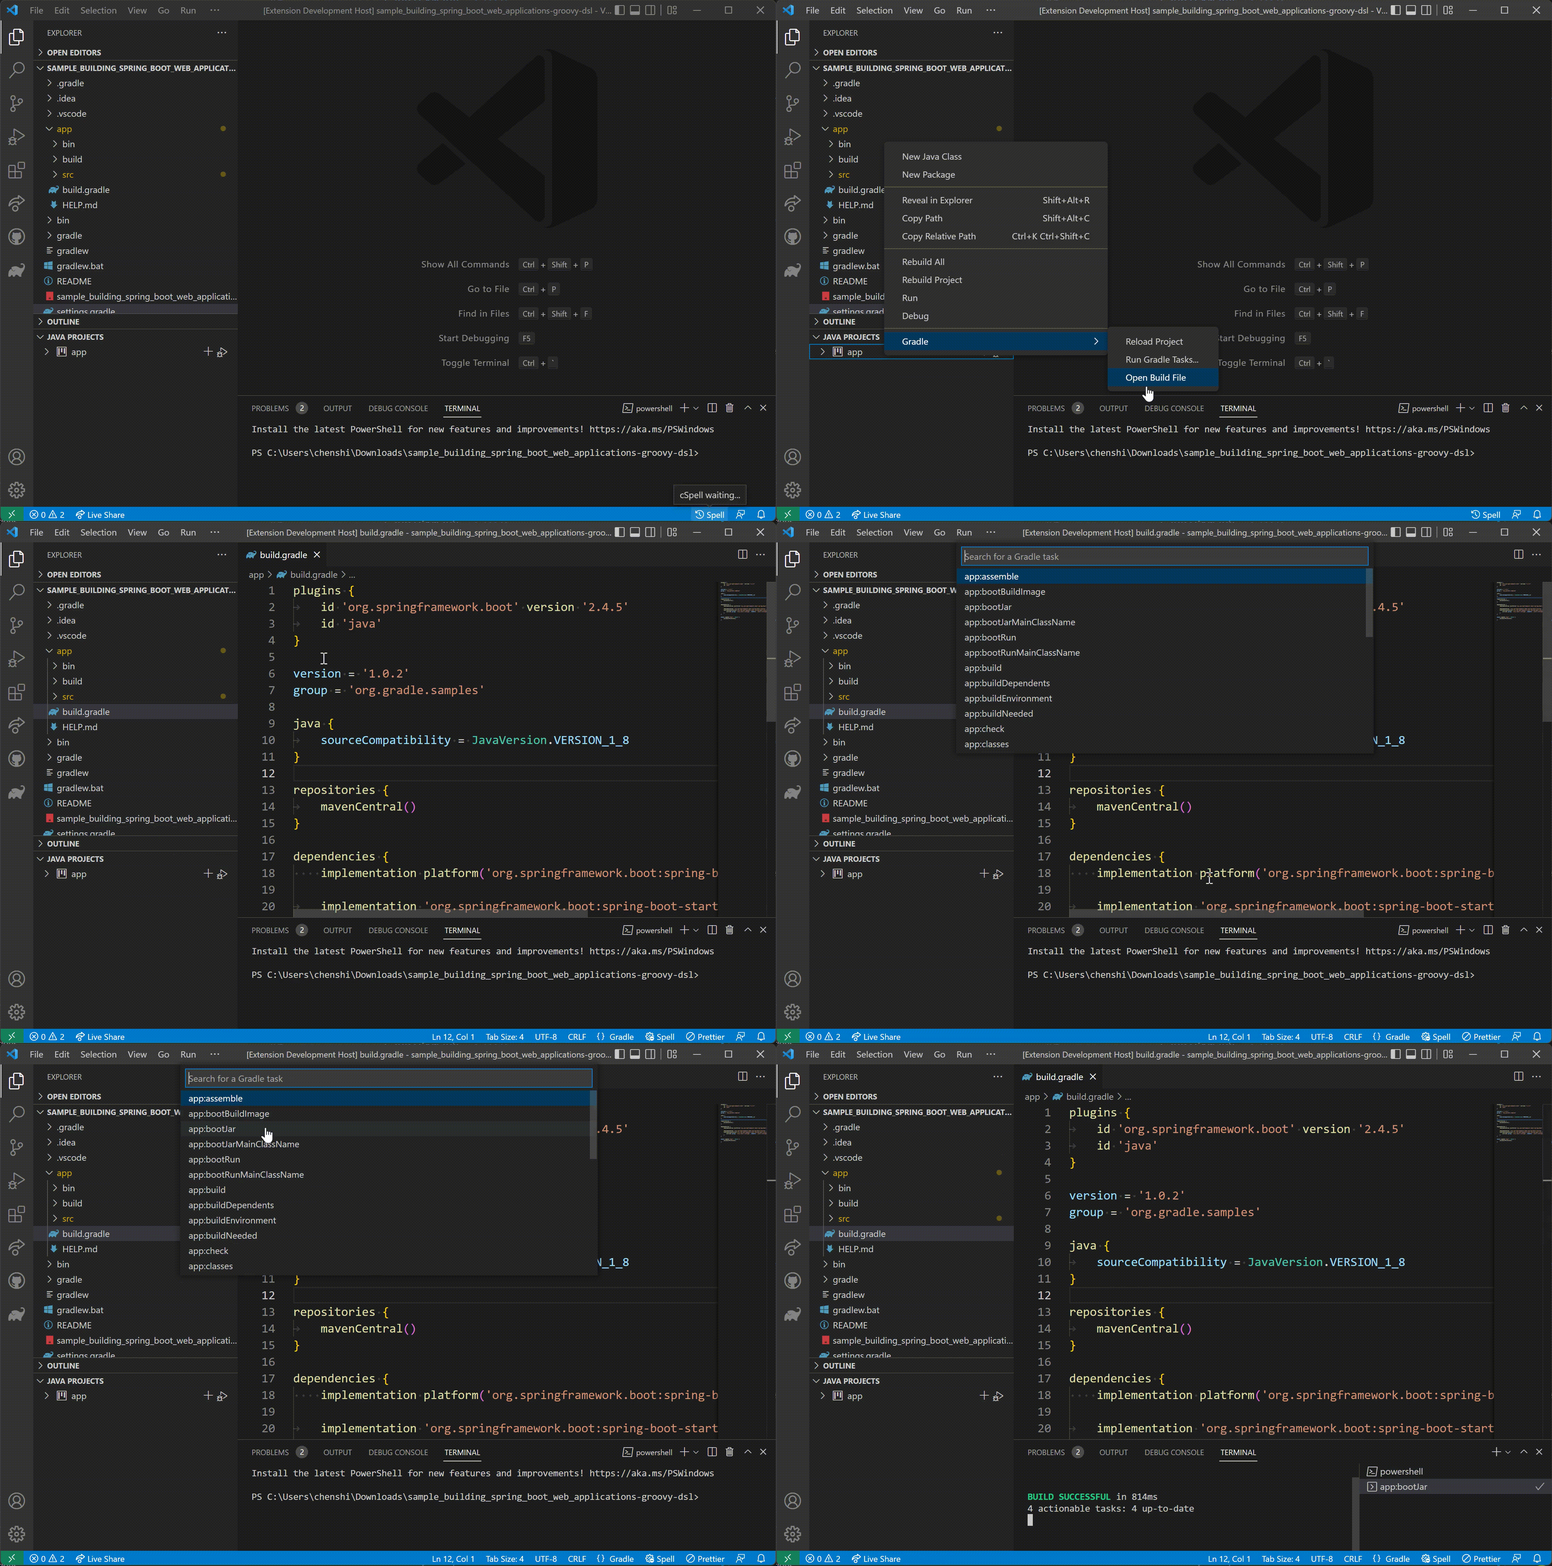
We have heard from developers that they want better Maven and Gradle integration in our extensions, and this is one of the areas we will keep working on. In our latest release, we have added Maven and Gradle menu items in our Java Project Explorer so that developers can directly access certain actions in a more convenient way. To use this feature, developers just need to right click on an application node inside the Java Project Explorer view in a Maven or Gradle project and find the actions at the bottom of pop up menu.
Here are some demos for this feature.
Maven Project
Gradle Project
Debugging Enhancements (Community Contributions)
Lastly, there are also some debugging improvements and both of them are community contributions. Thanks to @gayanper and @mfussenegger for submitting PRs for enhancing Java debugging experience on Visual Studio Code. The improvements are listed as follow:
- Improve support for method breakpoints (https://github.com/microsoft/java-debug/pull/426)
- Show target VM exceptions as result in evaluate requests (https://github.com/microsoft/java-debug/pull/428)
We welcome all kinds of community contributions so please keep them coming 🙂
Feedback and suggestions
As always, your feedback and suggestions are very important to us and will help shape our product in future. There are several ways to give us feedback
- Leave your comment on this blog post
- Open an issue on our GitHub Issues page
- Send an email to: vscjfeedback@microsoft.com
Resources
Here is a list of links that are helpful to learn Java on Visual Studio Code.
- Learn more about Java on Visual Studio Code.


0 comments