Content outdated
For up-to-date information on C++ game development in Visual Studio, please the latest blogs from us on game development.For an overview of the Visual Studio capabilities described in this article, see DirectX Game Development .
Install Visual Studio for DirectX development
First, download Visual Studio 2017 and launch the Visual Studio installer.
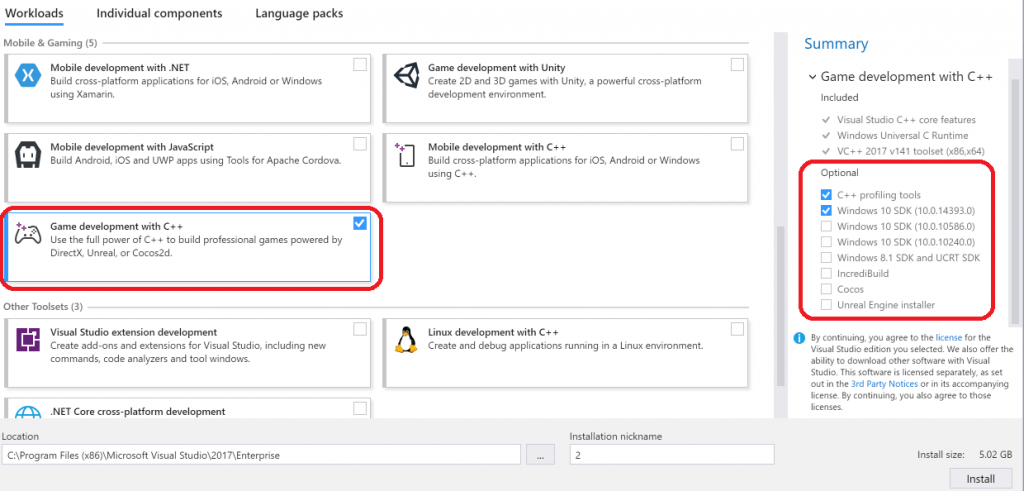
To build DirectX desktop games, choose the “Game development with C++” workload under the “Mobile & Gaming” category. This workload gives you the core tools to build DirectX games for desktop, which includes the Visual Studio core editor, Visual C++ compiler, Windows Universal C Runtime, and Visual Studio debugger.
The pre-selected components are highly recommended. Here are the two recommended components and the rest of the optional components that are useful for building DirectX games:
- C++ profiling tools: includes Graphics Diagnostics for DirectX (a.k.a. Visual Studio graphics debugger) and a set of profiling tools for memory, CPU and GPU. Selected by default.
- Windows 10 SDKs: The latest Windows 10 SDK is selected by default.
- Windows 8.1 SDK and UCRT (Universal C Runtime) SDK
- IncrediBuild: installs IncrediBuild from incredibuild.com, a distributed computing solution for code builds, data builds and development tasks.
- Cocos: installs Cocos Creator from cocos2d-x.org, the editor for building Cocos2d games.
- Unreal Engine installer: installs Epic Games Launcher from unrealengine.com, which you can use to download and install the Unreal Engine.
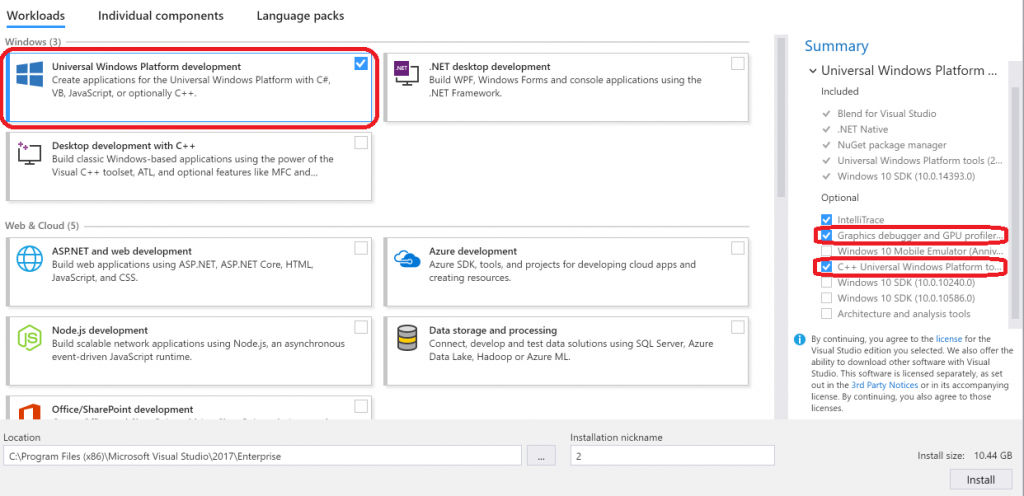
If you’re also interested in building DirectX games for UWP to run on a variety of devices in the Windows family, you can install the tools by checking the “Universal Windows Platform development” workload under the “Windows” category with the “C++ Universal Windows Platform tools” option selected. The C++ UWP component adds the core C++ UWP support and 3 DirectX project templates for DirectX11 and DirectX12 to get you started quickly. The “Graphics debugger and GPU profiler” component is highly recommended for DirectX development, as it brings in the Graphics Diagnostics feature for DirectX graphics debugging and GPU Usage feature for profiling GPU and CPU usage in DirectX games.
Getting started
DirectX game for UWP
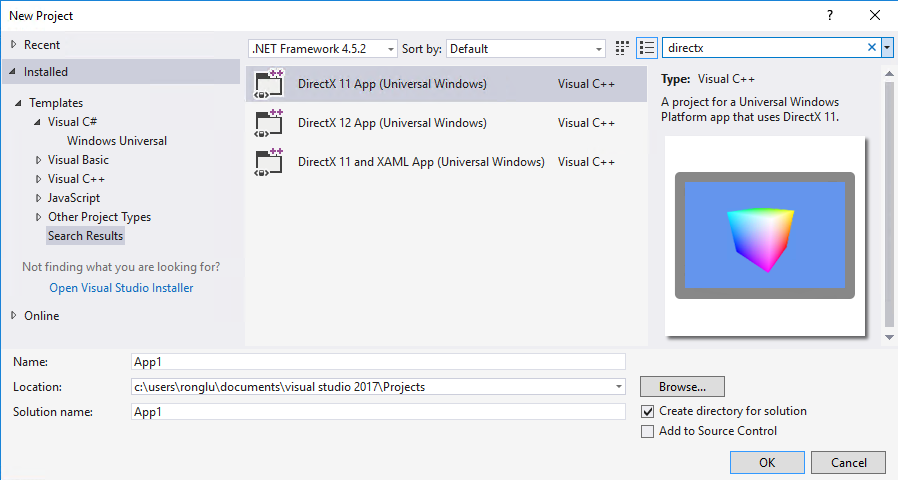
The UWP workload comes with 3 DirectX project templates. Use the menu item New->Project to launch the New Project dialog and then type “DirectX” in the search box in the upper right corner to find the project templates for DirectX: DirectX11 App, DirectX12 App, DirectX11 and XAML App. Select one template and click OK.
After the project is created, you’re all set to run the DirectX app right away by pressing F5 or clicking Debug->Start with debugging from the menu. You should see a colored 3D cube spinning on your screen.
DirectX game for desktop
To build a DirectX desktop app, you can start with the Win32 Project template in the New Project dialog, or download a Win32 game template, or download a sample from DirectX11 samples or DirectX12 samples as a starting point.
Write C++ code with the full power of the Visual Studio IDE
Now we have a basic 3D app running, it’s time to add game logic in C++. Use the full power of Visual Studio productivity features, including IntelliSense and code navigation, to write your game code in C++.
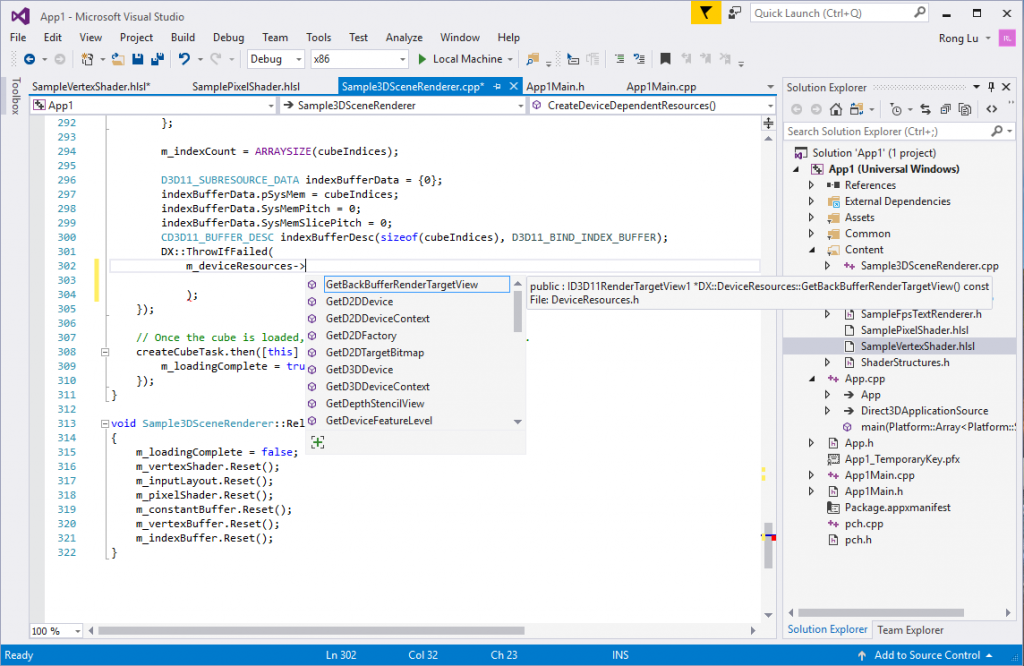
Member list and Quick Info, as shown in the following screenshot, are just two examples of the IntelliSense features Visual Studio offers to make code writing easier and faster. Member list shows you a list of valid members from a type or namespace. Typing in “->” following an object instance in the C++ code will display a list of members, and you can insert the selected member into your code by pressing TAB, or by typing a space or a period. Quick Info displays the complete declaration for any identifier in your code. In the following screenshot, Visual Studio is showing the list of members of an instance of the DX::DeviceResources object and the declaration of the GetBackBufferRendererTargetView method, making writing DirectX code a lot easier.
Refactoring, Auto-complete, squiggles, reference highlighting, syntax colorization, code snippets are some of the other useful productivity features to be of great assistance in code writing and editing.
Navigating in large codebases and jumping between multiple code files can be a tiring task. Visual Studio offers many great code navigation features, including Go To Definition, Go To Line/Symbols/Members/Types, Find All References, View Call Hierarchy, Object Browser, and many more, to boost your productivity.
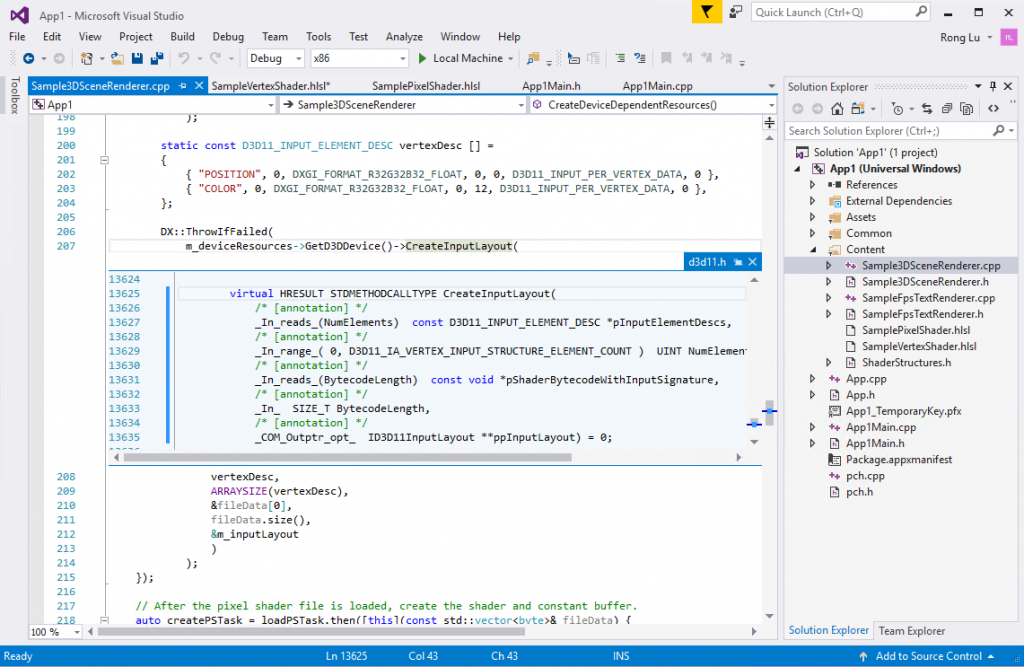
The Peek Definition feature, as shown in the following screenshot, brings the definition to the current code file, allows viewing and editing code without switching away from the code that you’re writing. You can find Peek Definition by opening the context menu on right click or shortcut Alt+F12 for a method that you want to explore. In the example in the screenshot, Visual Studio brings in the definition of the CreateInputLayout method that lives in the d3d1.h file as an embedded window into the current cpp file, making reading and writing DirectX code more efficiently.
Write and debug shaders
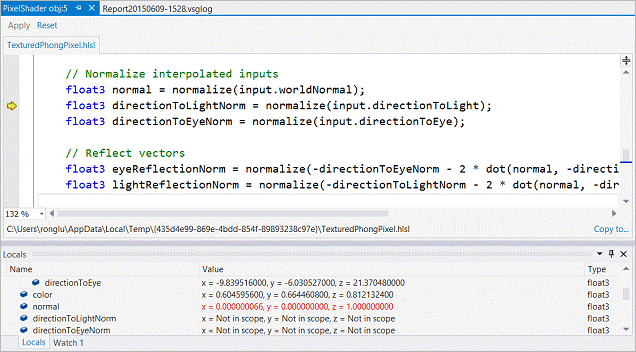
Besides C++ code, writing shader code is another big part of building DirectX games. The Visual Studio shader editor recognizes HLSL, FX, and other types of shader files, and provides syntax highlighting and braces auto-completion, making it easier to read and write shader code. Debugging shader code from a captured frame is another great way to pinpoint the source of rendering problems. Simply set a breakpoint in your shader code and press F5 to debug it. You can inspect variables and expressions in Locals and Autos windows. Learn more about the HLSL Shader Debugger.
Debug C++ code with the world-class Visual Studio debugger
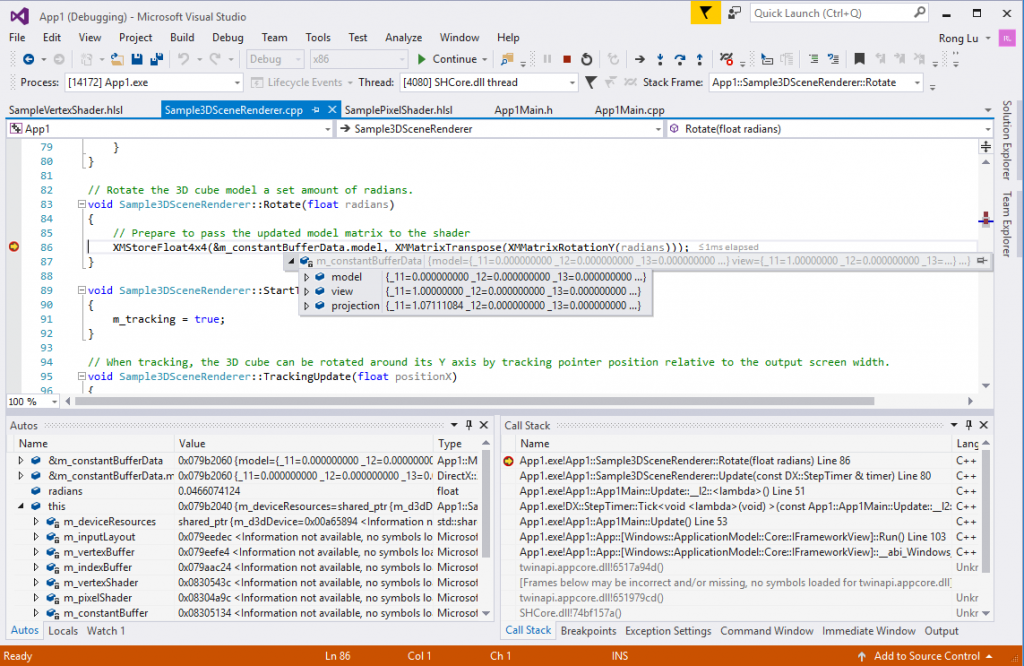
Troubleshooting issues in the code can be time-consuming. Use the Visual Studio debugger to help find and fix issues faster. Set breakpoints in your C++ code and press F5 to launch the debugger. When the breakpoint is hit, you can watch the value of variables and complex expressions in the Autos and Watch windows as well as in the data tips on mouse hover, view the call stack in the Call Stack window, and step in and step out of the functions easily. In the example in the screenshot below, the Autos window is showing us the data in the constant buffer and the value of each member of the device resource object instance, making stepping through DirectX code easy and efficient.
But that is not all what the Visual Studio debugger can do. For example, the Edit and Continue capability allows you to edit your C++ code during a debugging session and see the impact right away without having to rebuild the application, saving a huge amount of development time.
You can find more details in this blog post C++ Debugging and Diagnostics.
Visual Studio Graphics Diagnostics
Debugging rendering issues
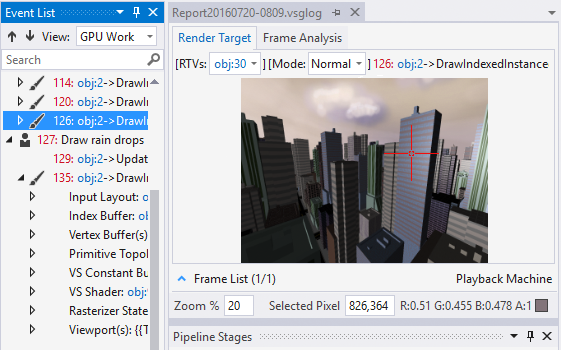
Rendering problems can be very tricky to troubleshoot. Whether it’s a position offset, color incorrectness, or a flickering problem, Visual Studio Graphics Diagnostics, a.k.a. the Visual Studio graphics debugger, provides an easy way to capture and analyze frames from your DirectX 10, 11, or 12 games locally or remotely. You can inspect each DirectX event, graphics object, pixel history, and the graphics pipeline to understand exactly what occurred during the frame. This tool also captures call stacks for each graphics event, making it easy to navigate back to your C++ code in Visual Studio. Learn more about Visual Studio Graphics Diagnostics.
Analyze frame performance
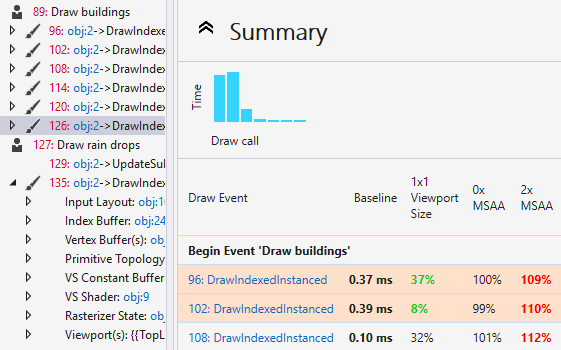
If you are looking for ways to increase the frame rate for your DirectX games, Visual Studio Frame Analysis can be very helpful. It analyzes captured frames to look for expensive draw calls and performs experiments on them to explore performance optimization opportunities for you. The results are presented in a useful report, which you can save and inspect later or share with your team members. For more information on how to use this tool, see blog post Visual Studio Graphics Frame Analysis in action!.
Analyze GPU Usage
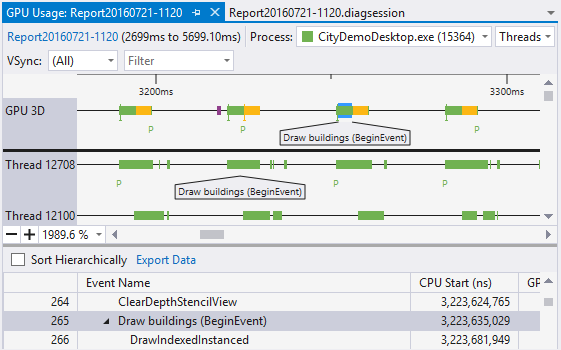
While the Frame Analysis tool can help pinpoint the expensive draw calls, understanding how your game performs on the CPU and the GPU in real-time is essential as well. The Visual Studio GPU Usage tool collects CPU and GPU performance data in real-time, and it complements Frame Analysis that is performed on captured frames in an offline fashion to provide you a complete view of your game performance. By reading the GPU usage detailed report, you can easily identify where the performance bottleneck is, whether it’s on the CPU or the GPU, and help you locate the potential problematic code in the app. This GPU Usage tool in Visual Studio blog post includes a more detailed introduction to the tool.
Unit testing
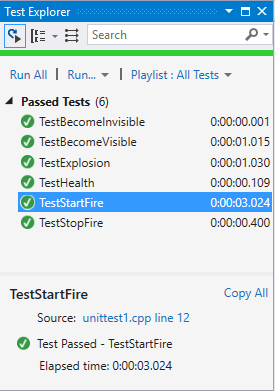
Shipping high-quality games requires good testing. Visual Studio ships with a native C++ unit test framework that you can use to write your unit tests. Add a new unit test project to your solution by clicking on menu New->Project and selecting the Native Unit Test Project template. This automatically adds a test project to your solution. In the created unittest1.cpp file in the unit test project, find TEST_METHOD(TestMethod1) to start adding your test logic code. You can then open the Test Explorer window by clicking on menu Test->Window->Test Explorer to run your tests. Also, take advantage of the built-in code coverage tool (menu Test->Analyze Code Coverage) to understand how much of your code has been covered by your unit tests. This gives you confidence in shipping high-quality games.
Collaborate with your team members
Building a great game usually involves more than one developer. When it comes to source code storing and sharing and cloud build, Visual Studio Team Services has you covered.
Simply sign up for a free Visual Studio Team Services accountthen you can check in the source code of your DirectX game into Visual Studio Team Services. With your code successfully synced, everyone on your team can now check out, edit, and check back in the source code, making collaborating with other team members super-efficient.
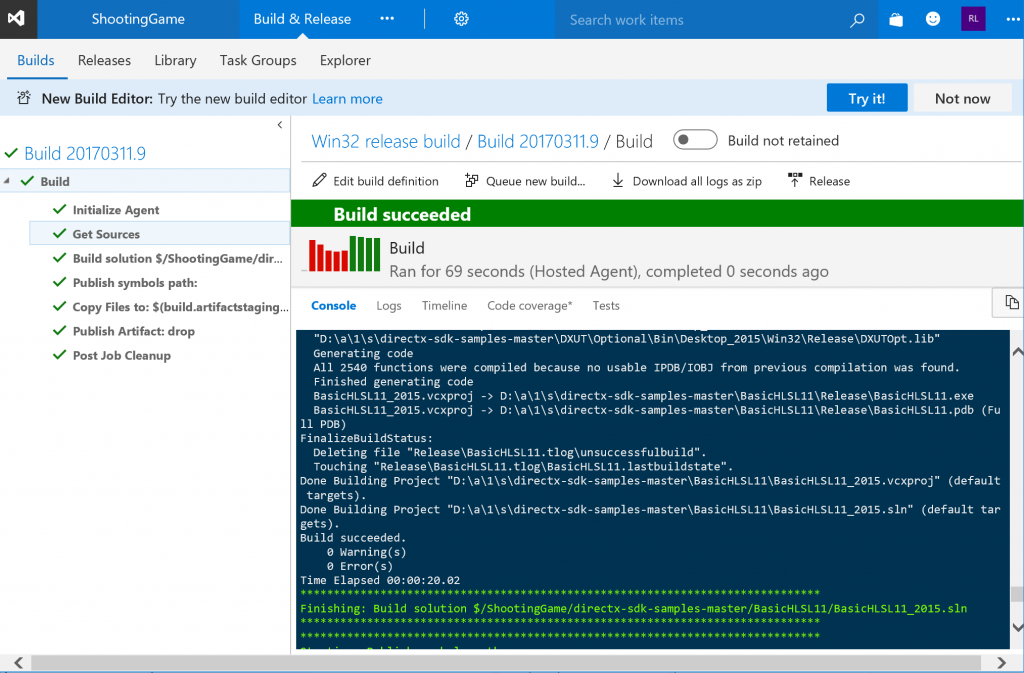
Visual Studio Team Services also simplifies continuous integrations for your games. Create and manage build processes that automatically compile and test your games in the cloud. Wondering if a bug was fixed in this build? By associating work items to code, the work items are listed in the build summary along with code changes and test results.
You can find more details in this blog post Visual Studio for Teams of C++ Developers.
Try out Visual Studio 2017 for C++ game development
Download Visual Studio 2017, try it out and share your feedback. For problems, let us know via the Report a Problem option in the upper right corner of the VISUAL STUDIO title bar. Track your feedback on the developer community portal. For suggestions, let us know through UserVoice.


0 comments