
Debugging is one of the cornerstones of software development, and it can consume a significant portion of a developer’s day. The Visual Studio native debugger provides a powerful and feature-rich experience for finding and fixing problems that arise in your applications, no matter the type of problem or how difficult it is to solve. In fact, there are so many debugging features and tools inside Visual Studio that it can be a bit overwhelming for new users. This blog is meant to give you a quick tour of the Visual Studio native debugger and how it can help you in all areas of your C++ development.
Table of Contents
- Breakpoints and control flow
- Data inspection and visualization
- Diagnostic tools and performance profiling
- Debugging processes and devices
- Multi-threaded debugging
- Edit and continue
- Other resources
Breakpoints and control flow
After you have built your application in Visual Studio, you can start the debugger simply by pressing F5. When you start debugging, there are several commands that can help you to navigate the breakpoints in your application so that you can control the state of the program and the current context of the debugger. These commands give you flexible control over the debugger’s scope and what lines and functions of code you want to investigate.
- Continue with [F5]: Run to the next break point.
- Step over [F10]: Run the next line of code and then break.
- Step into [F11]: Step into the function called on the current line of code.
- Step out [Shift+F11]: Step out of the current function and break at the next executable line after the function call.
When hovering over a breakpoint in your code, you will see two icons appear. The icon on the right with two circles allows you to quickly toggle the current breakpoint on or off without losing the breakpoint marker at this line of code:
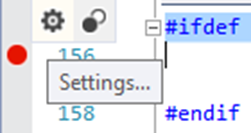
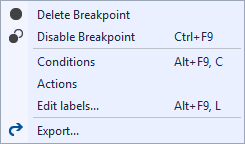
The icon on the left will launch the list of breakpoint options. Here you can add conditions or actions to a breakpoint.
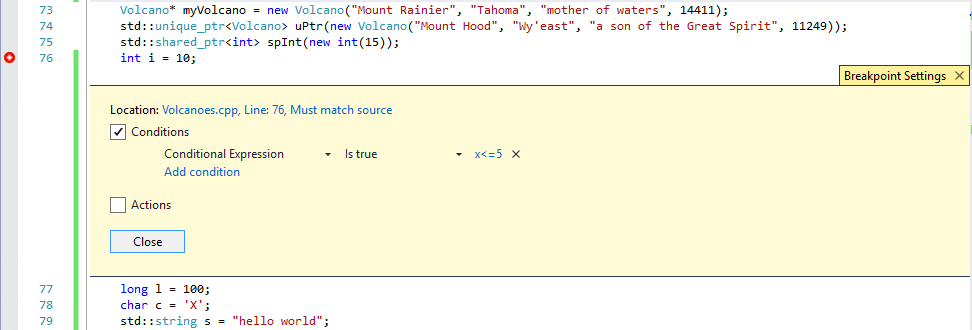
Sometimes you want a breakpoint to be hit only when a certain condition is satisfied, like x<=5 is true where x is a variable in the debugger scope. Conditional breakpoints can easily be set in Visual Studio using the inline breakpoint settings window, which allows you to conveniently add conditional breakpoints to your code directly in the source viewer without requiring a modal window. Notice that conditional breakpoints contain a “+” sign to indicate at least one condition has been added to the breakpoint.
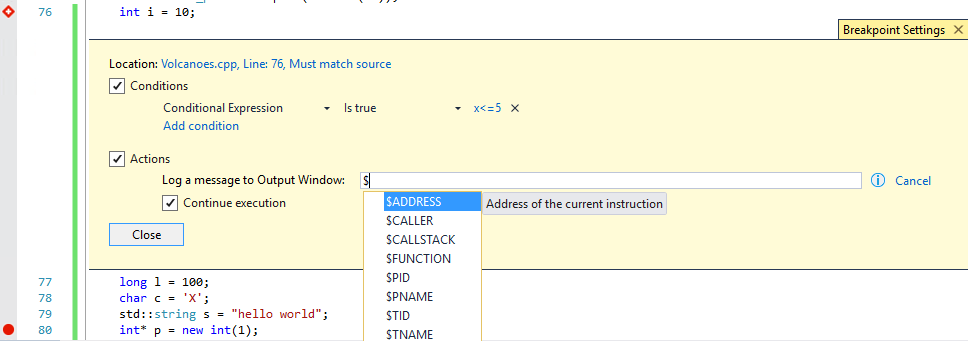
There is also a set of breakpoint actions that can be performed at a breakpoint, like printing the process ID or the call stack. Visual Studio also refers to these as breakpoint actions as “tracepoints”. The inline breakpoint settings window allows you to set a variety of breakpoint actions such as printing the call stack or PID. Notice that when at least one action is assigned to a breakpoint, the breakpoint appears as a diamond shape. In the example below, we have added both a condition and an action to the breakpoint; this makes it appear as a diamond with a “+” sign inside.
Function breakpoints (watch points) will activate when a specified function is encountered by the debugger. Use the Debug menu and select New breakpoint to add a function breakpoint.

Data breakpoints will stop the debugger when a specific address is hit during debugging. Use the Debug menu and select New breakpoint to add a function breakpoint.
Data inspection and visualization
When you are stopped at a breakpoint, the debugger has access to the variable names and values that are currently stored in memory. There are several windows that allow you to view the contents of these objects.
- Locals: The locals window lists all variables currently within the debugger scope, which typically includes all static and dynamic allocations made so far in the current function.
- Autos: This window provides a list of the variables in memory that originate from:
- The current line at which the breakpoint is set.
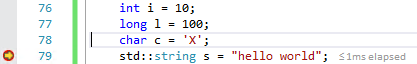
- Note that in the example below, line 79 has yet to execute. The variable is not yet initialized and there is no value for the Autos window to display.
- The previous 3 lines of code. As you can see below, when we are at the breakpoint on line 79, the previous three lines are shown, and the current line awaiting execution has been detected, but the value is not yet available until this line executes.
- Watch: These windows allows you to track variables of interest as you debug your application. Values are only available when the listed variables are in the scope of the debugger.
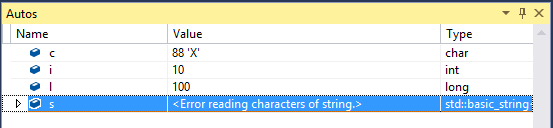
- Quick Watch is designed for viewing the variable contents without storing it in the Watch window for later viewing. Since the dialog is modal, it is not the best choice for tracking a variable over the entire debugging session: for cases like this the Watch window is preferable.
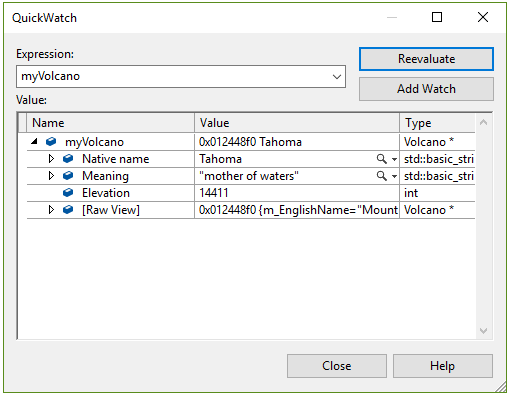
- Memory windows: These provide a more direct view of system memory and are not restricted to what is currently shown in the debugger. They provide the ability to arrange values by bit count, for example 16, 32, and 64. This window is intended primarily for viewing raw unformatted memory contents. Viewing custom data types is not supported here.
Custom Views of Memory
Visual Studio provides the Natvis framework, which enables you to customize the way in which non-primitive native data types are displayed in the variable windows (Locals, Autos, Watches). We ship Natvis visualizers for our libraries, including the Visual C++ STL, ATL, and MFC. It is also easy to create your own Natvis visualizer to customize the way a variable’s contents are displayed in the debugger windows mentioned above.
Creating a Natvis File
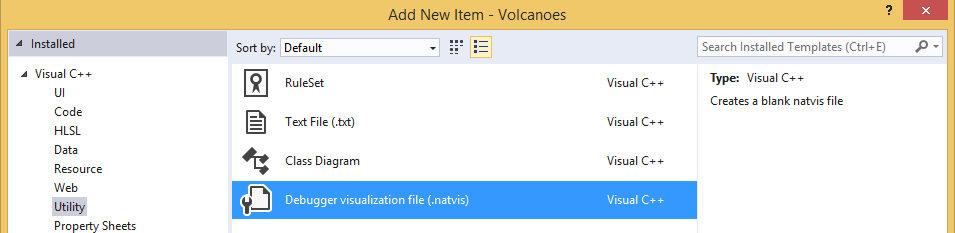
You can add natvis files to a project or as a top-level solution item for .exe projects. The debugger consumes natvis files that are in a project/solution. We provide a built-in template under Visual C++ –> Utility folder for creating a .natvis file.
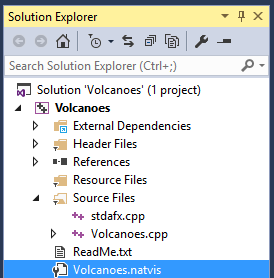
This will add the visualizer to your project for easier tracking and storage via source control.
For more information on how to write .natvis visualizers, consult the Natvis documentation.
Modifying Natvis Visualizers While Debugging
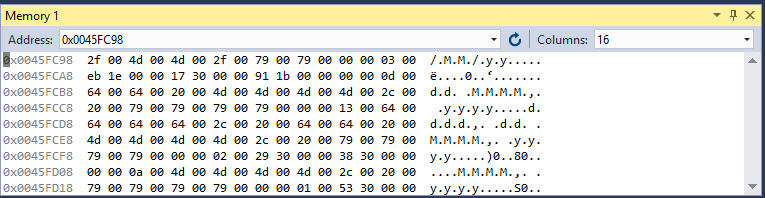
The following animation shows how editing a natvis for the Volcano type will change the debugger display inthe variable windows. The top-level display string for the object is changed the to show the m_nativeName instead of the m_EnglishName. Notice how the changes to the .natvis file are immediately picked up by the debugger and the difference is shown in red text. 
Diagnostic tools and performance profiling
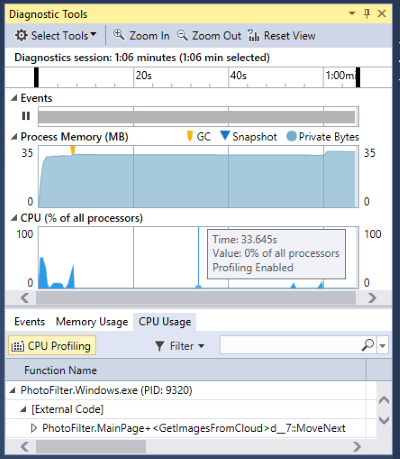
Most profiling tools run in a special mode that is separate from the debugger itself. In Visual Studio, we have added a set of performance and diagnostics tools that can run during debugging and provide more insight into the performance and state of your apps. You can control the flow of the application to get to a problem area and then activate more powerful tools as you drill down into the problem. Instead of waiting around for the problem to happen, you are able to have full control of the program and decide what information you want to analyze, whether it’s how much time a function spends on the CPU, or viewing the memory usage of each allocation by type. The live CPU and memory usage of your application are displayed in the graph and debugger event are indicated along the timeline. There is a tab for using each of the included diagnostic tools: CPU Usage and Memory Usage.
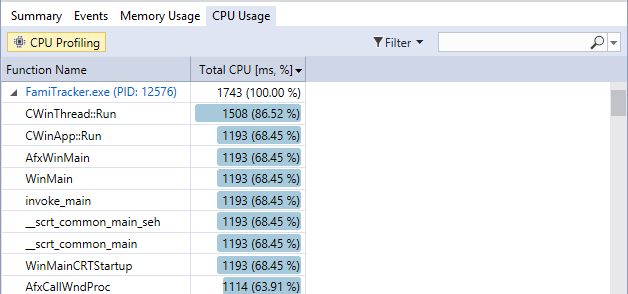
CPU Usage
This tool allows you to view the CPU usage for each function called in a selected time range on the CPU graph. You must enable the tools by clicking the “CPU Profiling” button on the left of this tab in order to select a time range for analysis.
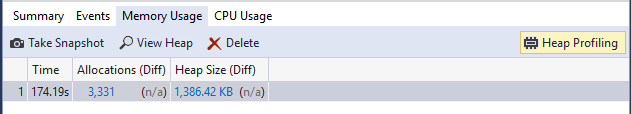
Memory Usage
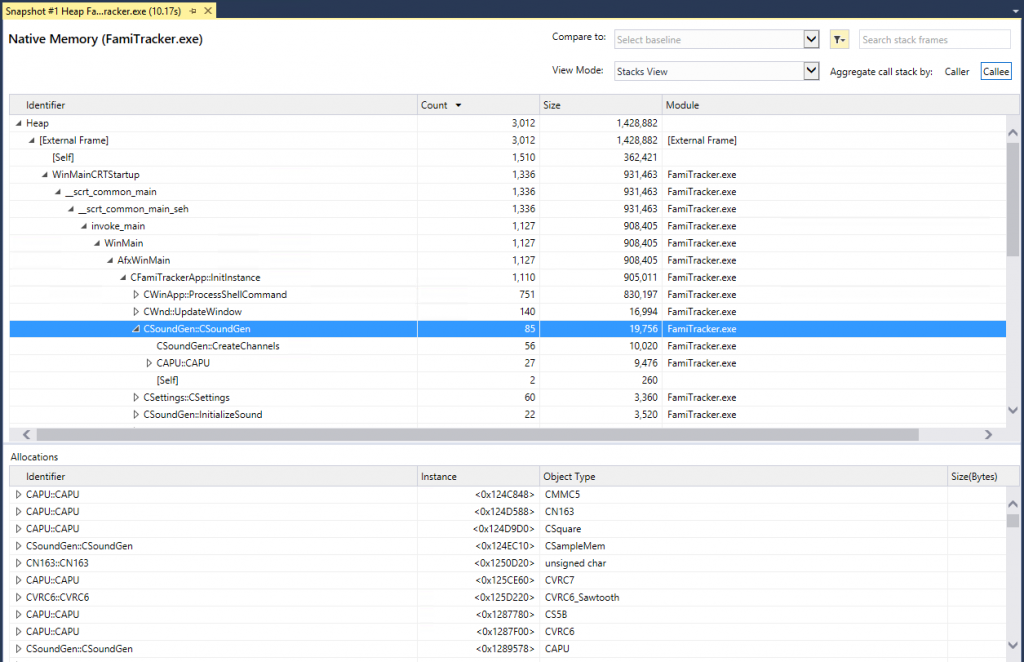
This tool enables you to use the memory profiler, which for native profiling must be enabled using the Heap Profiling button so that you can capture heap snapshots. The button on the left takes a snapshot and you can view the contents of each snapshot by clicking the blue links in the snapshot table.
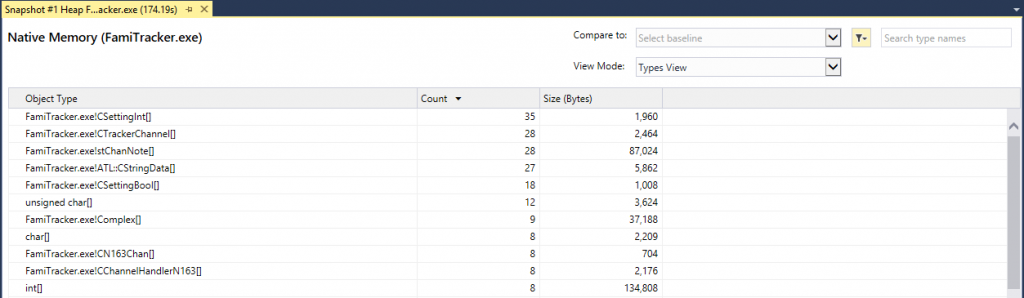
The Types View shows the types that were resolved from the memory snapshot including the count and total memory footprint. You can navigate to the Instances View by double-clicking a line in this view.
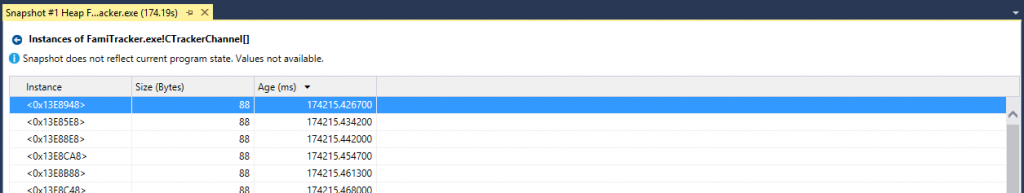
The Instances View shows the types that were resolved from the memory snapshot including the count and total memory footprint. You can navigate to the Instances View by double-clicking a line in this view. You can navigate back to the types view using the back arrow to the left of the type name.
The Stacks View shows the call stack for your program and allows you to navigate through the call path of each captured allocation. You can navigate to the stacks view from the types view by selecting Stacks View in the View Mode dropdown. The top section of this page shows the full execution call stack and can be sorted by callee or caller (in-order or reverse) with the control at the top right called Aggregate call stack by. The lower section will list all allocation attributable to the selected part of the call stack. Expanding these allocations will show their allocation call stack.
Debugging processes and devices
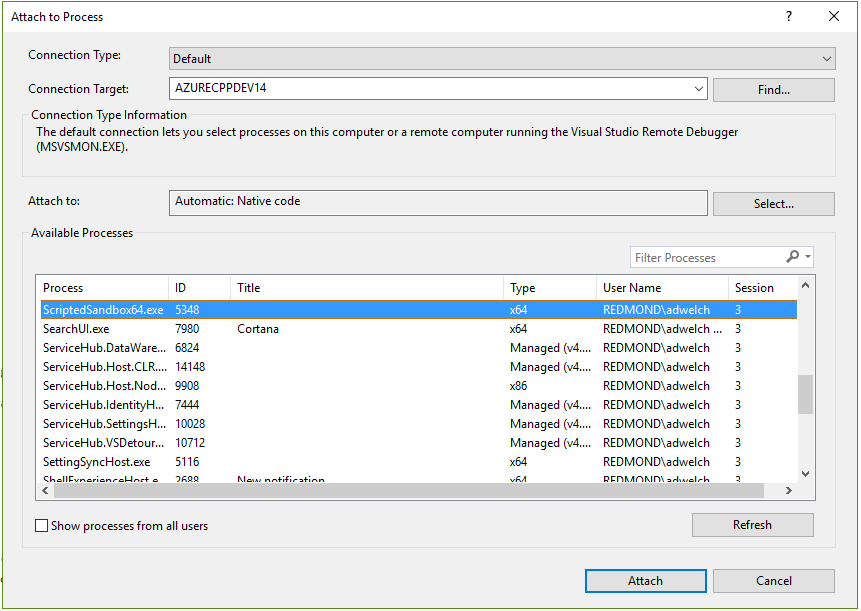
Attaching to Process
Any process running on your Windows machine can be debugged using Visual Studio. If you want to view the variable types, make sure to have the debug symbols loaded for the process that you are attaching to.
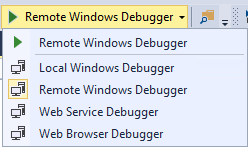
Remote Debugging
To remotely debug into another machine that you can connect to via your network, enable the remote debugger via the debugger dropdown. This allows you to debug into a machine no matter how far away it is, as long as you can connect to it over a network. You can also easily debug applications running on external devices such as a Surface tablet.
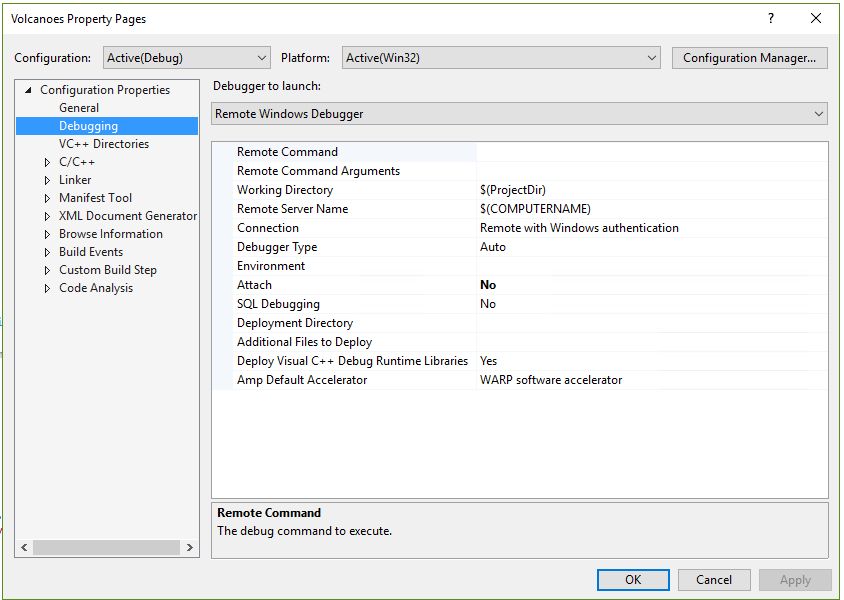
The IP address and connection details can be managed in the debugger property page, accessed using either Alt+Enter or right-clicking the project in the Solution Explorer.
Multi-threaded debugging
Visual Studio provides several powerful windows to help debugging multi-threaded applications. The Parallel Stacks window is useful when you are debugging multithreaded applications. Its Threads View shows call stack information for all the threads in your application. It lets you navigate between threads and stack frames on those threads. In native code, the Tasks View shows call stacks of task groups, parallel algorithms, asynchronous agents, and lightweight tasks.

There is also a Parallel Watch window designed specifically for tracking variables across different threads, showing each thread as a row and each watch (object) as a column. You can also evaluate boolean expressions on the data and export the data to spreadsheet (.csv or Excel) for further analysis.

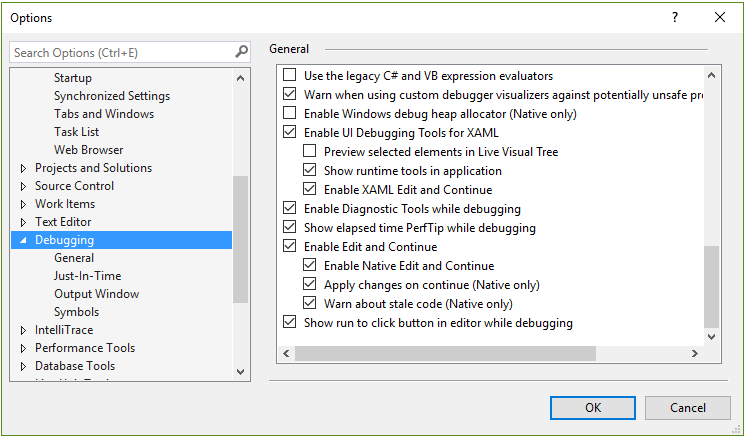
Edit and continue
Edit and continue allows you to edit some sections of your code during a debugging session without rebuilding, potentially saving a lot of development time. This is enabled by default, and can be toggled or customized using the Debugging options, accessible via the Debug menu and selecting Options.
Other resources
If you are interested in some more content and videos about debugging in Visual Studio, check out these links:
Blog posts
- Native memory diagnostics
- Natvis and debugger visualizers
- Edit and Continue Blog Post
Related documentation
Videos
0 comments