


Building C++ code is a complex process, launching many build tools in parallel and often running for a long time. It is always desirable to make it faster, but also a challenge to understand what the most effective way would be to achieve this.
We’d like to share some techniques we use to get a “bigger” picture of the build, as well as tools that can help to see what is taking time in a particular part of the build. We’ll also talk about MSBuild project options which can improve build parallelism without overwhelming the system, as well as other (not immediately obvious) options which might affect build throughput.
This blog is more like a list of what is currently available, full of instructions and details. Some of the suggestions should be useful for any C++ build, but most of the measurements and tuning options are for MSBuild based projects (vcxproj).
As any performance improvement starts with the measurement, here we are – measure your build.
Note that the total build time can vary quite noticeably between several identical builds on the same machine – the system is adjusting to the active processes. So, if you compare builds before and after making some options changes, it is more reliable to run the build several times and get the average. It is also helpful to measure not only the total build time but get more detailed information, so if you get a surprising result, you can figure out why it happened. For MSBuild we recommend running it on the command line and collecting a binary log.
Measure your build time using MSBuild Performance Summary
If your build is MSBuild based, the first thing to do when investigating build performance is to see which projects and which tasks/targets inside the projects are taking most of the build time. The performance summary data is also very useful for comparing builds using different options.
To get a performance summary for your full build, you can do the following: open a Developer (or MSBuild) Command Prompt and run the build of your solution with the following options (replace Configuration and Platform values with the ones your solution actually has):
msbuild /m /t:clean /p:Configuration="Debug";Platform="x86" YourSolution.sln
msbuild  /m /fl  -flp:PerformanceSummary;v=q;LogFile=Perf.log /p:Configuration="Debug";Platform="x86" YourSolution.sln
The “quet” or “minimal” verbosity setting (-flp:PerformanceSummary;v=q) is recommended as console logging itself takes noticeable time. But you can set the verbosity to other levels if you want more build info in the Perf.log. You can also add /detailedSummary to see msbuild.exe nodes utilization).
The same information can be extracted from a binary log. We recommend creating binary logs when investigating your builds. To create a binary log, run:
msbuild /m /t:clean /p:Configuration="Debug";Platform="x86" YourSolution.sln
msbuild /m /bl:build.binlog /p:Configuration="Debug";Platform="x86" YourSolution.sln
To extract the perf info into Perf.log, run:
msbuild -noconlog -flp:PerformanceSummary -flp:v=q  build.binlog
ren msbuild.log Perf.log
You can also enable “Build Timings” for VC projects in the IDE by setting “Tools/Options/Projects and Solutions/VC++ Project Settings/Build Timings” = “Yes”. This will create the Perf Summary for each project, but not for the whole solution build. Thus, using the command line is better to see the “whole picture”.
In the Perf.log you’ll find times (in ms) it took to build the whole solution, each project (in the time increasing order) and commutative time of all targets and tasks (also in the time increasing order). Note that project build time and some targets (like ResolveProjectReferences target) include the wait for referenced projects to be built. You can use the Timeline tab of the binlog viewer to see if other projects were built as a part of a particular project build.
For a solution containing mostly C++ projects, cl and link would usually be the tasks taking most of the time:
Project Performance Summary:
…
1100252 ms d:testMySolution.sln 1 calls solution build time (msbuild /m)
Task Performance Summary:
…
22495731 ms Link 250 calls
152500624 ms CL 250 calls The task time is the sum of all times the task was executing for all projects and thus it can be bigger than the total build time. For CL and Link tasks their time is very close to the cl.exe and link.exe time.
Use Build Insights to see the build timeline for cl.exe and link.exe
Most of the C++ builds time is usually spent in the compiler. To visualize what is going on during the build, see the processes running in parallel and pivot on the parts that take most of the time, you can use the Build Insights tool.
Change options to improve C++ build throughput
There are many parameters which can affect build throughput and different codebases can benefit from different sets of options. Here we’ll talk about antivirus and project settings which are easy to change and which can potentially greatly improve your build throughput.
1. Check your antivirus settings
C++ builds produce a lot of intermediate files and we often see the file system as a bottleneck there. With your antivirus scanning all build outputs, the problem is greatly amplified.
Windows Defender Antivirus automatically excludes most of the common build tools when they are found in the default install locations. But if you install Visual Studio in a custom location or use many additional build tools, your build throughput might be affected.
To see if Windows Defender scans are impacting your build, you can use Performance Analyzer for Microsoft Defender Antivirus. The tool collects minimal data so you can run it for a good chunk of your build (10-20 min is usually enough) if not the whole build. We recommend closing all application unrelated to the build before collecting the data to avoid seeing unrelated to build processes in the report.
To collect the data and see the affected build processes:
- Open a Windows PowerShell and run:
New-MpPerformanceRecording -RecordTo MyBuild.etl - Rebuild your code in the IDE or on the command line
- After the build is finished (or after 10-20 min) go back to the PowerShell and stop the recording by hitting any key
- In PowerShell run
Get-MpPerformanceReport -TopProcesses:20 MyBuild.etlThis will give you the list of the affected processes, similar to the following one:
TopProcesses
============

Count TotalDuration MinDuration AverageDuration MaxDuration MedianDuration ProcessPath
----- ------------- ----------- --------------- ----------- -------------- -----------
8193  62272.1020ms    0.1790ms        7.6006ms  119.5682ms       6.8465ms   D:Visual Studio 17VCToolsMSVC14.30.30528binHostx64x86cl.exe
1068  14587.9547ms    3.2531ms       13.6591ms 927.2716ms       6.0416ms    D:Visual Studio 17VCToolsMSVC14.30.30528binHostx64x86link.exe
…
You can add the build tools from the trusted locations to the excluded files or directories list in the Windows Defender settings.
2. Redefine TMP directory.
During compilation, cl.exe creates a tmp file per each source in the TMP folder. When many cl.exe processes are running in parallel and simultaneously creating a lot of files in the same folder it creates a lot of stress for the file system.
Using different TMP folders for different projects (and preferably not on the system drive) often makes the build faster, especially on powerful machines with many CPUs where disk I/O and file system are more often a bottleneck.
We are planning to address this problem in the future VS releases, but meanwhile you can redefine the TMP environment variable to be different for different projects. See the proposed Directory.Build.props sample at the end of the blog.
3. Tune build options for better parallelism.
Many C++ build operations support parallel execution. A general assumption is that the build should be faster when more build operations are running in parallel. This is true, but only to a point when the build is not overwhelming the system capacity to distribute machine resources between processes and threads.
Most of the build tools are heavy users of CPU, memory, and the file system. Depending on the number of source files, their size, and content, any of these components can be a bottleneck preventing the build from being faster when more tools are running in parallel. When a resource limit is hit, running more build operations in parallel will make the build slower, rather than faster, sometimes significantly. For instance, the msbuild /m + cl /MP resource overuse problem has been known for quite some time, but recently became more frequent as more and more computers have 32+ logical CPUs.
The problem of optimal build parallelism is quite complex as it is hard to predict up front the resource usage of a particular build operation and pretty much impossible to predict actual resource availability for the whole time of that build operation. But some heuristics can be used, at least for the number of running processes and threads.
MSBuild Resource Manager
In VS 2019 16.10, MSBuild introduced cross-process resource management, which allows build parts (tasks) of different projects communicating their anticipated CPU usage and limiting this usage if resources are already reserved by other build parts. All C++ build tasks that launch several processes (like cl.exe or custom build tools) or the ones that are known to use many threads (like link.exe) participate in this communication.
The MSBuild Resource Manager support in VC projects is available in VS 2019 16.11 and later. In VS 2022 17.0 it was turned on by default, but we found that this negatively impacts build throughput in some codebases, so in 17.2 we turned it off to avoid this. To activate it the following property should be defined as an environment variable or as an MSBuild property for all projects (see Directory.Build.props sample):
set UseMSBuildResourceManager=true
If you don’t use /MP for your build currently, turn it on and give it a try. To affect all projects, define the following property as an environment variable or as an MSBuild property for all projects (see Directory.Build.props sample):
set CL_MP = true
By default, the MSBuild Resource Manager will allow maximum 2*(number of CPU cores) to be used simultaneously by all project’s tasks. The 2x cores (instead of just 1x) limit is partially dictated by the current MSBuild scheduler architecture, but also seems to allow better build throughput on average. Most of the time the build will use less than 2xCPUs and when it does, the system usually tolerates 2x CPU oversubscription quite well unless bottlenecks other than the CPU are hit by the build (see Many Cores Machines section).
There are also a couple of “knobs” to try if the default behavior is not good enough.
In addition to setting the maximum number of projects allowed to be built in parallel (msbuild /m:nProjects), you can set the following environment variables (cannot be MSBuild properties) to modify the behavior:
MSBUILDCORELIMIT=Nwhere N is the max number of cores to be given to one project. By default it’s the number of logical CPUs on the machineMSBUILDNODECOREALLOCATIONWEIGHT= [0 – 100]0% means that MSBuild nodes don’t consider using CPUs and 100% means that each MSBuild node would be considered using 1 CPU. In C++ builds, MSBuild processes CPU usage is small comparing to the compiler CPU usage, so 0 should be OK. But for mixed C# and C++ solutions it probably should be set to something between 50 and 100.
If for some reason building with the MSBuild Resource Manager is slower for your build and you don’t want to experiment with other options, you can disable it by setting UseMSBuildResourceManager as false.
MultiToolTask (MTT)
Other options which can be used to limit the number of cl.exe processes running in parallel are described in Improve Parallelism in MSBuild.
To activate MTT mode set the following properties as environment variables or as MSBuild properties for all projects (see also the Directory.Build.props sample below):
set UseMultiToolTask=true
set EnforceProcessCountAcrossBuilds=true
This will make the build launch a separate cl.exe process for each C/C++ source and limit the number of simultaneously running cl processes (across all project builds) to CL_MPCOUNT, which is by default set to the number of logical processors.
MultiToolTask mode can be also used together with the MSBuild Resource Manager. This might be beneficial for some builds as instead of asking the MSBuild Resource Manager for available resources only once before launching the top-level cl.exe /MP, the build will ask it before launching cl.exe for each source file.
Note, that for projects with many small and simple C/C++ files (i.e., when individual file compilation is not taking a long time), launching a separate cl.exe processes for each file would bring a noticeable overhead. So, this option is recommended to use when most of the source files are relatively large and complex.
In VS 2022, the new experimental “ClServer” mode has been added to address the process creation overhead in MTT mode by using server-client model similar to cl.exe /MP. The server would spawn worker cl.exe processes, then dispatch work via IPC. The server resides in MSBuild process so is in-sync with the resource manager while scheduling work dynamically—allocating more workers or freeing resources to scaling down to deal with “long pole” compiles.
To enable this mode the following property should be defined as an environment variable or as an MSBuild property for all projects (see Directory.Build.props sample below):
set EnableClServerMode=true
Increase build parallelism for native C++ projects (experimental)
This option is experimental and works only for command line builds currently (not supported for the IDE build).
By default, if project B is referencing project A, the build of project B will not start until project A’s build is finished. This makes sense for managed projects where assemblies must exist before they can be used as references in the compilation.
But native C++ code compilation usually does not use any build outputs from the referenced projects, only the linker does. Even with C++20 modules, where compilation does use the build outputs (modules) from the referenced projects, it only needs to wait for the referenced project compilation step to finish but does not need to wait for the link to be complete.
To allow the compilation step of the referencing projects to start as soon as the compilation step of the referenced projects is finished:
set BuildPassReferences=true
As these options would allow more build parts running simultaneously, make sure to enable the MSBuild Resource Manager and/or MultiToolTask with EnforceProcessCountAcrossBuilds.
The command line should look like:
msbuild /p:Configuration=Debug;Platform= x64 /t:BuildGenerateSources;BuildCompile;BuildLink solution.sln
How it works:
By default, MSBuild starts project build execution after all projects it references finish building. Each VC project build consists of BuildGenerateSources, BuildCompile and BuildLink targets executed one after another. They are historically called “build passes”.
The default build timeline for two projects where ProjectB is referencing ProjectA looks like

When BuildPassReferences is set to true, a project B’s BuildGenerateSources target will be executed as soon as project A’s BuildGenerateSources target finish building. The project B’s BuildCompile target will wait for project B’s BuildGenerateSources target to finish executing, as well as project A’s BuildCompile targets. Similarly, a project B’s BuildLink target will wait for project B’s BuildCompile target and project A’s BuildLink target.
So, with BuildPassReferences = true, the build timeline would look like

4. Tune sources, includes and precompiled headers (PCH)
To see which sources are taking most of the compiler time, use Build Insights. This tool will help you to see if adding a particular include to the pch would save a lot of compilation time. It will also allow you to view the build timeline.
Check the following blog post for adjusting PCH files: Precompiled Header (PCH) issues and recommendations
If your files are well isolated, you can also try using Unity(Jumbo) builds: Support for Unity (Jumbo) Files in Visual Studio 2017 15.8 (Experimental)
5. Special considerations for machines with 64+ CPUs
The following recommendations are based on the build time measurements performed on a 192 cores Windows Server machine.
- If you are running Windows Server 2016 on such a machine, it is highly recommended to upgrade it to WS2019. WS2016 was not optimized for launching many (64+) instances of the same exe, which resulted in poor performance of 64+ cl.exe running together.
- When using Windows Server 2019, make sure that antivirus check is not affecting your build and TMP directory is redefined (i.e. follow recommendations #1 and #2 of this blog, see the chart below).
- The build is likely to hit file system and disk I/O bottleneck when running a lot of build tools in parallel. If you’ve adjusted your build options for the best parallelism (#3), but still see low CPU utilization during build, it is likely that build is hitting a bottleneck other than CPU. Try limiting the number of projects running in parallel, as well as setting
MSBUILDCORELIMITto a lower number – this might actually improve your build throughput.
In one of our tests, we’ve built a generated solution containing 250 projects, 250 cpp files each, with no project references. The C++ code was also generated and, admittedly, quite simple, containing one class per file, up to 30 methods each.
The following chart shows build times of this solution with different system and TMP options.
Each bar corresponds to the msbuild /m:[nProjects] build time, no other options were set. As the test projects did not have any project references, that was enough to achieve best parallelism.
Each series contains build times when number of projects built in parallel (and thus max number of cl.exe instances running together) was 10, 20, 30, 40, 60, 80, 100, 120, 140, 160, and 180.
The system/TMP setting for each series are:
- WS2016 Default settings
- WS2019 Default settings, custom VS install location (Defender on, no exclusions, default TMP folder
c:users[username]AppDataLocalTemp) - WS2019* Build tools are excluded from the Defender scan. Default TMP folder, not excluded from Defender scan.
- WS2019** Build tools and default TMP folder are excluded from the Defender scan
- WS2019*** Build tools are excluded from the Defender scan, TMP is set to project specific location, different for each project.
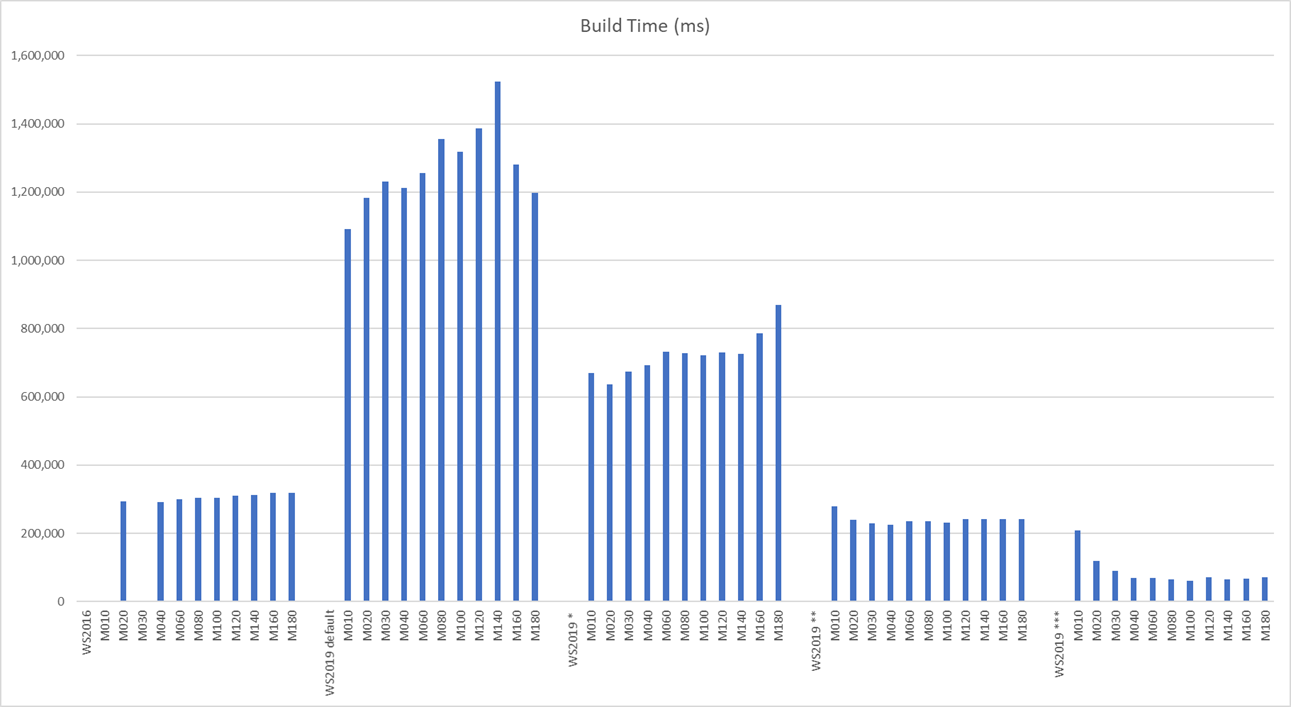
Note that in all series, build time did not improve much (and even got worse) when building more projects in parallel after some point. For this particular solution, building just ~40 projects in parallel showed the best results.
We’ve also tested other generated solutions with different number of projects, longer code, project references, etc. We also used different build options, especially the ones we recommend using in section#3. The trends were quite similar, though the optimal number of parallel processes might differ.
The “real” code compilation usually takes much longer than the compilation of our small and simple generated files, so File System bottleneck might be not so pronounced there. But changing the antivirus and TMP settings improved the build times there as well, though not as much.
Directory.Build.props sample to set options for all projects
Create Directory.Build.props in the root directory to affect all projects under this root.
This is a sample content of Directory.Build.props you can use to try different build settings.
<?xml version="1.0" encoding="utf-8"?>
<Project>
  <PropertyGroup>
    <!-- To enable project specific directory for temporary files. -->
    <UseProjectTMPDirectory>true</UseProjectTMPDirectory>

    <!-- To enable MSBuild Resource Manager in VS 2019 16.11 (on by default in VS 2022) -->
    <UseMSBuildResourceManager>true</UseMSBuildResourceManager>

    <!-- Uncomment to enable MultiToolTask (MTT) mode. -->
    <!--<UseMultiToolTask>true</UseMultiToolTask>
      <EnforceProcessCountAcrossBuilds>true</EnforceProcessCountAcrossBuilds>-->

    <!-- Uncomment to enable experimental MTT ClServer mode, available in VS 2022. -->
    <!--<EnableClServerMode>true</EnableClServerMode>-->

    <!-- Uncomment and change the value to control the maximum number of cl.exe processes running in parallel.
         If using MTT without MSBuild Resource Manager, 10-20% oversubscription is often beneficial. -->
    <!--<CL_MPCount>20</CL_MPCount>-->

    <!--Uncomment to allow executing more build operations in parallel-->
    <!--<BuildPassReferences>true</BuildPassReferences> -->
  </PropertyGroup>

  <ItemDefinitionGroup>
    <!--  Enable parallel compilation (cl.exe /MP) -->
    <ClCompile>
      <MultiProcessorCompilation>true</MultiProcessorCompilation>
    </ClCompile>
    <!--  Enable parallel execution of a custom build tool-->
    <CustomBuild>
      <BuildInParallel>true</BuildInParallel>
    </CustomBuild>
  </ItemDefinitionGroup>

  <!-- Define project specific directory for temporary cl.exe files -->
  <Target Name="SetProjectTMPDirectory"
        BeforeTargets="BeforeClCompile"
        Condition="'$(DesignTimeBuild)' != 'true' and '$(UseProjectTMPDirectory)' == 'true'">
    <PropertyGroup>
      <OriginalTmp>$(TMP)</OriginalTmp>
    </PropertyGroup>
    <MakeDir Directories="$(IntDirFullPath)TMP"/>
    <SetEnv Name ="TMP"
            Value ="$(IntDirFullPath)TMP"
            Prefix ="false">
    </SetEnv>
  </Target>

  <!-- Restore TMP directory for other tools to avoid incremental build problems -->
  <Target Name="RestoreTMPDirectory"
          BeforeTargets="AfterClCompile"
          Condition="'$(DesignTimeBuild)' != 'true' and '$(UseProjectTMPDirectory)' == 'true'" >
    <SetEnv Name ="TMP"
            Value ="$(OriginalTmp)"
            Prefix ="false">
    </SetEnv>
  </Target>
</Project>
Send Us Feedback
Build is a complex process, and its performance depends on many factors and circumstances. Building different codebases on different hardware would benefit from different build settings. We hope you can try some of the options described in the blog and see if they improve your build time.
If you try any suggestions, please let us know, we love to hear from you! You can leave your comments below or email us at visualcpp@microsoft.com.
Great article! When talking about “IDE build”, do you also mean building with “devenv.exe /build” or only building with VS UI?
Hi Christian,
By IDE build I mean building inside devenv.exe, i.e. both command line and UI. Devenv has its own build manager, different from msbuild build manager and we don’t have the “Increase build parallelism for native C++ projects” working with it yet.
Very nice and useful suggestions, +1 for the practical examples!
I checked, these settings work also with Cmake projects, if you put the .props file in the build directory!