

C++ builds should always be faster. In Visual Studio 2019 16.2, we’ve shown our commitment to this ideal by speeding up the linker significantly. Today, we are thrilled to announce a new collection of tools that will give you the power to make improvements of your own. If you’ve ever had time for breakfast while building C++, then you may have asked yourself: what is the compiler doing? C++ Build Insights is our latest take at answering this daunting question and many others. By combining new tools with tried-and-tested Event Tracing for Windows (ETW), we’re making timing information for our C++ toolchain more accessible than ever before. Use it to make decisions tailored to your build scenarios and improve your build times.
Getting started
C++ Build Insights makes use of vcperf, a tool that allows you to capture a trace of your build and to view it in the Windows Performance Analyzer (WPA). The latest version of vcperf is available in Visual Studio 2019, but WPA must be obtained separately.
1. Follow these steps to obtain and configure vcperf and WPA:
- Download and install the latest Visual Studio 2019.
- Obtain WPA by downloading and installing the latest Windows ADK.
- Copy the perf_msvcbuildinsights.dll file from your Visual Studio 2019’s MSVC installation directory to your newly installed WPA directory. This file is the C++ Build Insights WPA add-in, which must be available to WPA for correctly displaying the C++ Build Insights events.
- MSVC’s installation directory is typically:
C:\Program Files (x86)\Microsoft Visual Studio\2019\{Edition}\VC\Tools\MSVC\{Version}\bin\Hostx64\x64. - WPA’s installation directory is typically:
C:\Program Files (x86)\Windows Kits\10\Windows Performance Toolkit.
- MSVC’s installation directory is typically:
- Open the perfcore.ini file in your WPA installation directory and add an entry for the perf_msvcbuildinsights.dll file. This tells WPA to load the C++ Build Insights add-in on startup.
You can also obtain the latest vcperf and WPA add-in by cloning and building the vcperf GitHub repository. Feel free to use your built copy in conjunction with Visual Studio 2019!
2. Follow these steps to collect a trace of your build:
- Open an elevated x64 Native Tools Command Prompt for VS 2019.
- Obtain a trace of your build:
- Run the following command:
vcperf /start MySessionName. - Build your C++ project from anywhere, even from within Visual Studio (vcperf collects events system-wide).
- Run the following command:
vcperf /stop MySessionName outputFile.etl. This command will stop the trace, analyze all events, and save everything in the outputFile.etl trace file.
- Run the following command:
- Open the trace you just collected in WPA.
At the crux of the matter with the Build Explorer
Central to understanding a build is having an overview of what happened through time. The Build Explorer is a core element of C++ Build Insights that we designed for this purpose. Drag it from the Graph Explorer panel on the left onto the main analysis window in WPA. Use it to diagnose parallelism issues, detect bottlenecks, and determine if your build is dominated by parsing, code generation, or linking.
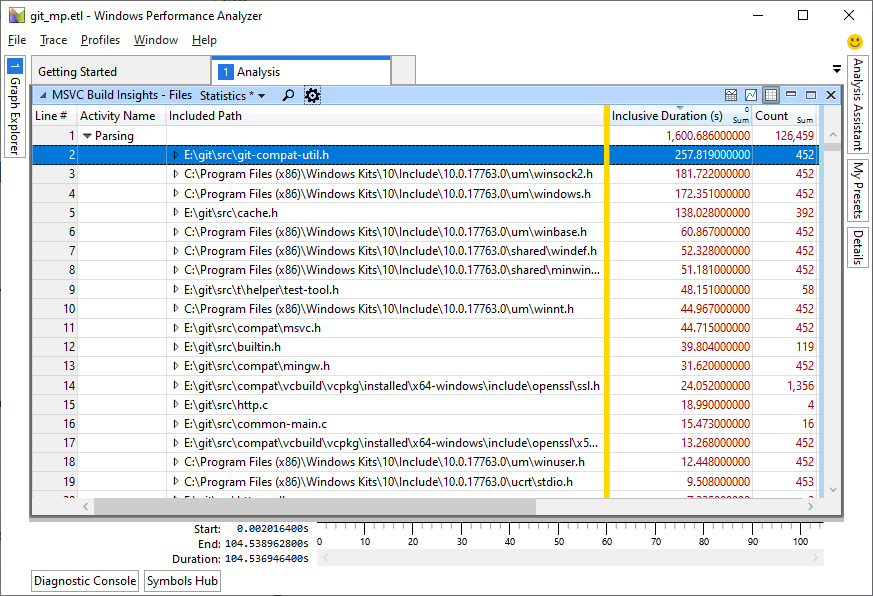
A thousand scoffs for the thousand cuts: aggregated statistics
The most insidious of build time problems are the ones that strike you little by little until the damage is so large that you wonder what hit you. A common example is the repetitive parsing of the same header file due to its inclusion in many translation units. Each inclusion may not have a large impact by itself but may have devastating effects on build times when combined with others. C++ Build Insights provides aggregated statistics to assist you in warding off such threats. An example of this capability is illustrated below, where file parsing statistics are aggregated over an entire build to determine the most time-consuming headers. To view this information for your build, choose the Files view from the Graph Explorer panel on the left in WPA. Drag it to the analysis window.
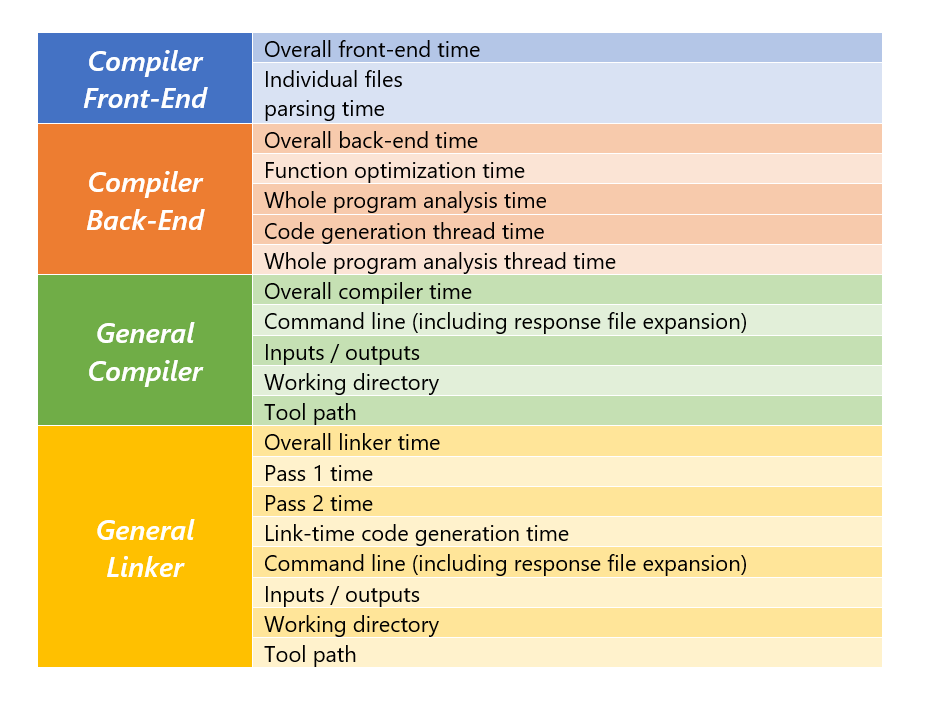
What information can you get?
With C++ Build Insights, expect to be able to obtain the following information for all your compiler and linker invocations.
Tell us what you think!
Download your copy of the latest Visual Studio 2019, and get started with C++ Build Insights today! For a complete set of documentation, see the Get started with C++ Build Insights page.
In this article, we shared two features with you, but there is much more to come! Stay tuned for more blog posts detailing specific ways in which you can use C++ Build Insights to improve your builds.
We look forward to hearing from you on how you used vcperf and WPA to understand and optimize your builds. Are there any other pieces of information you would like to be able to get from C++ Build Insights? Tell us what you think in the comments below. You can also get in touch with us at visualcpp@microsoft.com, or on Twitter @VisualC.
Hello, World.
I don't see Build Explorer. Under Graph Explorer, I see System Activity/Images, Generic Events, Regions, Threads, and Computation/CPU/DPC/Flame/etc..
I am not using "Preview", I am using Professional, so I had to splice together various blog posts.
I have this file C:\Users\..me..\Documents\Visual Studio 2019\..my proj..\Projects\packages\Microsoft.Cpp.BuildInsights.1.0.0\wpa\x64\perf_msvcbuildinsights.dll
I added perf_msvcbuildinsights.dll to C:\Program Files (x86)\Windows Kits\10\Windows Performance Toolkit\perfcore.ini
I vcperf /start MySessionName
Then rebuilt my proj...
Then I vcperf /stopnoanalyze MySessionName outputTraceFile.etl (because https://docs.microsoft.com/en-us/cpp/build-insights/reference/sdk/overview?view=vs-2019: "Important Use the /stopnoanalyze command when stopping your trace with vcperf. You can't use the C++ Build Insights SDK to analyze traces stopped by the regular...
Hello ITISAGLN,
Sorry for the confusion about the /stopnoanalyze command. This command is only used to analyze traces programmatically via the SDK. You should use the regular /stop command if you are going to view a trace in WPA, even if the perf_msvcbuildinsights.dll file comes from the NuGet package.
I hope this helps! Please let me know if you are still having problems.
Thanks, Kevin. I was originally using /stop. Build Explorer didn’t show so I went looking for answers and apparently landed on wrong one (/stopnoanalyze command). I just repeated your steps 1-3 and there is no Build Explorer; Only Graph Explorer (subcategories are System Activity and Configuration). Any idea on what I should try next to see Build Explorer?
This could be caused by the following:
1. Using an unsupported toolset. Events are only present in Visual Studio 2017 version 15.7 and above. The build that you are tracing must be using at least this toolset.
2. The WPA add-in was not installed correctly. Try opening WPA and click on Window -> Select Tables. Search for the Diagnostics category and you should see 4 C++ Build Insights views listed there. Do you see that? If not, you might want to try reinstalling the WPA add-in.
Based on your description I think your problem might be #1. Could you please confirm your...
This tool looks like exactly what C++-ers need. Nice job. My first discovery for my project is a sad one and reveal architectural issues. The number one included file is a god-class. I knew it did too much but did not know it’d be #1 by as much as it is…I’m going to break it down. Thanks for this tool and I’ll keep using it!
You’re welcome! Please let us know if you have any feedback or feature suggestions.
It’s now working. I had perf_msvcbuildinsights.dll in wrong location (some where under C:\ProgramData\…)
Thank you.
Great! Thanks for letting us know! Please feel free to share any other feedback about the tool.
I am on Version 16.5.5.
My WPA does not have Window/Tables; only New Analysis View, New Comp. Analysis View, Duplicate View, Rename View, Close View, Close All Views, Diagnostic Console, Details, Analysis Assistant, My Presets, Go Back to Analysis.
I see and clicked “Diagnostic Console”:
Error: Could not load add-in: perf_msvcbuildinsights.dll. Exception: ..
WUT?
It’s here: I copied C:\Users\..me..\Documents\Visual Studio 2019\..my proj..\Projects\packages\Microsoft.Cpp.BuildInsights.1.0.0\wpa\x64\perf_msvcbuildinsights.dll -> C:\Program Files (x86)\Windows Kits\10\Windows Performance Toolkit
I’ll try reinstalling WPA…
Thanks!
Looks very useful and would like to try it. unfortunately, I can't start the tracing.
Microsoft (R) Visual C++ (R) Performance Analyzer 1.2.19101801
Starting tracing session MySession...
Failed to start trace.
A trace that is currently being collected on your system is preventing vcperf from starting a new one. This can occur if you forgot to stop a vcperf trace prior to running the start command, or if processes other than vcperf have started ETW traces of their own. Please try running the vcperf /stop or /stopnoanalyze commands on your previously started traces. ...
- Never started a traceRead more
Hi Tim,
Collection can also be prevented if something on your system is currently collecting a kernel trace. A kernel trace would show up in your ‘tracelog -l’ as NT Kernel Logger. You can stop this one by running the ‘xperf -stop’ command, though I would first try to understand why a kernel trace is being collected to begin with.
Please let me know if you need more help with this.
Thanks,
Kevin
When the WPA with this feature will get out of testing? I don’t want to become an insider to use it…
Hi Nikolay,
The vcperf GitHub repository has instructions on how to obtain the C++ Build Insights WPA add-in without enrolling in the Windows Insider program.
I followed the instructions and mytrace.etl does not contain any information about the build.
Hi Vaclav,
When this happens it's typically due to one of the following reasons:
1. The wrong version of WPA is used. Make sure you download the one from the ADK preview which contains the C++ Build Insights plugin. You can download it here: https://www.microsoft.com/en-us/software-download/windowsinsiderpreviewADK
2. The C++ Build Insights views are disabled in WPA. To enable them, select Windows --> Select Tables, and check all C++ Build Insights views under the Diagnostics category. Restart WPA.
3. The version of the MSVC toolset being traced is too old and does not support C++ Build Insights. Make sure you are using the C++...