

One of four parts
Welcome to part 2 of a four-part series on Supply Chains and Graph Databases. Each part explores different concepts that build upon the examples discussed in the other parts. You can use the following links to navigate directly to each part of the article.- Part One: Understanding Supply Chains
- Part Two: Enabling SQL Graph ⬅️ You are here.
- Part Three: Reaping Graph Rewards
- Part Four: Visualizing a Graph
Part 2: Enabling SQL Graph
Creating tables
In Azure SQL, nodes and edges are tables, emphasizing the simplicity of the process. When creating these tables, you append “AS NODE” and “AS EDGE” respectively to their create statements. The engine takes care of the rest, generating the necessary columns behind the scenes to enable graph functionality. In practical terms, nothing else changes. These tables function like any other tables, but they are ready for graph operations.
CREATE TABLE Plant (Id INT, Name VARCHAR(50)) AS NODE;
CREATE TABLE Product (Id INT, Name VARCHAR(50)) AS NODE;
CREATE TABLE Warehouse (Id INT, Name VARCHAR(50)) AS NODE;
CREATE TABLE Store (Id INT, Name VARCHAR(50)) AS NODE;

CREATE TABLE produces AS EDGE;
CREATE TABLE delivers_to (Miles INT NOT NULL) AS EDGE;
CREATE TABLE ships_to (Miles INT NOT NULL) AS EDGE;
CREATE TABLE stocks (Miles INT NOT NULL) AS EDGE;
Read more at: SQL Graph CREATE TABLE Online Documentation
Interestingly, edge tables can have zero custom columns, representing an edge in your graph without any custom properties. It is unique in SQL to have a table with zero columns, made possible by the “ON EDGE” notation.
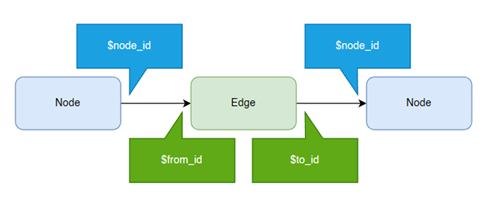
How does it work? These tables have graph columns under the hood. A node has $node_id, and an edge has, at a minimum, two: $from_id and $to_id. Each column is autogenerated and graph specific. We’ll look into more details about these special columns later.
ALTER TABLE produces ADD CONSTRAINT EC_PRODUCES CONNECTION (Plant TO Product)
ALTER TABLE delivers_to ADD CONSTRAINT EC_DELIVERSTO CONNECTION (Plant TO Warehouse)
ALTER TABLE ships_to ADD CONSTRAINT EC_SHIPSTO CONNECTION (Warehouse TO Warehouse)
ALTER TABLE stocks ADD CONSTRAINT EC_STOCKS CONNECTION (Warehouse TO Store)
Read more at: SQL Graph EDGE CONSTRAINT Online Documentation
An edge represents the relationship between two nodes. Like any data in SQL, referential integrity ensures that data engineers use tables correctly and that the data can be trusted. With edge constraints, SQL restricts which nodes an edge can reference. For example, “Plant-(produces)->Product” works, but “Plant-(produces)->Store” does not. These constraints are optional, similar to foreign key constraints in SQL Server. However, having a mechanism to help ensure data quality can be beneficial.
Inserting data
Inserting data into a graph table follows the same principles as inserting data into any other table. That said, inserting into an edge table is a bit unique. SQL Graph has three special columns across nodes and edges, each prefixed with a dollar sign. For nodes, the node key is represented by $node_id. As for edges, they have $from_id and $to_id. The edge columns define the “To” and “From” nodes, respectively. It may require some finesse in data engineering to write clean edge queries, but it is achievable.
INSERT INTO Plant VALUES (1, 'TX'), (2, 'CO'), (3, 'KS'), (4, 'NM')
INSERT INTO Product VALUES (1, 'Fish Tank'), (2, 'Dog House'), (3, 'Bird House')
INSERT INTO Warehouse VALUES (1, 'NM'), (2, 'MN'), (3, 'WY'), (4, 'MO')
INSERT INTO Store VALUES (1, 'KS'), (2, 'AR'), (3, 'AZ'), (4, 'NE')

INSERT INTO produces ($from_id, $to_id)
SELECT (SELECT $node_id FROM Plant WHERE Id = 1),
       (SELECT $node_id FROM Product WHERE Id = 1)
Read more at: SQL Graph INSERT DATA Online Documentation
One more question
You may be wondering about the additional data related to products, which typically goes beyond just an ID and name. That’s true. However, in this graph, the graph tables reside in your SQL database, alongside all your other data. This single-product solution saves you from the headache of extensive ETL processes. When using the graph to discover trends or gain insights, it’s simple to join back to the products table, which stores the extensive metadata with its 10, 100, or even 1,000 columns. The graph doesn’t require all that information. It just needs to know how to connect back to the core data that you already use in your current reports and models.
Querying with MATCH
With graph tables, foreign key constraints become unnecessary. Edges can establish relationships between nodes in various ways, including one-to-one, one-to-many, many-to-one, and many-to-many. Once your data is inserted and relationships are established, you can utilize the graph’s new MATCH keyword in the WHERE clause of your T-SQL queries.
DECLARE @product INT = 1;

-- which plant makes @product?
SELECT DISTINCT plant.Id, plant.Name AS warehouse
FROM plant, produces, product
WHERE MATCH(Plant-(produces)->Product)
  AND Product.Id = @product

-- which warehouse stores @product?
SELECT DISTINCT Warehouse.Id, Warehouse .Name AS Warehouse
FROM Plant, produces, product, delivers_to, Warehouse
WHERE MATCH(Plant-(produces)->Product and Plant-(delivers_to)->Warehouse)
  AND product.Id = @product

-- which store sells @product?
SELECT DISTINCT store.Id, store.Name AS store
FROM Plant, produces, Product, delivers_to, warehouse, stocks, Store
WHERE MATCH(Plant-(produces)->Product and Plant-(delivers_to)->Warehouse-(stocks)->Store)
  AND product.Id = @product
Read more at: SQL Graph MATCH Online Documentation
Declarative join statements
Note that the MATCH syntax mirrors the graph notation we discussed earlier. It is straightforward to write, easy to debug, and—honestly—convenient to explain verbally to stakeholders. It acts as a conditional predicate that, behind the scenes, generates the JOIN statements you would anticipate. MATCH serves as a declarative join syntax, simplifying the JOIN operation and minimizing the potential for errors. The engine, equipped with real-time knowledge of every data object and the current execution plan, excels at crafting JOIN statements compared to a data engineer doing it manually. Declarative joins provide a remarkable advantage of using graphs.
WHERE MATCH(Plant-(produces)->Product and Plant-(delivers_to)->Warehouse-(stocks)->Store)
  AND product.Id = @product
Also notice that MATCH supports both compound notation, using the “and” keyword, and complex notation that traverses multiple relationships in various directions. The syntax remains readable and straightforward. Additionally, you can include multiple MATCH clauses within the WHERE clause to enhance relationship descriptions if needed. As with most T-SQL statements, there is a high degree of flexibility available.
Conclusion
In Part 2, we explored the process of creating tables in Azure SQL to store nodes and edges for our graph database. The simplicity of this process allows us to leverage the power of graph functionality without significant changes to our existing infrastructure. We learned about the special columns generated behind the scenes, such as $node_id for nodes and $from_id and $to_id for edges, which play a crucial role in establishing relationships between entities.
Additionally, we discussed inserting data into graph tables, noting the unique aspects of inserting into edge tables. While it may require some finesse in data engineering, the principles remain consistent with inserting data into any other table. We also addressed the question of additional product data and emphasized the value of storing extensive metadata in separate tables, allowing the graph to focus on the core data required for relationships and connectivity.
Looking ahead to Part 3, we will explore the clarity, validation, discovery, and simplification that come with working with graph data. We’ll discover how the use of graph databases enables clear communication with stakeholders using their language and concepts, as well as how graph visualization facilitates discovery and simplifies complex relationships. Stay tuned to unlock the full potential of graph databases in optimizing supply chains and gaining valuable insights into your business processes.
0 comments