
With VS 2013 Preview now available for download, we’re excited to share how we’ve been using the feedback and data you’ve shared with us to drive performance improvements to Visual Studio. In this first post, we’ll walk through how we’re prioritizing and scheduling performance investments based on your feedback, and outline the best ways for you to provide additional feedback on performance. We’ll also highlight a few product improvements available for you to try out today. Over the next few weeks, we’ll follow-up with additional blog posts that walk through the details on how we’ve evolved our performance telemetry systems (including “PerfWatson”) to make it easier for you to help us find and fix product performance issues you encounter, and we will share with you a sampling of performance gains we’ve made, including improvements to our C++, Web, and core IDE experiences. If you are interested in understanding how we’ve factored performance into our engineering plans for some of our newer experiences, there’s some great content already available in Thursday’s post on Windows Store XAML apps, and in a few days we’ll share more about how we built the Synchronized Settings capabilities into VS 2013 Preview, keeping performance at the forefront of that experience.
As we share the work we’ve done, we’d especially love to hear back from you in the comments section below about your experiences with the product and the overall usefulness of these performance blog posts. We’ll use this to improve the quality of the content for future blog posts.
Using your feedback to prioritize performance investments
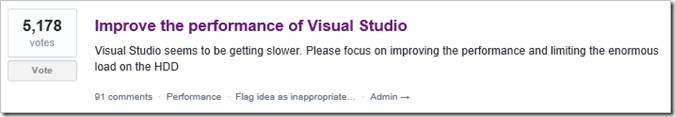
With that out of the way – let’s start by discussing where we look for feedback, and how we’ve been incorporating your feedback into our performance plans. You’ve been very clear that you’d like us to invest further in Visual Studio performance. In fact, since launching our Visual Studio UserVoice site, we received over 5,000 votes requesting that we “Improve the performance of Visual Studio” making it the 4th highest voted suggestion ever on our site (just under support for better Lambda expression debugging):
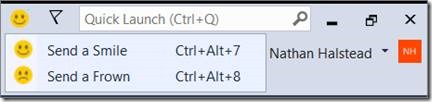
Performance also shows up as an area of particular interest in developer surveys, in Connect bugs, on twitter, in forums, in blog post comments, and most recently through VS 2013 Preview’s Send a Smile feature:
We pay very close attention to feedback from all of these sources as we plan each release, and combine it with telemetry data from people who have opted into our Customer Experience Improvement Program via “Help -> Customer Feedback Options” to help us identify where we have the largest opportunity to make an impact on performance. Things that we factor into this decision when prioritizing and scheduling performance investments include:
- How much user feedback have we received about a scenario and how important is the scenario to those users?
- Based on performance telemetry, by how much would we have to improve a scenario to really make a perceptible difference?
- Based on feature usage telemetry, how many users would benefit from any given investment?
- Do we have enough information on where we need to make a change/ can we accurately model product usage to ensure we’ve had the intended impact?
- Will this be a breaking change, and who else do we need to work with before publishing? (Ex: Popular 3rd party extension vendors)
- What is the opportunity cost to other productivity enhancements we could be making instead?
For example, one of the top areas of feedback for the past few releases has been about improving solution load times. While we made significant improvements in VS 2012, looking at performance telemetry (summarized below), there’s still opportunity to further improve this experience in a very perceptible way. (We’ll discuss the work we’ve done to further improve this scenario in more detail in an upcoming blog post – stay tuned!)
The key thing to note here is that performance work is prioritized and scheduled based on a combination of direct feedback and actual product usage data. By choosing to participate in the Customer Experience Improvement Program and trying out product pre-releases like the VS 2013 Preview, you are influencing where we invest and helping us validate improvements, even if you don’t have time to send us written feedback.
What about performance bugs?
Sometimes, performance issues are simply bugs that may not affect a large number of users, but can be very painful or completely blocking to someone who hits an issue. We take these issues very seriously and try to publish workarounds as soon as possible. When the complexity and risk associated with fixing these issues is small, we try to schedule fixes for delivery with our VS updates (like the recent VS 2012 Update 3 release). The tools and techniques we use to discover and fix these issues are a little different than our aggregate feedback and telemetry systems. We still use systems like the “PerfWatson” system we blogged about last release to auto-detect classes of issues like UI hangs, but we augment this with bug reports filed through Connect – preferably using the Visual Studio Feedback Tool [VS 2012 Download, VS 2013 Preview Download].
While this list certainly isn’t comprehensive, here is a sampling of some of the more notable of performance fixes that were published between VS 2012 RTM and VS 2012 Update 3:
- Fixed issues causing a “Please wait for a background operation to complete” dialog to show when copying code to the clipboard
- Fixed hangs on close when trying to access files on remote shares missing a specific Windows Update
- Reduced Symbol Loading from 30+ seconds to less than 3 seconds when symbol or source paths were not available [more info]
- Improved IDE Start scenario when Team Explorer is left open and OS has not yet “warmed up” by ~600 ms
- Reduced VS 2012 Virtual Memory consumption at startup by 95 MB
- ~99% improvements to specific version control scenarios when working with extra-large TFS repositories (Ex: 600 MB ‘tf add’ reduced from 2 hours -> 3 min)
- Page load times reduced from minutes to seconds when loading TFS work item web pages from deployments with hundreds of team projects
- Eliminated a common 6+ second UI hang when saving web application files
When fixes are larger in scope, or are likely to break 3rd party extensions or SDKs that have already shipped on top of the current VS release, we still try to publish workarounds quickly, but may defer a fix until our next VS Release. This gives our partners the time they need to try out the fixes and report any resulting issues, and lets us better coordinate with teams who may also be doing feature work in an impacted area. In addition to the items above, the VS 2013 preview also includes targeted improvements in the following areas:
- Fixed an extra-long hang when working with large numbers of Windows Phone project types and multiple build configurations
- Eliminated a common 3-5 second hang when using “Show on Code Map” or its Find all References features.
- Eliminated a 7 second hang when trying to bring up the Add Data Binding dialog in the XAML editor
- Numerous fixes to improve IDE start-up time
- ~26% improvement when adding a new Lightswitch Client to a project
- Numerous fixes to eliminate delays when opening specific tool windows (Ex: Test Explorer opens up to 1.5 seconds faster)
When these fixes are combined with new performance features and investments we’ve made across the product, we hope that you’ll find the VS 2013 Preview to be notably faster than our previous releases.
Summary and Preview into Upcoming Performance Posts
I hope this post has been helpful to communicate how we think about and prioritize performance work for Visual Studio based on your feedback. If you’d like to use any of the feedback systems noted above to share your performance suggestions or issues with us, here’s a few quick links to get you started:
- Download the VS 2013 Preview or VS 2012 Update 3 and opt into the Customer Experience Improvement Program via “Help-> Customer Feedback Options”
- Vote and comment on the productivity scenarios you think we should prioritize next on the Visual Studio UserVoice site
- Download and use the Visual Studio Feedback Tool to report a new performance bug [VS 2012 Download, VS 2013 Preview Download]
Over the next few weeks, we’ll be having members of our engineering teams come share details on specific performance features investments we’ve made in VS 2013 for C++ developers, Web Site developers, and to Core IDE experiences. We’ll also share details on advancements we’ve made to our performance telemetry systems to auto-detect and report on key product scenario performance. As we do, we’d love your feedback in the comments section below about how we can make performance-related blog posts even better for you.
 |
Nathan Halstead – Program Manager Lead – Visual Studio Fundamentals Team
Short Bio: Nathan Halstead has worked at Microsoft since 2004, and currently leads a team focused on continuous improvements to Visual Studio performance and reliability. He’s an avid skier, plays in an adult recreational ice hockey league, and loves playing with new technology. |
0 comments