What’s new in Visual Studio 2019 v16.10?
We are excited to announce the release of Visual Studio 2019 v16.10 GA and v16.11 preview 1. This release makes our theme of developer productivity and convenience Generally Available to Visual Studio users! We’ve added C++20 features, improved Git integration, improved profiling tools, and a host of features that accelerate productivity.
Download the latest Visual Studio release to try the new features in 16.10. And as always, we love your feedback and interactions through our Developer Community.
C++
Our compiler and STL are now feature-complete for the latest available C++20 standard! 16.10 comes with a few much-anticipated features: calendars, timezones and <format>. These features are all available under the /std:c++latest switch. The /std:c++20 switch is not yet available as some features are expected to be amended by Defect Reports (ISO C++20 bug fixes) in an ABI-incompatible way (see Microsoft/STL Issue #1814 for more details).
The <format> is a new facility for text formatting based on fmtlib. It provides a fast and safe alternative to iostreams and the printf family:
auto version = 20;
std::format(“STL is now C++{} feature-complete!”, version);
Calendars and timezones are an extension to the existing <chrono> facilities. They provide functionality for representing and manipulating dates and times in a type-safe and time-zone aware fashion.
std::chrono::year_month_day world_bee_day = May/20d/2021y
std::format("Buzz buzz on %F!”, world_bee_day);
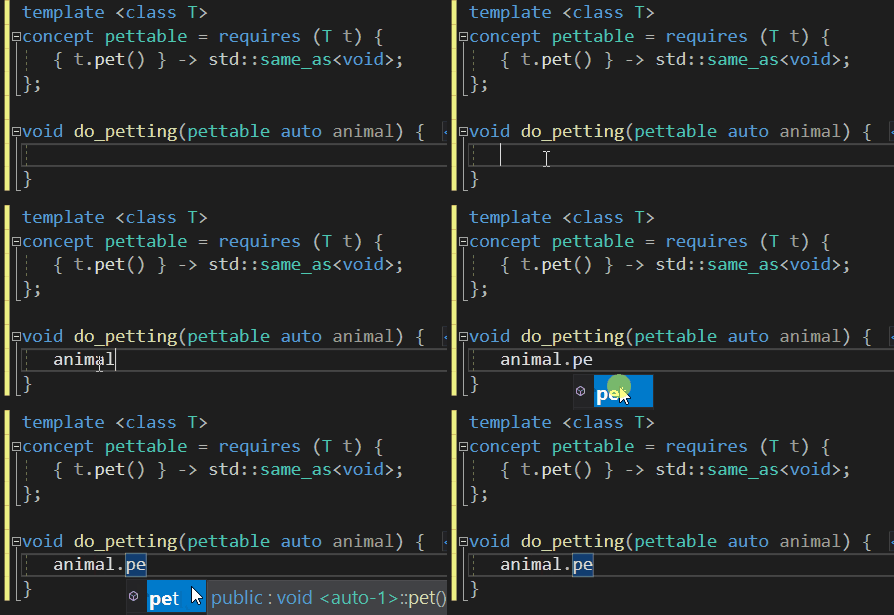
In addition, we’ve improved the IntelliSense experience for Modules, Ranges, and Concepts. Go-to-definition works on both modules themselves and definitions imported from modules. Ranges are notoriously difficult to process for the compiler, but IntelliSense can now give you completion for them. You’ll also get completion for names defined within concepts.
The LLVM OpenMP runtime is now supported on x86 and ARM64, in addition to x64. Pass the /openmp:llvm switch to target it.
If you want to use C++20-style coroutines but are targeting C++11 or C++14, you can now use the /await:strict switch to get the desired behavior.
We’ve improved our coroutine debugging and visualization. In particular, the visualization for std::coroutine_handle<T> now displays the original coroutine function name and signature and the current suspend point.

If you’re using our CMake support then you’ll now be able to use CMakePresets to specify configurations rather than CMakeSettings.json. This format is consistent across Visual Studio, Visual Studio Code, and any other tools which support this new standard.
Git Productivity
The status bar has a new branch picker that allows you to filter local and remote branches and perform common actions from the right click context menu.
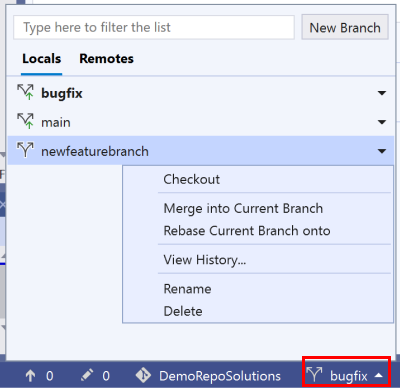
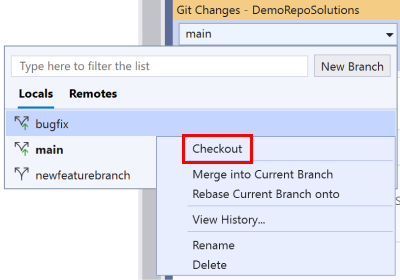
The branch picker in the status bar as well as the Git Changes window now check out a local or remote branch when you single-select the branch.
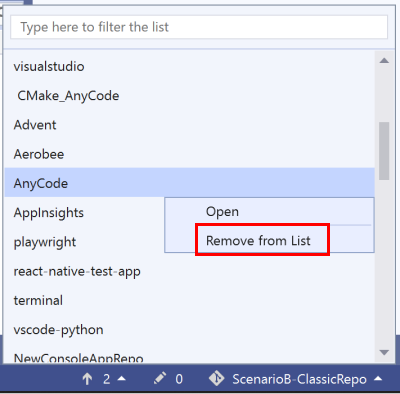
Filter and switch between local Git repositories from the status bar repository picker. The context menu on right-click allows you to remove items from the list.
Sync (Pull then Push) your branch with the remote from the unpushed commits button in the status bar, and from the Sync command in the Git Menu.
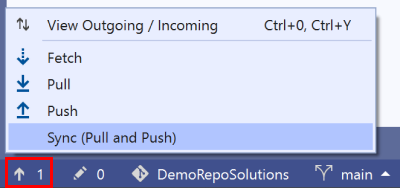
Fetch and pull from the Git Repository window history pane even when there are no incoming commits. Access these sections from the status bar or the keyboard shortcut Ctrl+0+Y.

Select a commit in the Git Repository window to view its details and the comparison of file changes without having to navigate to other windows. Select two commits and right-click to compare them in the same window. Pop out the details into their own window for full screen visibility to deep-dive into the changes.
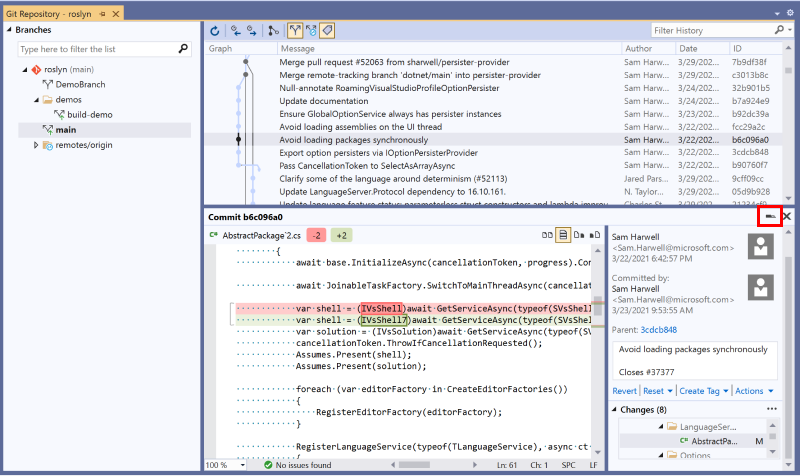
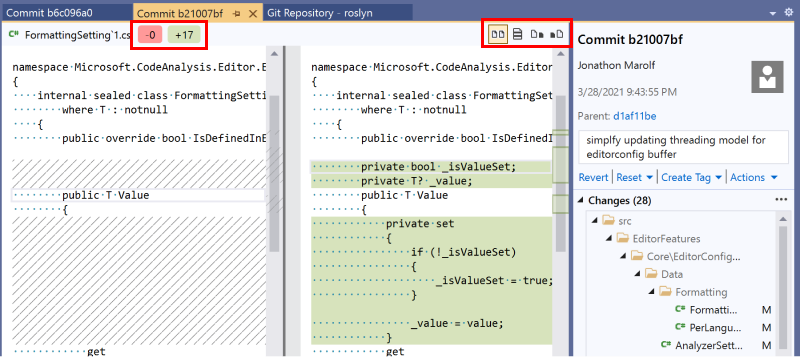
View the number of deletions and insertions in a file, and change the layout of the comparison.
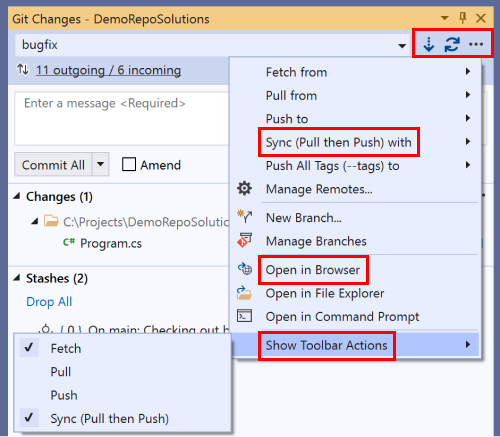
You can perform even more actions now from the Git Changes window. The toolbar icons are customizable and you can choose which actions to show. You can Sync with multiple remotes from the overflow menu. And you can open your repository’s remote webpage in the browser.
Automatically re-connect or prompt to establish initial Azure DevOps connection when opening an Azure DevOps Git repository. This enables access to work items and builds for the opened repository.

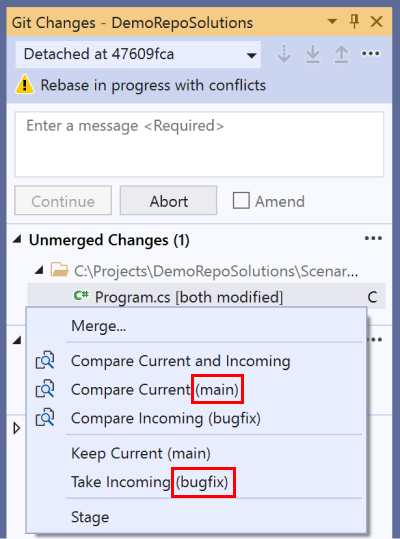
When resolving rebase or merge conflicts, the merge editor and the context menu will show you the branch names for the Current and Incoming branches. This fixes the confusing Source and Target terminology issue.

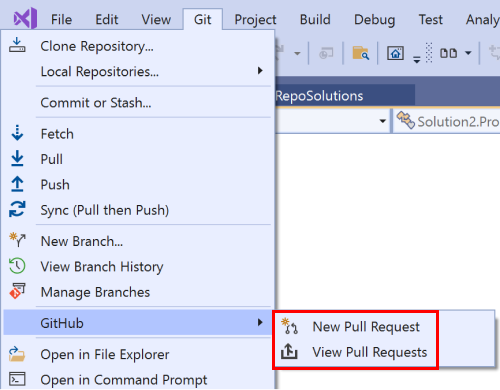
We added menu items that are shortcuts to the PR creation and list pages to make it easier to create and view pull requests. The menu is dynamic based on whether your repository is on GitHub or Azure DevOps.
Git Settings
We added a few new options in Git > Settings to manage how you open and switch repositories. You can now keep the current solution open when switching to another repository

You can also choose not to load the repository root folder when opening a repository. This will keep the Solution Explorer empty and you won’t get a solution list.

However, if you do choose to open the root folder, Visual Studio won’t automatically load the solution anymore. Instead you’ll see the folder view and solution available in a list you can select from. You can change this behavior through Git > Settings by toggling the checkbox.

You can choose to check out a branch from the Git Repository window by double-clicking the branch name. If you want to change this behavior, then toggle the checkbox in Git > Settings.

Performance Profiler
The launch page for the Performance Profiler now has links to help guide users to online documentation detailing how to use the tools along with our toolbox video series. You can usthese to learn more about the tools and learn how to better identify areas in your code for optimization and validate your changes.
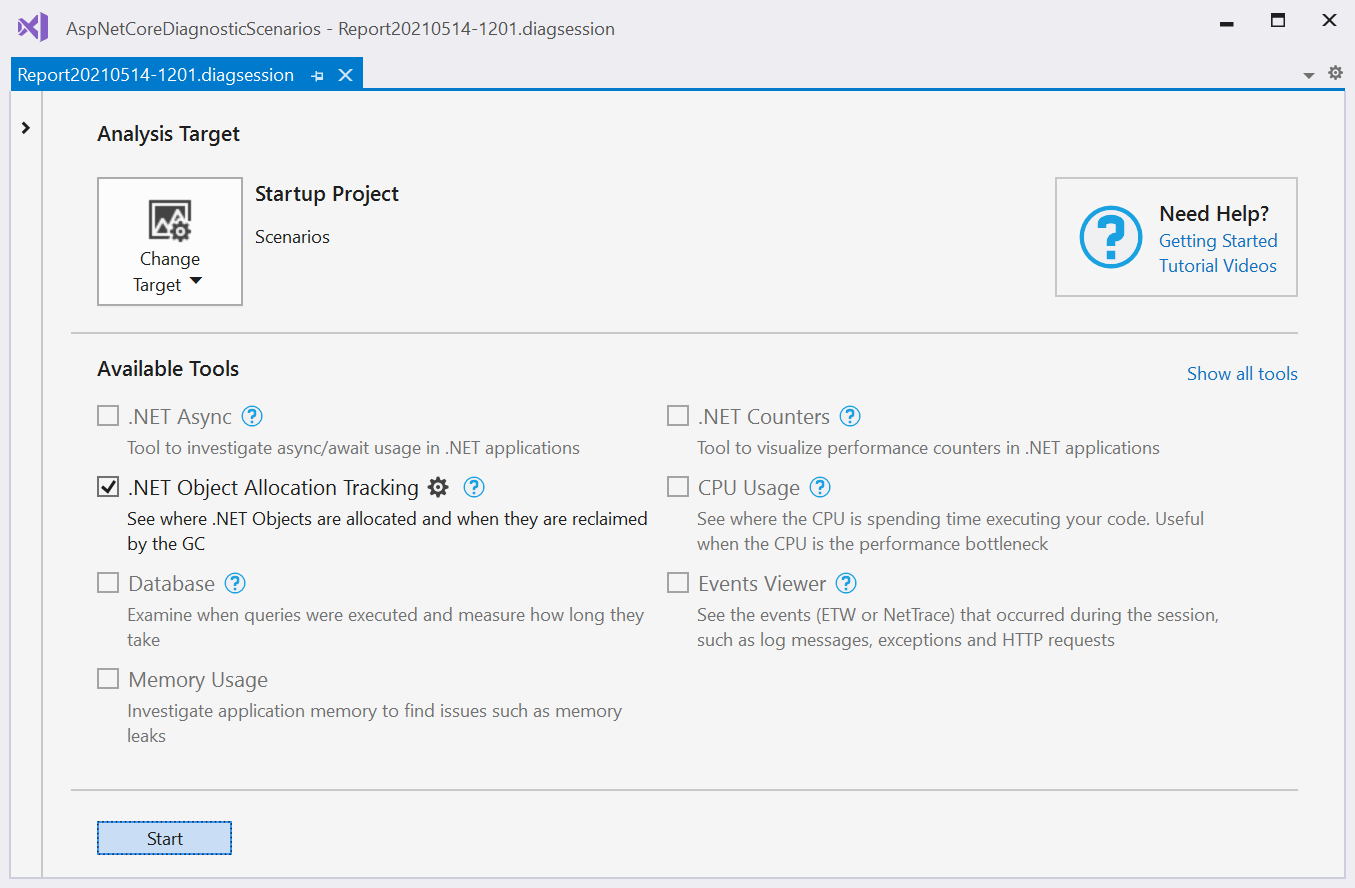
The .NET Object Allocation tool in the Performance Profiler is first tool transitioned to our new analysis engine which is significantly faster and provides more features. After collection you can get to your results and build call-trees faster (~40% increase). We now also support SourceLink to pull down sources, so you can see exactly where code is allocating, even if it is not in your code.
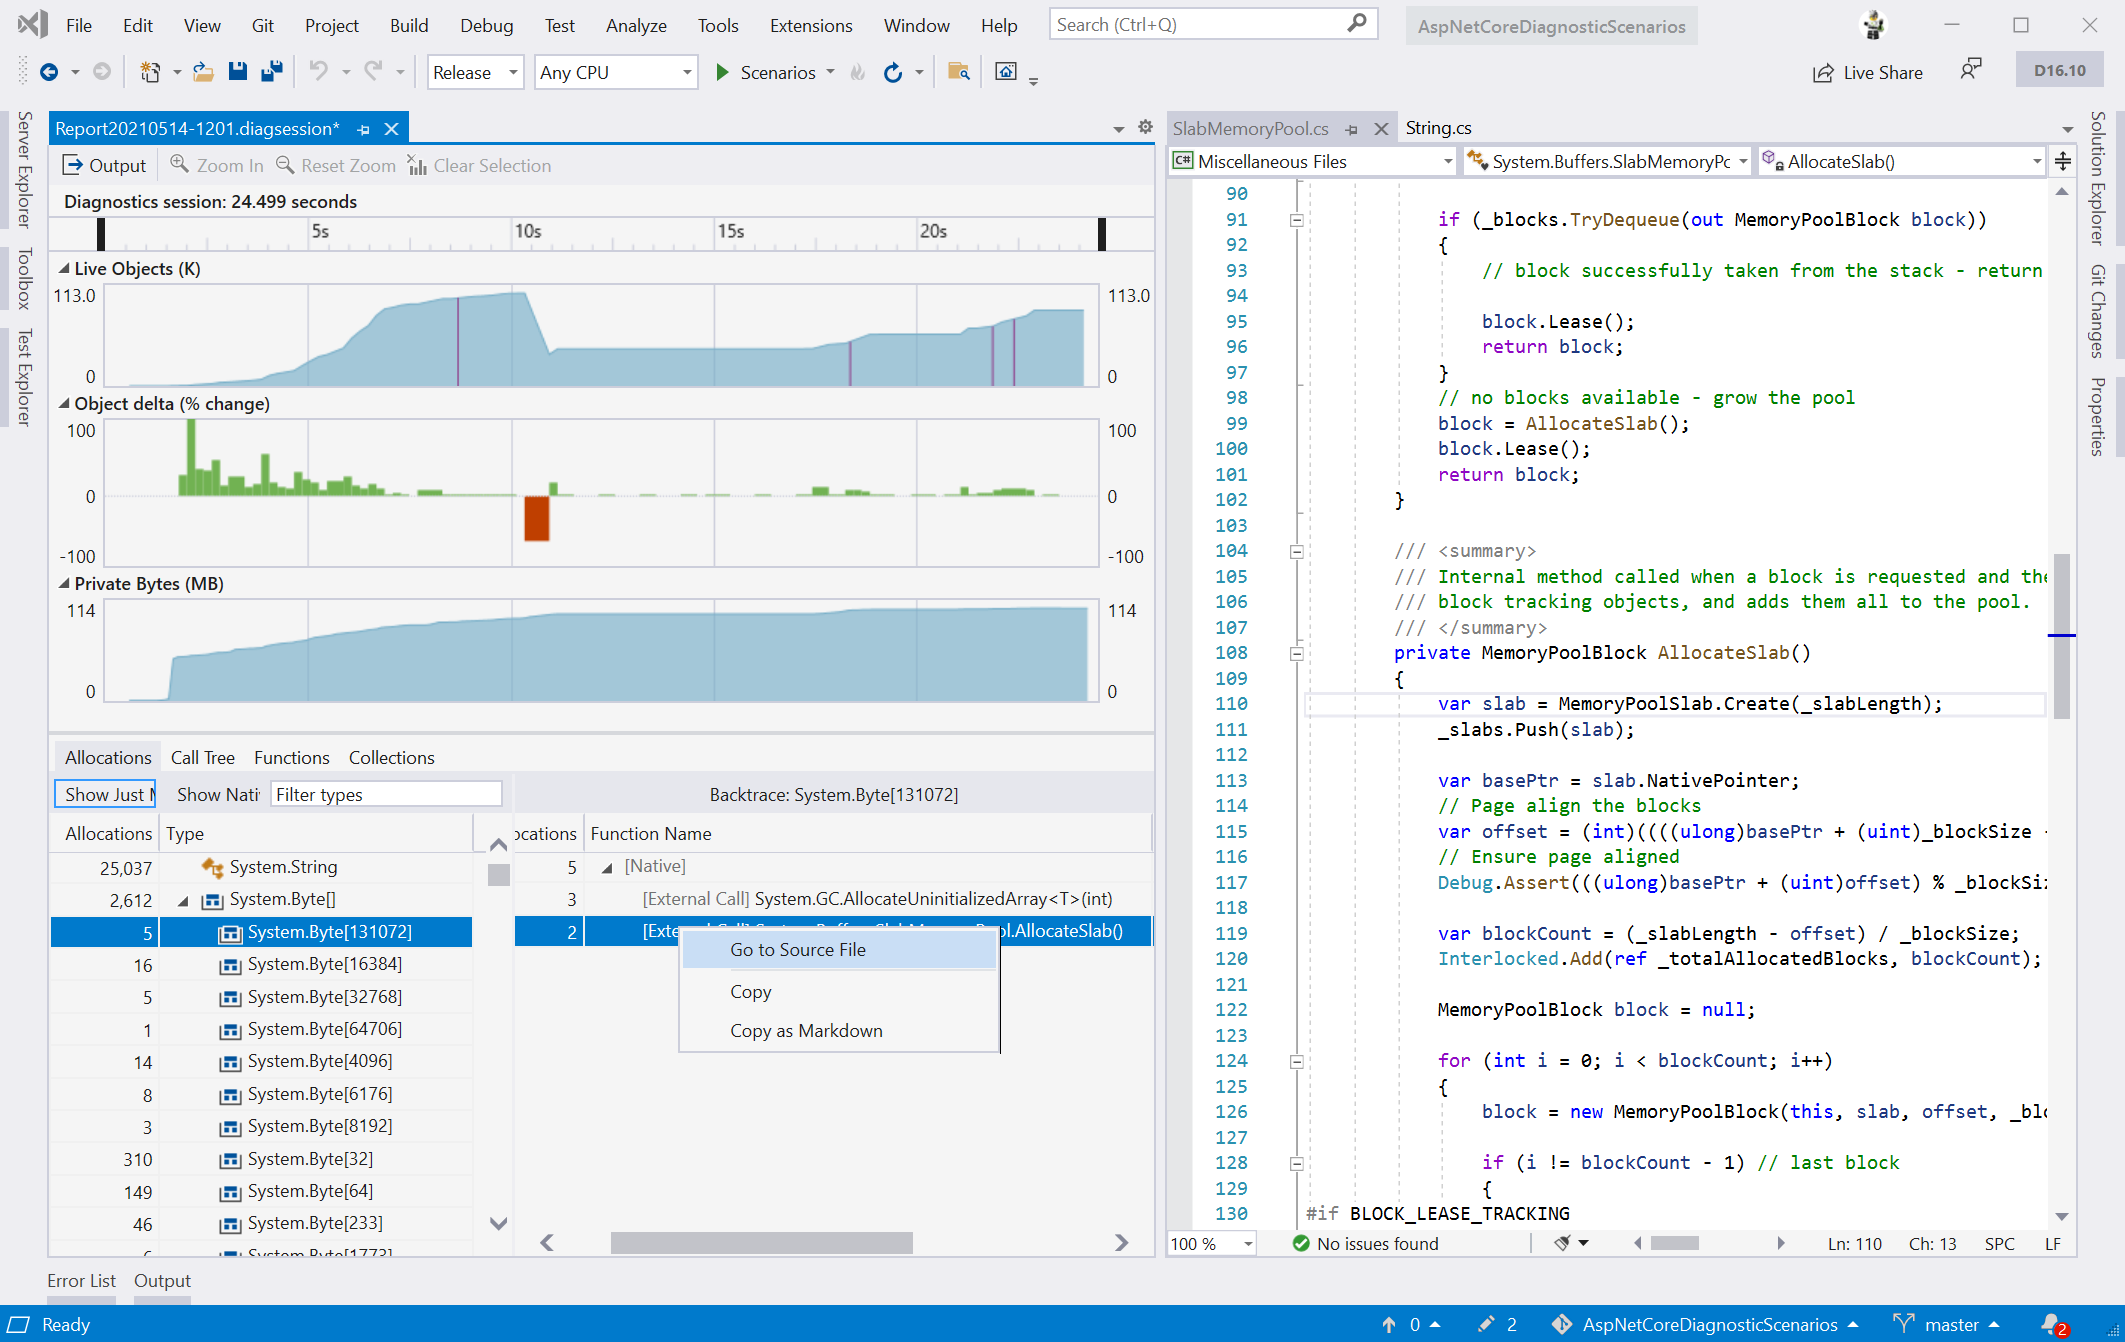
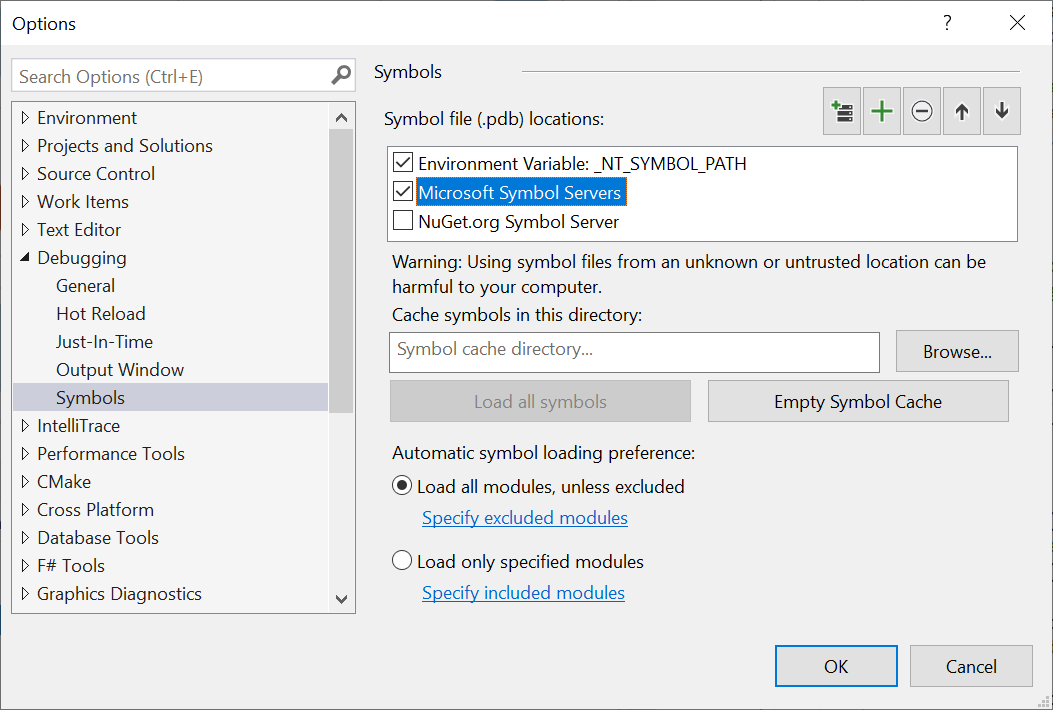
This requires symbols for the corresponding code which can be pulled down from the Microsoft Symbol Servers, go to Debug > Options > Symbols to enable this.
Containers
This release includes some exciting features for users of the Docker container tooling. You can now run any combination of services defined in your compose files, and enjoy improved container and image management in the Containers window. For more information, see our New Features for Containers announcement in the 16.10 preview 3 blog.
.NET Productivity
From our .NET team, we bring you several features to help with continual improvements in productivity.
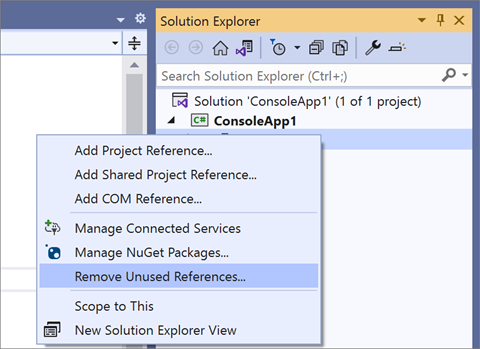
We have added functionality through the Remove Unused References command. This command allows you to clean up unused project references and NuGet packages. This option is turned off by default, but you can enable it under menu Tools > Options > Text Editor > C# > Advanced. Select the Remove Unused References command in Solution Explorer (Experimental). Once the option is enabled, the Remove Unused References command will appear in the right-click menu of a project name or dependencies node.
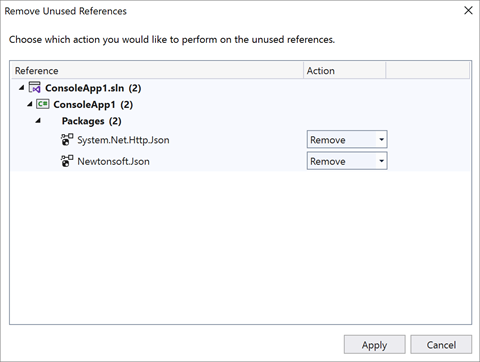
When you select Remove Unused References, a dialog box will open. You can then view all references that are going to be removed, but you also have the option to preserve any you wish to keep.
IntelliSense Completion
There is additional IntelliSense completion for Enum values when a type is known even if the Enum value is not entered. We also expanded this option to include completion for casts, indexers, and operators.
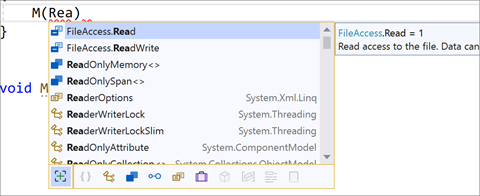
There is now a completion option that automatically inserts arguments when writing a method call.
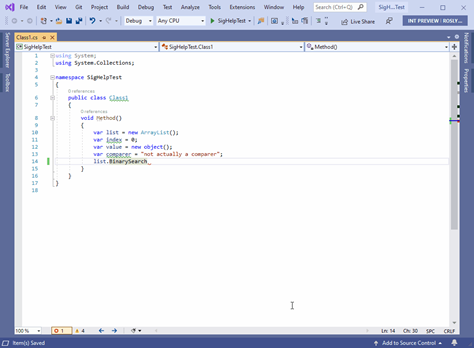
This feature is off by default so you will need to enable it in Tools > Options > Text Editor > C# > IntelliSense and select Tab twice to insert arguments (experimental).
To use this feature, start writing a method call and press tab twice (tab+tab). Notice that the method call includes arguments based on the method’s default values. Use parameter info to cycle through the list of arguments that you would like inserted by pressing the up and down arrow keys. Start typing an argument to bring up the IntelliSense completion list and type semicolon, which will commit the argument and add a semicolon to the end of the method call.
Visualize and Navigate Inheritance Chains
There is now a visual representation for navigating and inspecting the inheritance chain.
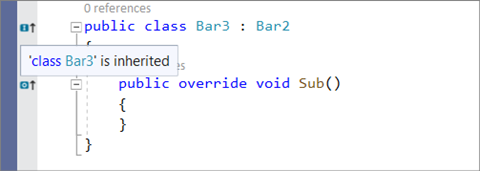
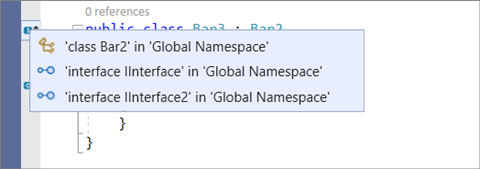
This option is off by default so you will need to turn it on in Tools > Options > Text Editor > C# > Advanced and select Show inheritance margin. Enabling inheritance margin will add new icons to the margins representing your code’s implementations and overrides.
Click the inheritance margin icon to display inheritance options that you can navigate to.
Test Explorer Accessibility Improvements
We’ve made several updates to the Test Explorer that improve keyboard accessibility and usability of the test detail pane and log files. For details, see Test Experience Accessibility Improvements in the 16.10 preview 3 blog.
WinForms Updates
We’ve refactored our Behavior Service for Visual Studio 16.10. This resulted in significant performance improvements to the new WinForms designer for .NET Core, 5, and 6. This also fixed many issues related to selecting, dragging, and dropping multiple controls.
XAML Tooling Updates
We keep improving existing and adding new features to make you more productive developing XAML UIs.
XAML Designer Quick Actions
Now you can change properties of your controls very quickly by using a pop-up menu behind the light bulb that is shown for a selected control.
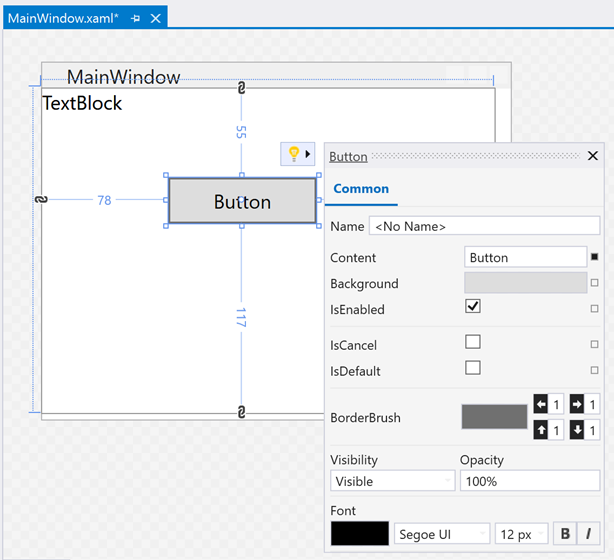
When you select a control in the XAML designer, you will see a light bulb. Once you click on it, a list of most commonly used properties for this specific control will be displayed saving you time finding those properties in Property Explorer or typing the code in XAML editor.
Supported controls:
- WPF: Border, Button, Canvas, CheckBox, ComboBox, Grid, Image, Label, ListBox, ListView, StackPanel, TextBlock, TextBox.
- UWP: Border, Button, Canvas, CheckBox, ComboBox, Grid, HyperlinkButton, Image, ListBox, ListView, NavigationView, RadioButton, Slider, StackPanel, TextBlock, TextBox.
This feature is available for UWP, WPF Core, and WPF Framework (with the “New WPF XAML Designer for .NET Framework” feature flag enabled). You can also create your own actions, see XAML Designer Extensibility GitHub to learn more.
XAML Sample Data
Usually, to see how your controls look with data values you have to implement all data bindings, populate your database with values, and you need to run your application. With this feature you can see how your controls look with “dummy” data right away in the designer. For that set d:ItemSource='{d:SampleData}' on your ListBox, ListView or DataGrid. The control will be auto populated with a “dummy” data that matches your DataTemplates and BindingPaths. This data is shown in the designer and doesn’t affect your source code.
You can change how many items are generated using the ItemCount property, for example: d:ItemSource='{d:SampleData ItemCount=3}', by default it is set to 5.
What’s new in Visual Studio 2019 v16.11 Preview 1
.NET Hot Reload
In this release we’re excited to make available the first release of the new Hot Reload user experience when editing code files for applications such as WPF, Windows Forms, ASP.NET Core, Console, etc. With Hot Reload you can now modify your apps managed source code while the application is running with no need to pause execution or use a breakpoint. Instead, simply make a supported change and use the new “apply code changes” button in the toolbar to apply them immediately.
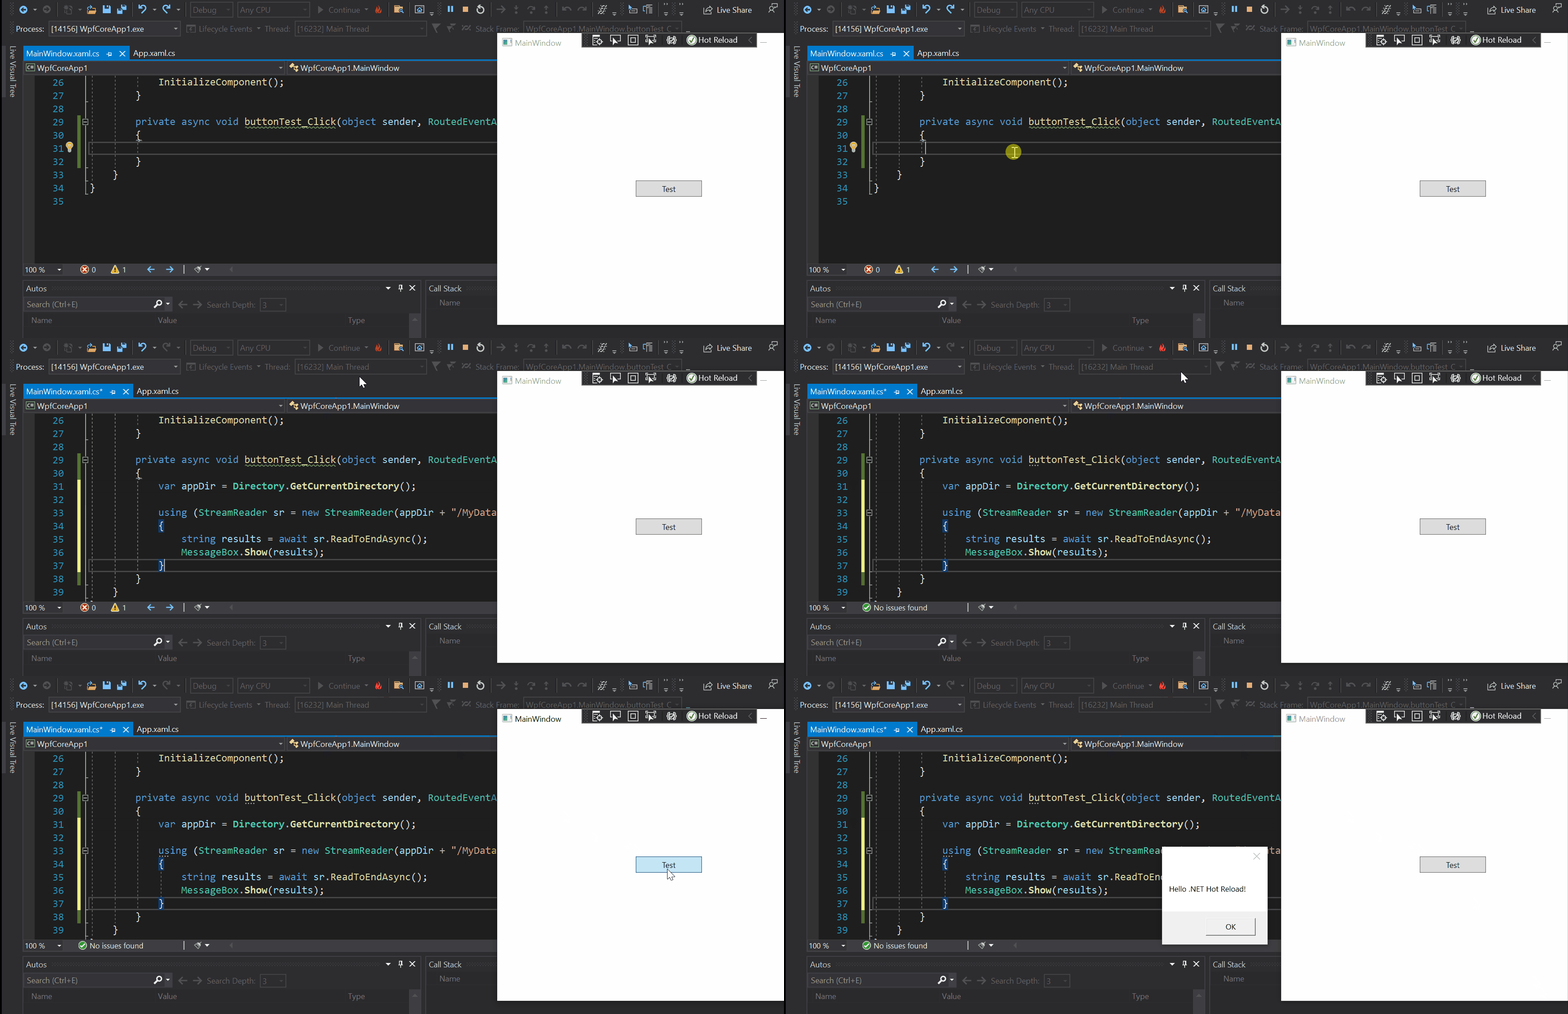
In this update of Visual Studio this new experience is available when running your application under the debugger (F5) and is powered by the Edit and Continue (EnC) mechanism. Use Hot Reload alongside any other debugger features anywhere EnC is supported. .NET Hot Reload also works alongside XAML Hot Reload, making it possible to make both UI and code-behind changes in your desktop applications such as WPF or WinUI.
Both EnC and Hot Reload share the same limitations, so not every type of edit is supported. The complete list of what is or is not supported can be found in our documentation.
Hot Reload is now also available under the `dotnet watch` CLI tool for certain scenarios starting with .NET 6 Preview 3 or higher, for more details see the .NET release blog.
This is just the start of our journey, and we will be looking to improve this experience further in Visual Studio 2022 and future versions of .NET 6+, such as the ability to use Hot Reload from Visual Studio when starting your application without a debugger (CTRL-F5), reducing the number of unsupported edits, enabling the ability to edit Razor pages, support for using Hot Reload with Blazor and .NET MAUI applications and more. If you want to learn even more details about our vision for this technology, see our detailed blog post on the .NET Blog.
We really hope you will try Hot Reload with your application and provide feedback through the Visual Studio feedback feature.
.NET MAUI
Visual Studio 16.11 preview 1 adds support for .NET MAUI! .NET Multi-platform App UI (MAUI), shipping GA this November, is the best way to write cross-platform applications for iOS, Android, Windows, and Mac. .NET 6 Preview 4 ships today with new .NET MAUI features, including single project improvements, the ability to target all supported platforms, and Blazor hybrid desktop support! Visual Studio 16.11 p1 allows you to open, build, and debug .NET MAUI apps from the IDE, and adds functionality for the new single project architecture. Additionally, you can use the new project configuration wizard to create a new .NET MAUI app!
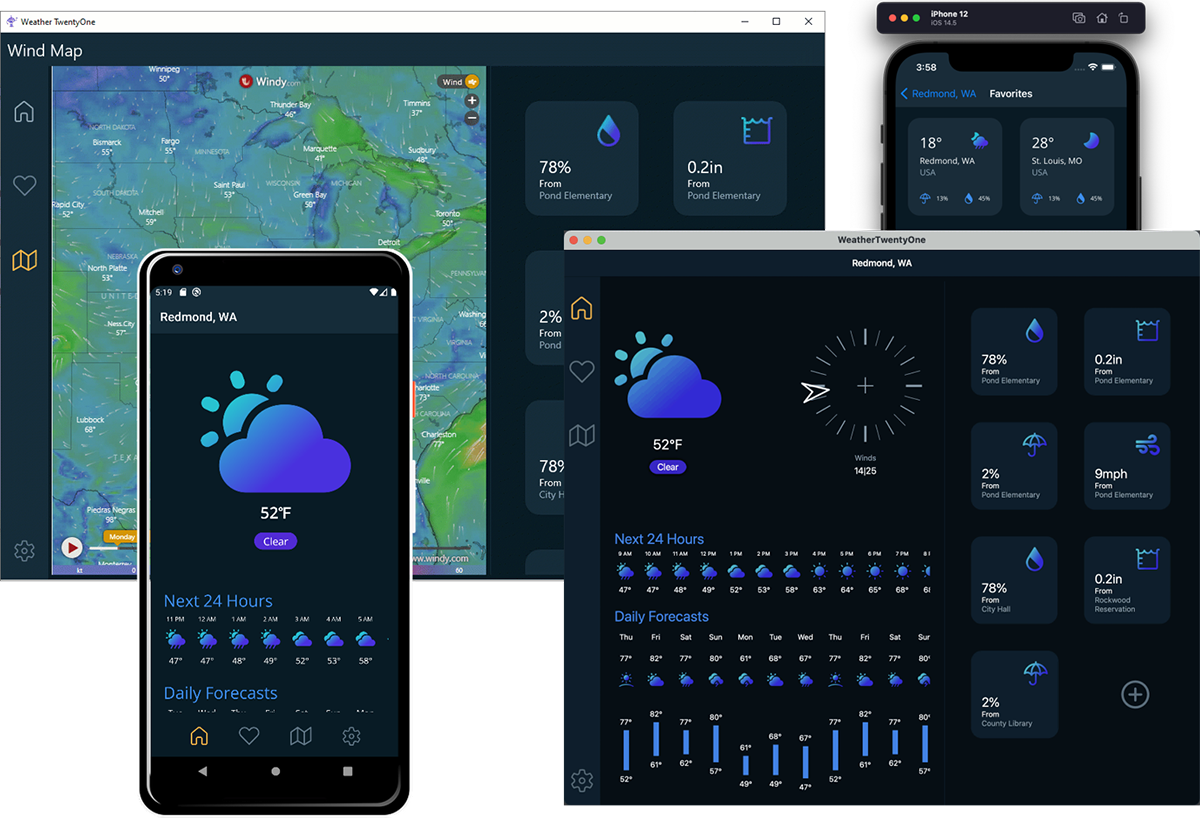
With .NET MAUI and Visual Studio, you only need one project in your solution to target mobile and desktop. Images, fonts, app information, and even splash screens can all be defined in one project and deployed to each platform at compile time. Using multitargeting, you can debug on any supported platform without having to maintain different projects for different target frameworks. To learn more about the new .NET MAUI Single Project architecture, you can watch the May 2021 Xamarin community standup!
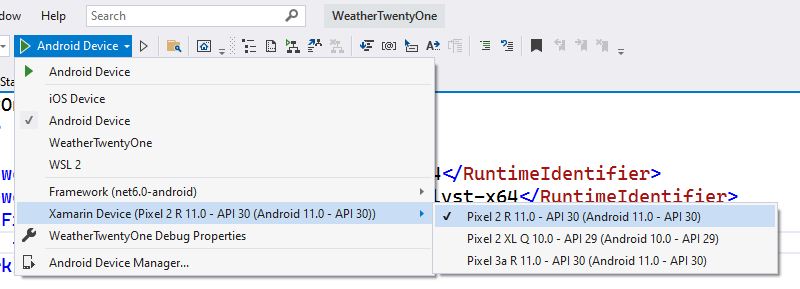
To try out .NET MAUI today, download Visual Studio 16.11 and follow the instructions on the .NET MAUI samples repo to install the .NET 6 preview SDKs!
For more information, see .NET MAUI preview 4.
To experience the latest that Visual Studio 2019 has to offer, download the preview today. Don’t forget to report a problem or give us feedback on Developer Community!

Thanks for sharing very useful information .
Bigg Boss 15
Error MSB4018 The “ResolveTargetingPackAssets” task failed unexpectedly.
In any open code file windows I can move over to the icons above Solution Explorer to click on the (left arrow/right arrow) button which then shows me where the open code file I’m looking at, lives in the Solution. The Button is gone. I’m guessing it’s been removed. I use it regularly!
Any hope that the "Embedded commit details and file comparison in Git Repository window" functionality gets an option so it can be reverted to (the superior) pre-16.10.0 behavior? (I have no idea where to suggest such a thing; I don't know which "voice" site works this week, or even if that paradigm has changed again.)
1. I can no longer use my differencing engine of choice; the built-in one is significantly inferior to my external tool.
2. Changing it a document-window instead of a docked tab adversely affects my workflow; it slows me down and makes things more confusing. When I...
After this update the visual studio hangs for few seconds every 1-2 minutes – I have report this as bug.
I have try to remove almost everything from extensions and still nothing.
I can not even work any more – please check this up.
this comment has been deleted.
Thanks for your work guys! I have encountered a problem on parsing ISO-8601 date with nanoseconds:
// Visual Studio 16.10, /std:c++latest
void test()
{
    std::istringstream input("2021-05-30T13:37:31.123456Z");
    std::chrono::sys_time tp;
    input >> std::chrono::parse(std::string("%FT%TZ"), tp);
    assert(!input.fail());
}
The sample works with the reference date library by @HowardHinnant.
Do you have any plans on covering this scenario?
Thanks for reporting this issue! I believe we have this work tracked in an issue in the MSVC STL open source repo, and one of our contributors has already opened up a PR with a fix. So yes, we have plans to address this use case and have a fix in progress!
"This is just the start of our journey, and we will be looking to improve this experience further in Visual Studio 2022 and future versions of .NET 6+, such as the ability to use Hot Reload from Visual Studio when starting your application without a debugger (CTRL-F5), reducing the number of unsupported edits, enabling the ability to edit Razor pages, support for using Hot Reload with Blazor and .NET MAUI applications and more."
=> So editing of Razor pages and Blazor it not supported? It'd be good not to show the Hot reload button if not supported, otherwise it is...
Showing branch names for the Current and Incoming branches during merge conflicts will be welcomed with open arms!
Not sure where to post this, but after the update, the create package wizard appears to be broken, I am downgrading and seeing if I can get it to work again. This is for UWP applications, in particular Windows IOT Core.
My Uwp project ( bridge with desktopExtension) is facing a similar problem, too.
Error Message below:
The imported project “C:\Program Files (x86)\dotnet\sdk\5.0.101\Sdks\Microsoft.NET.Sdk\Sdk\Sdk.NuGet.targets” was not found. Confirm that the expression in the Import declaration “C:\Program Files (x86)\dotnet\sdk\5.0.101\Sdks\Microsoft.NET.Sdk\Sdk\Sdk.NuGet.targets” is correct, and that the file exists on disk. C:\Program Files (x86)\Microsoft Visual Studio\2019\Community\MSBuild\Microsoft\DesktopBridge\Microsoft.DesktopBridge.targets …
So, downgrading … waste 3 hours..
After downgrading to 16.9 , My UWP Works perfectly,
Btw, is there any information (like Roadmap) of UWP with Reunion?
Still using c# 7.3 and .netcore 2.x in 2021…
Developing some lite solution on Win10 IoT Core, because .NetNative faster and use less energy than .Net Runtime, and MS have no any clear intention till now… SO SAD.
Refer:
https://github.com/microsoft/ProjectReunion/issues/105
this comment has been deleted.
While I’m excited about the changes, has anybody else noticed a slight lag and slowdown of intellisense and autocomplete after the update? I already made a report of it: https://developercommunity.visualstudio.com/t/Version-16100-Update-Slows-Down-Intell/1434887
For me it appears to have happened in both Community and Enterprise editions.
I also noticed a new bug with Sql Database projects where only one Design window can be loaded at a time: https://developercommunity.visualstudio.com/t/Visual-Studio-Lags-if-you-attempt-to-ope/1434901