With the release of Visual Studio 16.10 comes a new analysis engine for the Performance Profiler, with the .NET Object Allocation Tool being the first tool to be onboarded. This provides the tool with some new features and a significant perf boost. Give it a shot with your C# app and see what spurious allocations you can remove to speed up your app!
What’s new?
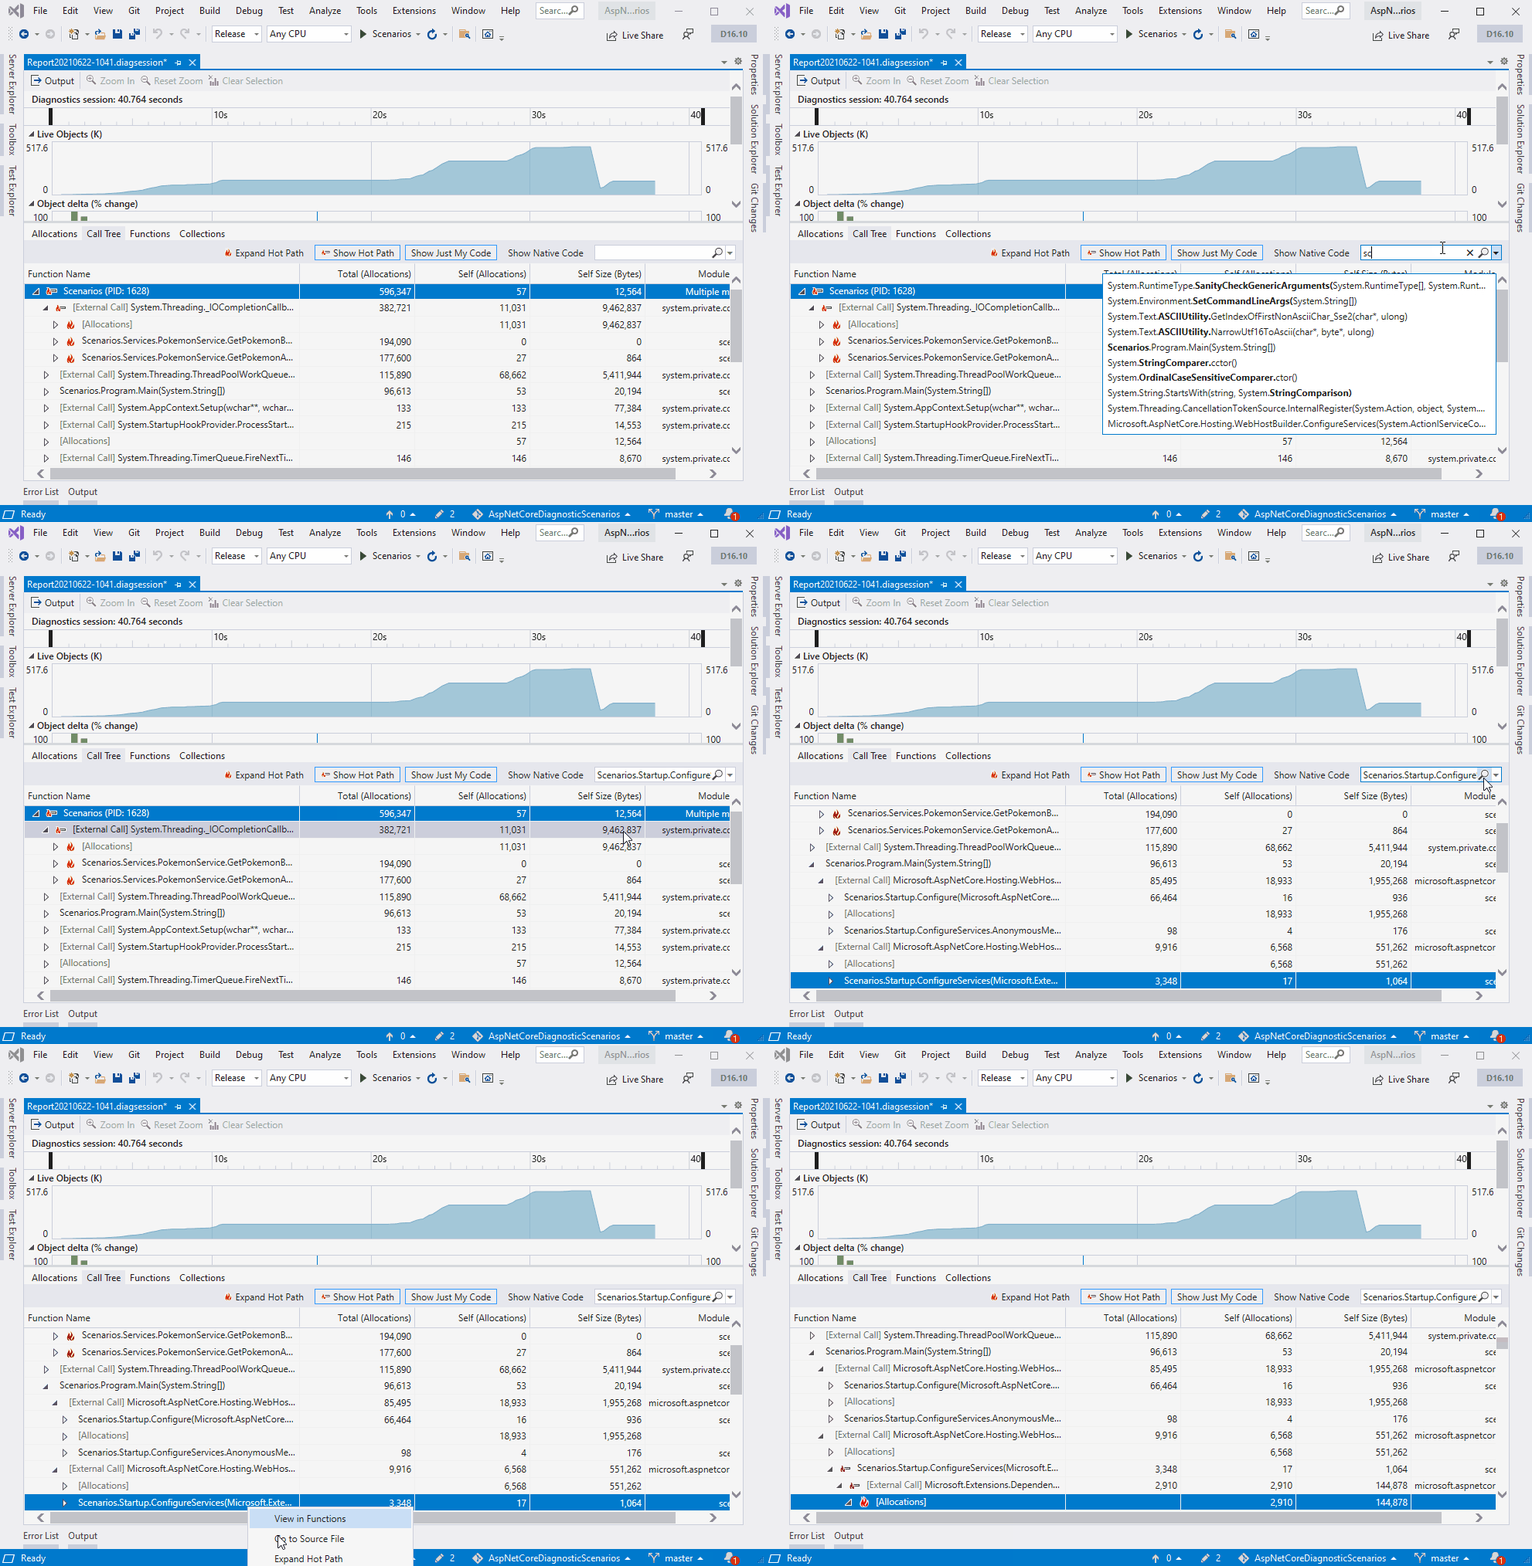
The .NET Object Allocation Tool now has support for Source Link which lets the tool pull down source files when going to source. This lets you see exactly where allocations are happening even if they are not in your code.
Search now has auto complete suggestions to help you find and dig through reports quicker.
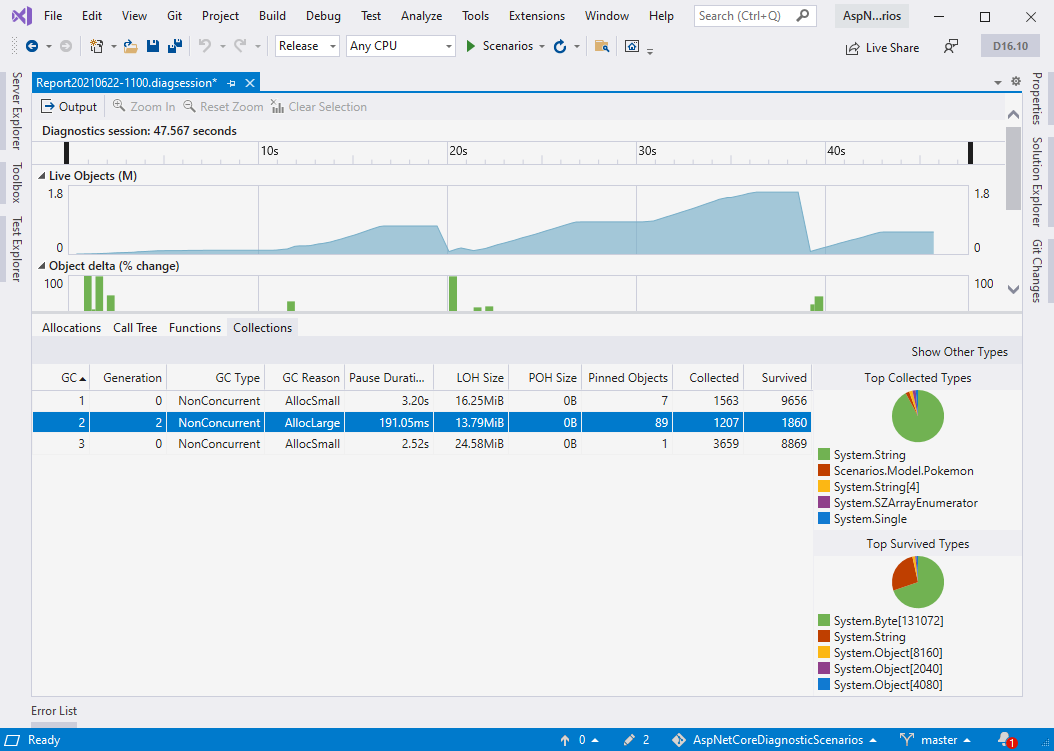
Lastly, we have added additional information to the Collections view to try and give more insights into the .NET Garbage Collector (GC). You can now see why a GC occurred along with relevant stats such as how long it took, the heap size, and how many objects were collected.
Let’s see some numbers!
One of the areas we’ve spent the most energy on is improving the performance of .NET Object Allocation Tool. To do that we focused on the two big tasks the tool performs:
- Building the initial allocation model which is used to look up allocations for the views.
- Building the call tree which is used to show the call tree, functions, and backtrace view.
In the table below you can see just have much faster the tool is in the latest version of Visual Studio.
| ASP.NET Scenarios App | Build Allocation Model | Build Call Tree |
| Small trace (500K allocations) | 3.5s -> 2.2s
~1.5x faster |
295s -> 24s
~12x faster |
| Medium trace (1M allocations) | 6.9s -> 3.6s
~2x faster |
695 -> 58s
~11x faster |
| Large trace (3.1M allocations) | 22.5s -> 8.4s
~2.5x faster |
1556s -> 109s
~14x faster |
As you can see we are significantly faster, and those numbers aren’t even an apples to apples comparison as the new version does even more analysis but it is still faster than the previous version!
This is just the beginning, the first tool. We are extending these changes to other tools in the Performance Profiler for Visual Studio 2022 and have additional ideas on how we can save even more time. Expect your profiling experience to get a whole lot faster!
Come chat with us
We’d love to hear your feedback. If you’d like to share your feedback or to chat with our engineering team on how we can improve this tool, please fill out the survey below.


I am only an occasional C# developer, doing most of my work in SQL Server. SQL Server has tremendous endurance when sticking with the core elements that use its own buffer manager, but use of the elements that make direct OS allocations and it behaves like an ordinary application w/r to garbage collection. My thought is, certain large/complex classes/objects should allocate from a common set of pages, i.e., other objects or other instances of the same class would allocate from separate pages. Hence clean up is very simple because any pages allocated can be freed without concern for objects still...
Is this tool available for VS 2019 Professional or is it Enterprise only?
It’s available in all versions, Community to Enterprise.
Awesome work, Nik & team! Will there be, or has there been, a post written on the specifics of the performance improvements made to the .NET Object Allocation Tool? A detailed analysis would be very interesting to read over.
We haven’t, but if there is interest it is something we can consider. Stephen Toub uses the tool quite often and writes about his improvements in .NET on things like Async ValueTask Pooling. If you want gory details, his blog is definitely the go to place.
Instead of allocations, I’m sometimes also interested in what objects the GC collected, and which objects survived a Gen0/Gen1 collection. Is there a plan to surface such information as well?
I think it would even be possible to collect this information with a lower perf impact.
Yep, we surface some of the information on the collections tab. You can see stats about a GC and then if you select one we will show the top types that were collected and survived the GC. We are working with Maoni on .NET to try and make the view even more useful in upcoming versions. We are also looking at a lower impact collection scenario, specifically being able to collect and visualize a
trace.
That’s fantastic to hear and exactly what I was hoping for!
I hope some of this goodness also finds its way to the “Diagnostic Tools”.
Glad to hear about these major performance improvements! In the past, I have found the profiling tools to write huge (several GBs) log files and the analysis could take 15min with a lot of disk IO, for applications that allocate/free lots of memory.
Yep, the tools still collect a lot of data but we have gotten much better about just holding smaller chunks of analyzed data in memory instead of everything. We have been using the .NET Allocation tool to profile Visual Studio startup and solution load which does a lot of disk IO and memory allocation. We still have additional ideas on how to speed this up even further so hopefully in the next few updates we can post another 10X gain 🙂
The profiler tools in VS are brilliant, and the latest enhancements are looking great 🙂
Have you guys ever considered visualising object allocation & hot paths using a tree view graph? For example, like how the disk space analyser tool WinDirStat displays it:
https://upload.wikimedia.org/wikipedia/commons/thumb/7/72/Windirstat.png/300px-Windirstat.png
If you could visualise the results like that, it would add a lot of value to the tools.
Yep, we are working on some new visualizations for Visual Studio 2022. Right now we are adding a flame chart and are prototyping different views such as chord diagrams, edge bundling, and heat maps. Tree maps are brilliant for disk usage visualization but we have struggled when applying them to memory visualizations. Is there a specific investigation you are thinking of that we could apply this to? Or are you thinking it would be useful to see an overall visualization of the heap?
That's great news about the flame charts - a picture is worth a thousand words as they say.
Tree maps probably wouldn't suit temporal data that changes over time. I was more envisaging them for showing CPU time during a particular operation. For example if you're analysing the child calls of a slow method, it may consist of a few lengthy calls (which would appear as large rectangles) and a bunch of shorter operations that are called many times, so would appear as small rectangles enclosed in a larger one. That way, you get an overall view of...
Ahhh, gotcha. We will add it to the list of visualizations to prototype, hopefully something comes out from it. Regarding the click to go to source, we are working hard to support just that. One of our mantras for Visual Studio 2022 is “no more no source”. Once we get other tools on the new analysis engine they too will get the Source Link and Source Server benefit so we can even pull down 3rd party sources if they are Source Link enabled.
Very cool stuff