Last week we announced the availability of Visual Studio 2015 RC which includes a brand new tool to help you diagnose network related issues when building Windows apps across the Windows continuum from Windows Phone, to HoloLens, to Xbox. This new Network tool is part of the existing Performance and Diagnostics hub – the following screenshot show it in action.
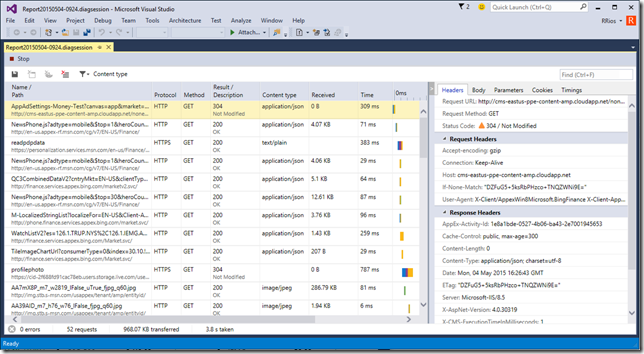 Historically, web developers had relied on in-browser tools for network diagnostics, but it has been a more complicated ordeal for app developers due the lack of tools that integrate into their development workflow. With Visual Studio’s new Network tool, developers can now easily record information about all HTTP network operations made through the WinRT HttpClient API including HTTP request and response headers, request and response payloads, cookies and detailed timing information amongst other things. Operations made using the old .NET HttpClient API aren’t captured.
How does this tool help? It can help get answers to common questions like:
- Authentication related issues (e.g. Why can’t my app access a resource?)
- Cache related issues (e.g. Why is my app getting an older version of a resource?)
- Payload issues (e.g. How many bytes are downloaded? Where is the bottleneck?)
Using the Network tool
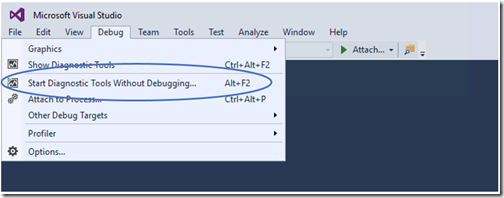
To access the Network tool, open the Diagnostics Tools window in Visual Studio 2015 and on the Debug menu, select Start Diagnostic Tools without Debugging (or just press Alt+F2).
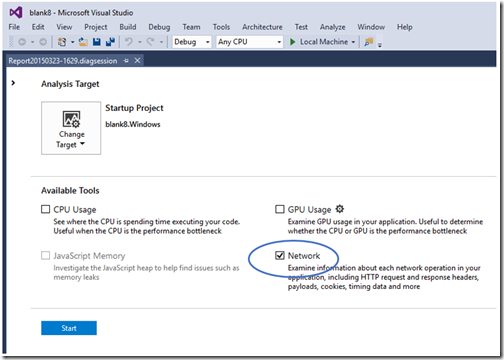
 On the diagnostics page, select the Analysis Target (your startup project is preselected as the analysis target but you can choose to target an installed or running app instead), then select Network and press Start. Alternatively, since the tool is part of the Performance and Diagnostics hub, you can also select additional tools in order to run a combined session.
 Once you start profiling your app, the network tool will automatically capture your app’s HTTP network traffic and display it in the summary view.
Summary view
The summary view is a table like interface that presents you with a simplified view of all captured HTTP operations.
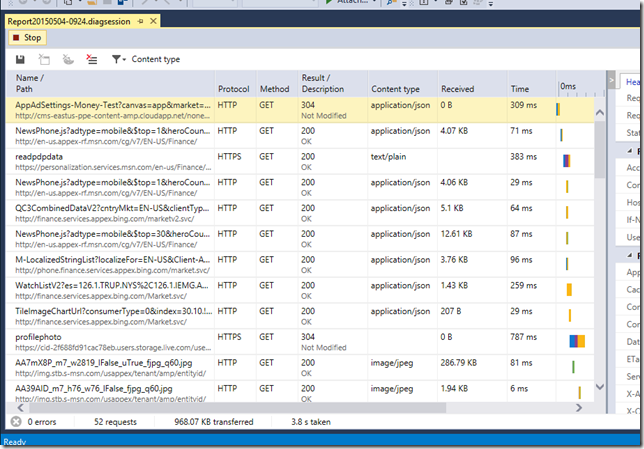 The summary view columns show you:
- Name – The name and URL path of the resource being requested
- Protocol – The protocol used when requested this resource. For example: HTTP or HTTPS.
- Method – The HTTP method used on the request. For example: GET, POST, PUT, etc.
- Result – The response status code and text message as returned by the server.
- Content type – The MIME type of the response as returned by the server.
- Received – The total size of the response payload as delivered by the server. At this point, chunked encoded responses are left as blank.
- Time – How long it took to download the resource since the request was initially sent.
- Timings – A graph that shows where network activity occurred over time. This graph or waterfall view, shows you when a resource was requested and when it finished downloading
In order to increase your productivity, we’ve made the following design choices so that important debugging details are easy to see:
- By default, requests are sorted in chronological order, but they can be sorted differently, by clicking on a different column header.
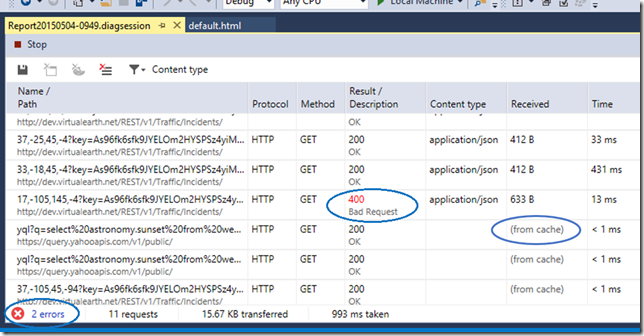
- Requests fully served from the cache are marked as “(from cache)” in the Received column effectively raising visibility into all cache responses. This can help you understand if you are using the cache effectively, perhaps to save user bandwidth, or even if you are caching responses by mistake and providing the end-user of your application with outdated data.
- Errors such as 4xx or 5xx are displayed in the in the Results column with a red colored status code as well as get highlighted in the summary bar, bringing your attention to these potential issues that might need resolving – this makes it easy to spot issues among the many potential requests on your application and eventually resolve them.
- Information about how many requests, total data as well as how long it took is summarized in the summary bar
Toolbar
When debugging network related issues, is possible that you’ll need to share your network traces with other people or import them to Fiddler and other third-party tools in order to run a performance analysis or even share your debugging findings. For those scenarios, we added an export button that allows you to export the captured network traffic into a JSON based HAR format. Doing so allows you to leverage many of the existing third party tools that consume JSON based HAR files to debug or analyze network traces.
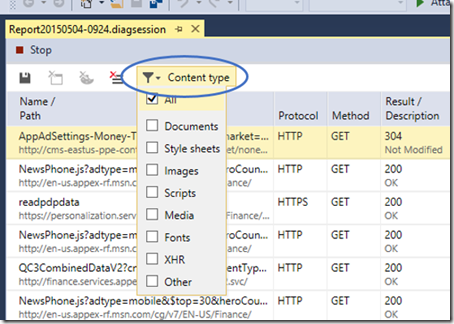
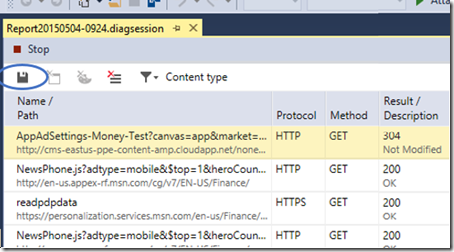 The toolbar also allows you to show sub-set of the captured traffic. For example, if you are only interested in diagnosing issues with image related calls, perhaps an image is not showing or maybe you are not getting the latest version of an image, you can filter out all unrelated content by opening the “Content type filter” and selecting Images from the list of available filters. This feature will allow you to become more productive by allowing you to skip over dozens of unrelated network calls and only focus on the image related ones.
 Once a filter is applied, the summary bar, at the bottom of the page is updated to reflect the new metrics. In fact, this area provides a summary of the captured network traffic currently displayed in the summary view. At a glance, it provides information about network errors (responses with 4xx or 5xx status codes), the number of visible requests, how much response data was transferred and how long it took to download them. This features is especially helpful when trying to measure how much data was consumed in a particular scenario or even have an idea of how long it might take to download certain resources.
Details panel
To get details about a request, simply head to the summary view and click on the request row. At that point, the details panel will open up and all the relevant information about that request will be exposed.
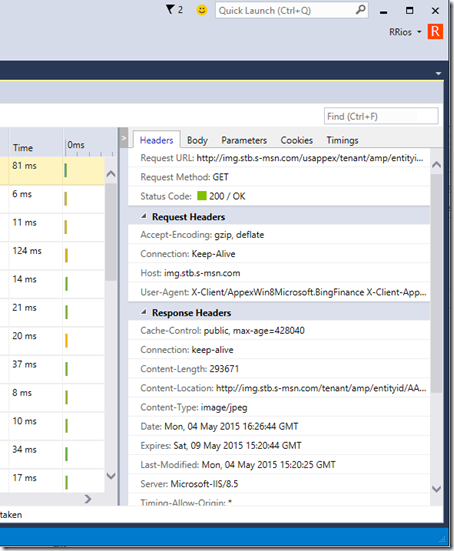 The details panel is divided in the following sections:
- Headers – Provides visibility into the request and response headers as well as summarizes important aspects of the requests and response such as the URL, method and status code.
- Body – Displays the request and response payload bodies as well as provides options to “pretty print” the contents and help make them easier to read.
- Parameters – Breaks down the query string parameters into an easy-to-read format.
- Cookie – Displays the data of the request and response cookies.
- Timings – Displays the timing stages involved in acquiring the respective resource. Since redirects affect the time involved in downloading a resource. This area also calls out if a resource was redirected from or was redirected to a different resource.
To recap, in Visual Studio 2015 you will have access to a new network tool that will help you become more productive by providing you the tools you need to debug most network related issues directly from the Visual Studio IDE. You’ll now be able to debug network related issues for JavaScript, managed as well as native apps for both Windows Store Apps as well as Universal apps targeting Windows 10.
In an upcoming blog post, we’ll be covering how to use the Network tool to solve potential issues when developing your apps. In the meantime, please let us know your thoughts by leaving a comment below or via Send-a-Smile.
 |
Ruben Rios, Program Manager, Visual Studio @Ruben_J_Rios Ruben is a Program Manager on the team that builds debugging tools for Visual Studio as well as the F12 dev tools for Microsoft Edge. Before joining Microsoft, he was a professional web developer and has always been passionate about UX. |


0 comments