
Have you ever needed to debug or profile an executable (.exe file) that you can’t build locally? Then the least known Visual Studio project type, the EXE project, is for you!
In Visual Studio you can open any EXE as a ‘project’. Just go to File->Open->Project/Solution and browse to the .exe file. Like you would if it was a .sln file. Visual Studio will then open that EXE as a project. This feature has been around for a long time. It works on all currently supported Visual Studio versions and the docs for it are at ‘Debug an app that isn’t part of a Visual Studio solution‘.
.
Debugging
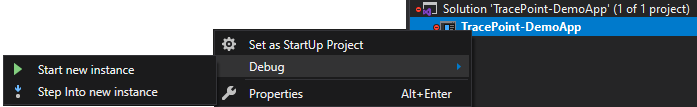
Just as with a normal project you can start debugging with F5, which will launch the EXE and attach the debugger. If you want to debug startup you can launch with F11, which will launch the EXE and stop on the first line of user code. Both of these options are available on the context menu for the EXE project in Solution Explorer window as illustrated below:
For debugging will need to have symbols (PDB files) for the EXE and any DLLs you need to debug. Visual Studio will follow the same process to try to obtain symbols as it does when debugging a normal project. Since it’s not likely that the PDB files were distributed alongside the EXE you might want to locate them from a build drop or, better yet, from a symbol server. More information and best practices for symbols can be found in this blog.
To effectively debug you’ll also need the source code that was used to build the EXE, even for just a few files that you care about. You’ll need to locate those files and open them in Visual Studio. If the source code isn’t the exact same as the source code that was built the EXE Visual Studio will warn you when you try to insert a breakpoint and the breakpoint won’t bind. That behavior can be overridden from the Breakpoint Settings peek window. In the settings peek window click on the Must match source link text and then check the box to allow mismatched source, as illustrated below. Of course, with mismatched source you never really know what’s going to happen, so use at your peril.
If the EXE was built with SourceLink enabled then information about the source will be included in the PDBs and Visual Studio will try to download the source automatically. This is a really good reason to use SourceLink with your projects. Even if you have a local enlistment you might not have the same version that was used to build the binary. SourceLink is your sure-fire way to make sure that the right source is linked with the right binary.
If you can’t obtain any source code you still have a couple of options:
- Use a tool to decompile the assemblies back into C#, which you can then recompile into a new assemble to patch the old one.
- ILSpy is a great choice for this, but there’s plenty of other good paid and free tools out there.
- [Note: Several comments have also pointed out dnSpy https://github.com/0xd4d/dnSpy as a great solution for this – thanks!]
- Use the Disassembly tool window in Visual Studio.
- The Source Not Found document has a link to view disassembly. Be warned, if you’re used to debugging C# code the disassembly view is a tool of last resort.
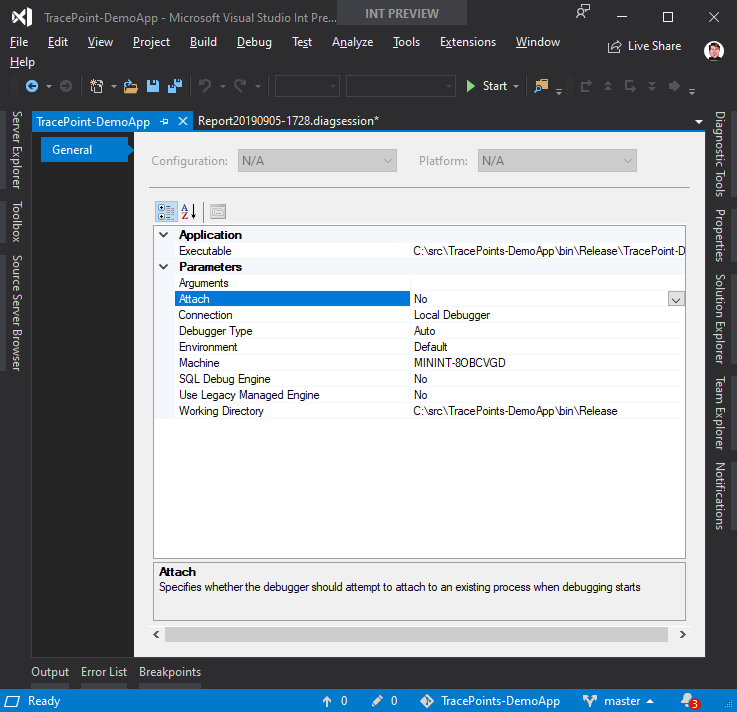
Lastly, if you need to pass in any arguments to the EXE that’s being debugged you can configure them along with other options in the Project Properties page (Right Click->Properties on the project node in solution explorer).
Profiling
You can also use the profiling tools with the EXE by launching them from the Debug -> Performance Profiling. From the launch page of the profiling tools you can select what tools to use against the EXE. More information on profiling can be found in the docs over at :https://docs.microsoft.com/en-us/visualstudio/profiling/profiling-feature-tour?view=vs-2019.
Conclusion
That’s it. A brief overview of how you can use Visual Studio to debug and profile applications that you aren’t building and might not even have source for. So, next time you need to debug or profile an EXE don’t forget you can open it as a Solution in Visual Studio!
I am just beginning to learn Visual Studio 2019, and already I can see the merits of becoming an expert in it as quickly as possible. now especially; inspired by your post!! Thanks!!
CA Vikram Shankar Mathur
Have you heard of dnSpy? It does not need the source code but decompiles the binary directly into C# code. Also no pdbs necessary. Much better than Visual Studio. But the best of all is that it pretty much looks like Visual Studio just with a better feature set. And it is open source. See https://howtocode.net/2019/09/how-net-4-8-can-break-your-application/ for more information. You can even patch mscorlib if you want to.
I hadn’t heard of it. Not until the comments on the blog. It does look like a great tool though.
Nice feature, I was not aware of it!
However, when I need to debug any live .NET process, and I do not have symbols/source code this is my favorite tool:
https://github.com/0xd4d/dnSpy
Just:
– attach to process
– load module from memory
dnSpy will disassemble and you can start to set your breakpoints in human readable .NET code, it’s an amazing tool.
Thanks for pointing out dnSpy I wasn’t aware of it and it looks like a great tool! I’ve added a link to it in the blog. Thanks!
TL;DR: “you’ll also need the source code that was used to build the EXE”
Disappointing, but interesting nonetheless.
Agreed. A perfectly good article blighted by a clickbait title. It should really read “how to debug the source code for projects you didn’t build” or something to that effect.
Well We use ReSharper and it can decompile on the fly by generating PDB and Source code as you step into the functions.
Also agreed.
There are several grammar errors in this article.
– “you can recompile into new assemble” (into a new assembly)
– “if you’re use to debugging C# code” (using it to debug)
– “More information on profiling can be found in this docs” (can be found in these docs)
So, a clickbait title, and an article that obviously wasn’t proofread by anyone. Disappointing.
Thank you for the feedback. I didn’t mean the introductory sentence to be clickbait, it was more a reflection of how I use the feature. Which is to debug other folks app that I don’t build or have a local source enlistment but instead the source is fetched via SourceLink or Source Server (which I didn’t mention as a solution isn’t used a lot outside of Microsoft). Anyhow, I’ve updated the initial sentence to focus on not being able to build.
Thanks for spotting the grammar errors. I’ve updated the blog to fix them (hopefully).