Unfortunately bugs are a part of software development, and despite our best efforts to write software correctly from the start we spend a lot of time in the debugger. While bugs are an unfortunate fact of life, finding them doesn’t have to be as painful as it often is. For you problem-solvers out there, the Visual Studio 2015 debugger contains a rich set of features that can really increase your productivity…assuming you know they exist, and how to use them! To help with you learn more about our debugging tools, I recently gave three talks on “Debugging Tips and Tricks for .NET developers”, at Microsoft’s Build Conference (60 minutes), at Microsoft’s Ignite Conference (75 minutes), and most recently on Visual Studio Toolbox (38 minutes). So check them out!
For the folks who like the printed word more than talking heads, I’ll also cover some of the highlights I hit on in the talks. These tips include both new features in Visual Studio 2015 as well as useful functionality from previous versions of Visual Studio.
Note: If you are interested in watching one of the talks, all three talks use the same demos and cover similar content, where the shorter talks are simply more selective about which features they show.
Start Debugging
While most debugging sessions begin with “Start Debugging”, there are other options as well:
-
Need to start debugging at the entry point of the application? Use “Step Over” (F10) or “Step Into” (F11) when in design mode and it will take you to the entry point of the application (assuming Just My Code is enabled) eliminating the need to find the line of code in the correct source file to place the breakpoint on.
-
No code edits to make at design time? Restart debugging allows you to quickly restart your application with debugging enabled. This eliminates the need to click “Stop Debugging”, then wait for the IDE to return to design mode, and THEN click “Start Debugging” again.
-
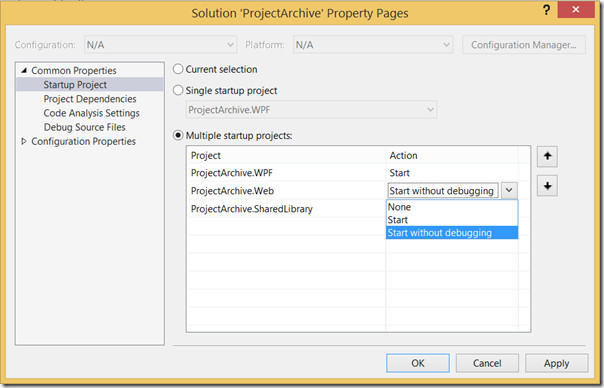
Need to start multiple projects in your solution? Configure your solution for multiple startup projects, to launch multiple projects with (and/or without) debugging. This is particularly useful when debugging a solution that contains applications that depend on each other at run time (e.g. a client and server).
Execution Control
Need to get the debugger to the desired location in source code? Here are a few tips that can make this faster.
-
Set Next Statement allows you to control what code will execute next, including re-executing code that has already run. This can be helpful for testing conditional branches of code without the need to modify the input to correctly satisfy the conditions for the desired code path.
-
Step Into Specific allows you to choose which function you step into when multiple functions are called on the same line of code.
-
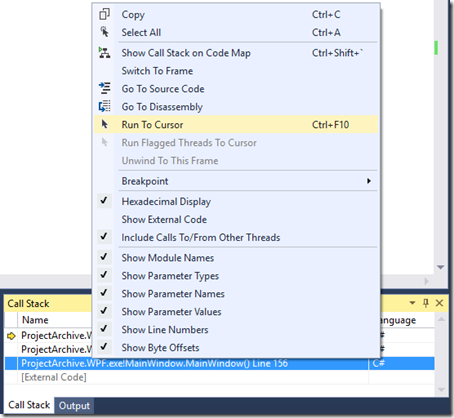
Run to Cursor creates a one-time breakpoint so you don’t have to remember to unset it when you’re done. Run to Cursor works both to start debugging and run to a single location when you’re already debugging. It is available from the context menu in the editor or using the keyboard shortcut (Ctrl+F10).
- Run to Cursor also works in the Call Stack window. It finishes executing all of the child frames on the call stack and then pauses the program’s execution (just as if you had done as many Step Outs as required to stop on the selected call stack frame).

-
How to configure breakpoint conditions and actions (including the new UI experience in Visual Studio 2015), which covers
Data Inspection
Once you get the debugger to the desired location you’re probably going to inspect your application’s data. Here is a look at a few options:
- Debugger visualizers, specifically the built in visualizers for text, XML, HTML, JSON, DataSets, and WPF
- Return values show you values returned by all functions called on a line that is stepped over
- How to use DebuggerDisplay attributes to modify how the debugger displays variable values
- The ability to “pin” DataTips to the editor

Productivity Improvements
In the demos I also showed the improvements in Visual Studio 2015 that were some of your top requests to help improve productivity using the debugger:
- Much broader Edit and Continue support including Lambda expressions
- The new Exception Settings window in Visual Studio 2015
- Lambda expression support in the debugger windows
- PerfTips
- The Diagnostic Tools window
Learn more
The above content was a quick sample of what was covered in the talks. If this piques your interest I would recommend watching one of the talks listed above (here are the links again for convenience–Visual Studio Toolbox, Build, Ignite—most detailed). Additionally, you can follow the diagnostics team including the debugger on our team blog.
If you have any questions or comments, please let me know through Visual Studio’s Send a Smile feature, in our MSDN forum, via Twitter, or leave a comment below.
 |
Andrew Hall, Program Manager, Visual Studio Diagnostics @AndrewBrianHall Andrew has been at Microsoft for 7 years, all spent working on diagnostic tools. In his time on the team he has worked on the debugger, profiler, and code analysis tools. |


0 comments