We’re happy to share the highlights of the latest Visual Studio 2017 preview, which is now available for download, including:
- Productivity and Performance improvements – Visual Studio is more responsive and usable, and projects load faster.
- Improved tooling to profile and understand your applications performance.
- Updated JavaScript and TypeScript tooling, including improved Vue.js and ESLint support, and right-click context menu productivity improvements.
- More C++ productivity improvements in IntelliSense, Code Analysis, and Just My Code debugging.
- Improved performance for Visual Basic integer manipulation.
- Azure Development improvements, including continuous delivery for Azure Functions, better experience managing secrets via Key Vault, and ability to configure Application Insights during initial site creation.
- More Library Manager features for managing Web Projects’ client-side library files.
- Mobile Development improvements such as faster Android incremental builds and inclusion of Xamarin.Essentials to facilitate building native apps.
This Preview builds upon the features that debuted in Visual Studio version 15.8 Preview 1 and Preview 2 which were both released last month. As always, you can drill into the details of all of these features by exploring the Visual Studio 2017 version 15.8 Preview release notes.
We hope that you will install and use this Preview, and most importantly, share your feedback with us. To acquire the Preview, you can either install it fresh from here, update your bits directly from the Preview IDE, or if you have an Azure subscription, you can simply provision a virtual machine with this latest Preview. We appreciate your early adoption, engagement, and feedback as it helps us ship the most high-quality tools to everyone in the Visual Studio community.
Please note: A number of great new 15.8 features are debuting in Preview 3, so you’ll find this blog is more detailed than most of our preview posts.
Productivity
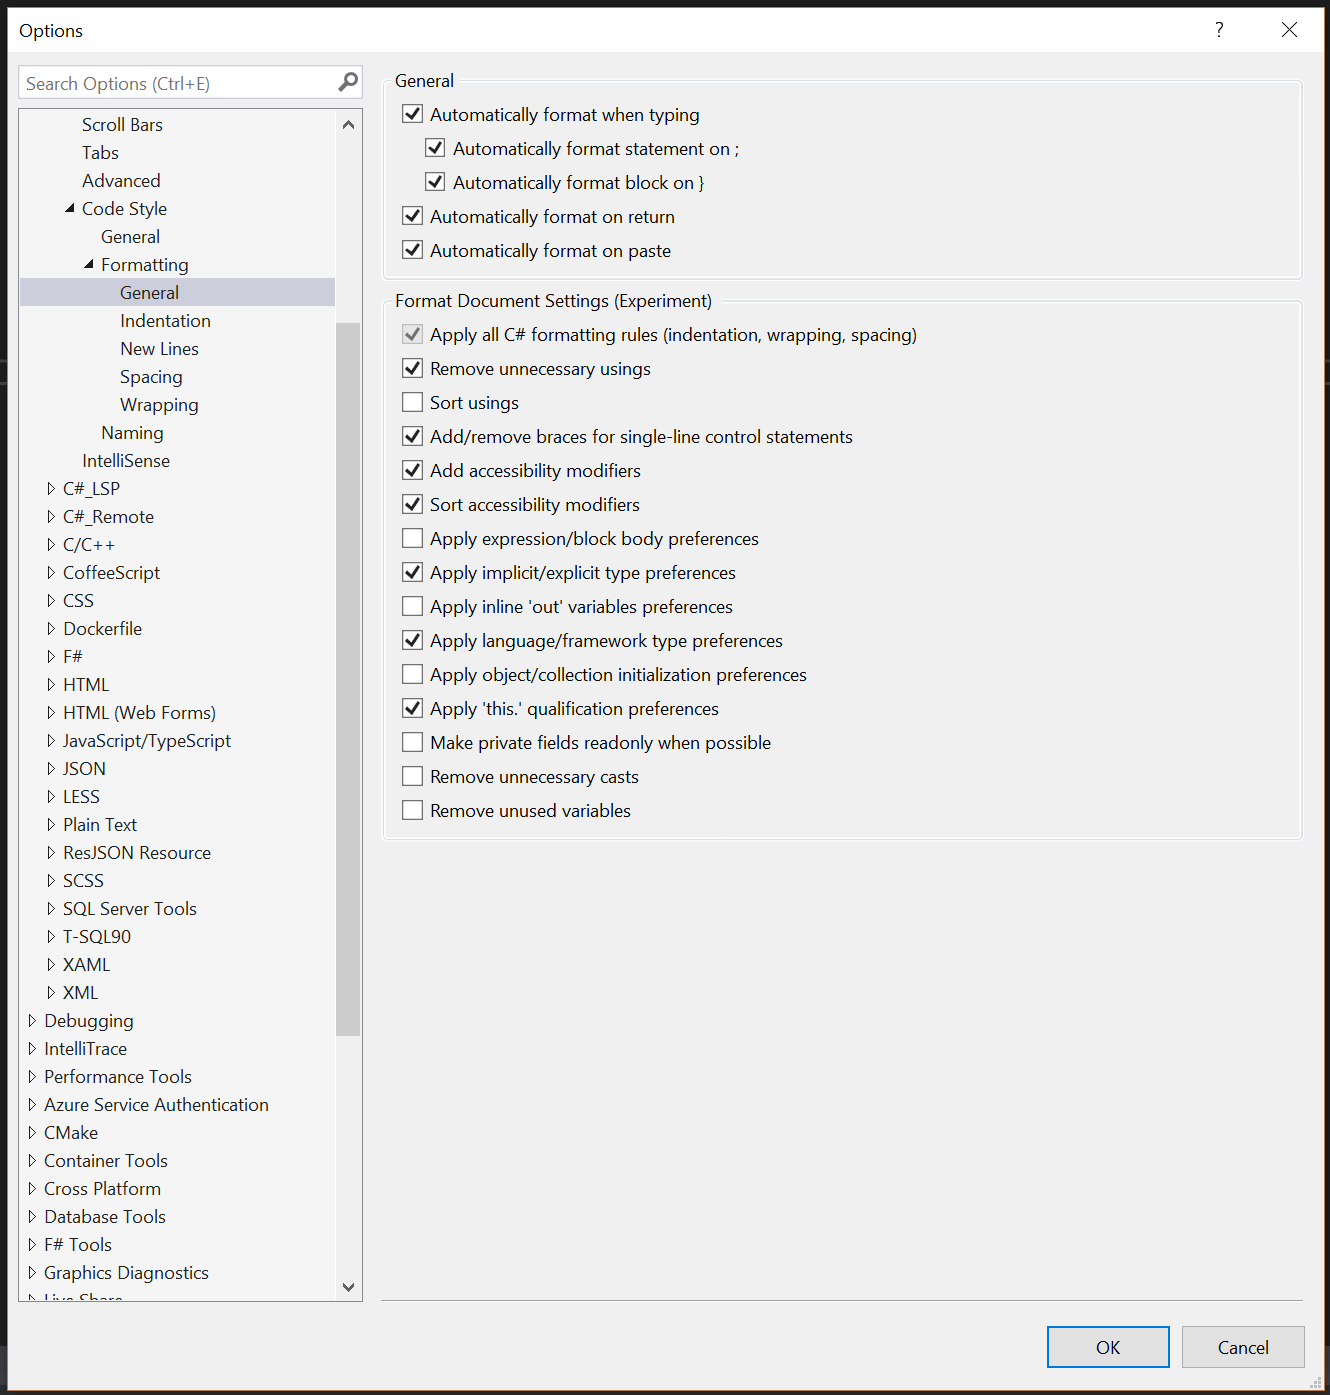
C# Code Cleanup: The next time you invoke Format Document (Ctrl+K,D) you will see a yellow bar prompting you to configure your code cleanup. These new settings allow you to go beyond simply reformatting your file by enabling you to remove and sort usings as well as fix coding convention violations to match the preferences in your .editorconfig, or lacking that, your Tools>Options configuration. You can change your Format Document settings at any time by going to Tools > Options > Text Editor > C# > Code Style > Formatting > General and see new .editorconfig options for .NET code style in our documentation.
Deferred Extension Loading: Visual Studio has a rich ecosystem of extensions that extend functionality and enhance the development experience. Getting all this functionality loaded, initialized, and running can take time. In order to preserve Visual Studio’s startup responsiveness, cooperating extensions won’t be loaded until after a solution has been opened. The progress bar in the task status center will give you visibility into the state of the loaded extensions. Authors of startup performance friendly extensions (i.e. those who have taken advantage of AsyncPackage so that their extensions can load on the background) should test their extension against Visual Studio 2017 version 15.8 and confirm that everything continues to work after deferred loading. See more details in this blog.
Multi-Caret Support: In version 15.8 Preview 3, we’re excited to address one of our top voted UserVoice items: native multi-caret support. With this feature, you’ll be able to create multiple insertion points or selections at arbitrary places in your file or add additional selections that match your current selection, allowing you to add, delete or select text in multiple places at once. For a full list of features included with multi-caret support, look under the Edit > Multiple Carets menu flyout.
Additional Keyboard Mappings: We know many people switch between Visual Studio Code and Visual Studio. To help give you a more consistent set of key mappings as you switch between the two, we’ve introduced a new Visual Studio Code keyboard mapping scheme. We’ve also included a key mapping scheme that matches the ReSharper mappings. You can find and activate these profiles under Tools > Options > Environment > Keyboard > Mapping Schemes dropdown.
Performance
Project Loading: Visual Studio version 15.8 Preview 3 brings faster project reloads for all types of projects. Benefits are huge – project unload and reload that used to take more than a minute for large solutions now takes just a few seconds. Git branch checkout that changes a project file. Stay tuned for more project load performance improvements in subsequent releases. Please check out the Visual Studio Preview release notes for details on how we made these perf gains.
Showing Data Connections from ASP.NET Web Projects in Server Explorer: While loading ASP.NET Web projects, database connections specified in web.config are automatically added to the “Data Connections” node in the Server Explorer window. Adding these connections, particularly if there are a lot of them, may take a long time to complete. Although we have improved the performance of loading these connections, we have also received feedback from some users that they would like to load them manually at a later point. In this update, we introduced a new setting that allows you to configure and control how and when data connections are loaded. This setting, which is checked by default, can be found under Tools -> Options -> Projects and Solutions -> Web Projects: “Automatically show data connections from web.config in Server Explorer”. If it is unchecked, connections will no longer be automatically loaded. You can add them manually by using the context menu “Add Connections from web.config” on the “Data Connections” node in the Server Explorer.
Performance – Profiling Applications
We have a few notable improvements to highlight in this Preview regarding the CPU Usage Tool. These improvements build upon the CPU Usage Tool features we announced with version 15.8 Preview 2.
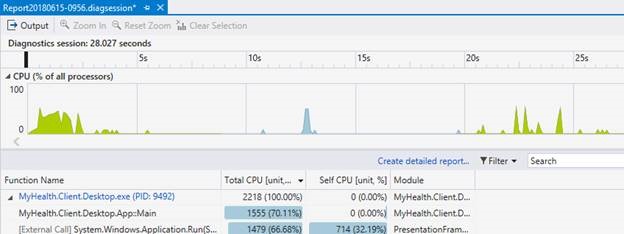
Pause/Resume for Collection of CPU Usage data: The CPU Usage tool in the Performance Profiler (ALT-F2) can now start in a paused state, which means that it will not collect any CPU usage sample stack data until it is specifically enabled. This makes the resultant amount of data much smaller to collect and analyze, thus making your performance investigations more efficient. Once you start the target application, a monitoring display will show the CPU utilization graph and will allow you to control the CPU profiling and enable/disable sample data collection as many times as you like.
The CPU utilization graph changes color to indicate whether sample collection is enabled/disabled at that point in time.
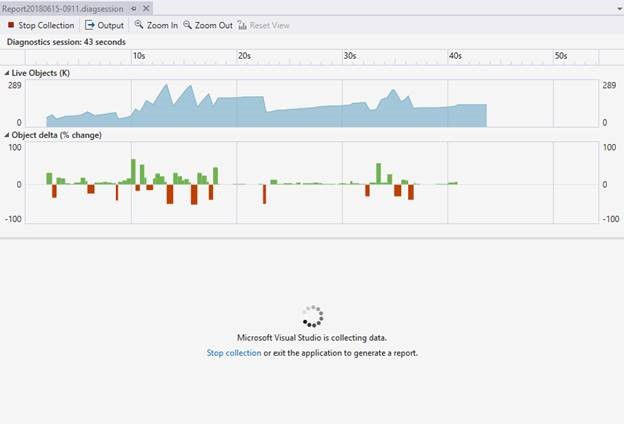
The .NET Object Allocation Tracking Tool joins the family of tools available from the Performance Profiler (ALT-F2). Invoking this tool for a performance profiler session causes the collection of a stack trace for every .NET object allocation that occurs in the target application. This stack data is analyzed along with object type and size information to reveal details of the memory activity of your application. You can quickly determine the allocation patterns in your code and identify anomalies as well. In addition, for Garbage Collection events, you can easily determine which objects were collected and which were retained, quickly determining object types which dominate the memory usage of your application. This is especially useful for API writers to help minimize allocations. While your test application is executing, the Performance Profiler displays a monitoring view with a line graph of Live Objects (count), as well as an Object Delta (% change) bar graph.
Refer to the Visual Studio Preview release notes for details on how to configure settings for these tools and learn more about how to use them. Please give the CPU Usage Tool and the .NET Object Allocation Tracking a try and send feedback if you have any issues or suggestions.
JavaScript and TypeScript Tooling
There are a lot of improvements to JavaScript and TypeScript tooling in this version 15.8 Preview. Highlights include:
TypeScript 2.9: This release includes TypeScript 2.9 by default, which includes richer IntelliSense for some common JavaScript patterns, several new refactorings, and numerous type system improvements. For full details, see the recent TypeScript 2.9 blog post.
Improved Vue.js support: Support for the Vue.js library has been improved, particularly regarding support for .vue files, aka “single file components”, and enhancements when editing script blocks inside .vue files. Additionally, when the Node.js workload is installed, the New Project dialog will contain additional “Basic Vue.js Web Application” templates under the “JavaScript / Node.js” or “TypeScript / Node.js” paths.
ESLint support has been reimplemented in this release, and the following functionality is now enabled. Rather than only linting saved files, Visual Studio will now lint JavaScript files while they’re opened and being edited. Additionally, results will be reported for all JS files in your project, not just open files. If there are parts of your project you do not want to be linted, an .eslintignore file can now be used to specify directories and files that should be ignored. ESLint has been updated to use ESLint 4 by default, but if your project has a local installation of ESLint, it will use that version instead.
Open Folder: Visual Studio 2017 version 15.8 Preview 3 includes productivity improvements to the Node.js and TypeScript development experience. For example, when working in Visual Studio via the “File / Open / Folder…” menu option, you can now right-click to bring up the context menu and select “Build” to build the TypeScript code with the latest TypeScript compiler, “Debug” to run the file with the debugger attached, or “Npm” to invoke NPM package management commands. Refer to the Visual Studio Preview release notes for details on how to configure your projects so these commands are available.
Improved Editor Performance: In previous releases, all JavaScript and TypeScript language service operations were serviced by a single Node.js process. This could cause editor delays if commands that impact user typing (such as automatic formatting after a newline) were sent while a potentially lengthy operation was already in process (such as analyzing code for errors). To mitigate this, a separate process is now used for the operations that most impact editing. This process is significantly lighter on system resources than the existing language service process.
C++ Development
C++ Templates IntelliSense: Visual Studio 2017 version 15.8 Preview 3 brings IntelliSense for Templates – you can provide more details about template arguments to take full advantage of IntelliSense within your template body.
C++ Refactoring: We’ve also added a new quick-fix lightbulb to convert basic macros to constexpr as a new tool to modernize your C++ code.
C++ Just My Code debugging enables you now to step-over code from system or 3rd party C++ libraries in addition to collapsing those calls in the call-stack window. You get to control this behavior for any C++ libraries when your code is compiled with /JMC (the default for Debug configurations) and the non-user libraries paths are specified in a .natjmc file. If the system library calls into user-code, when you step in, the debugger will skip all system code and will stop on the first line of user-code callback.
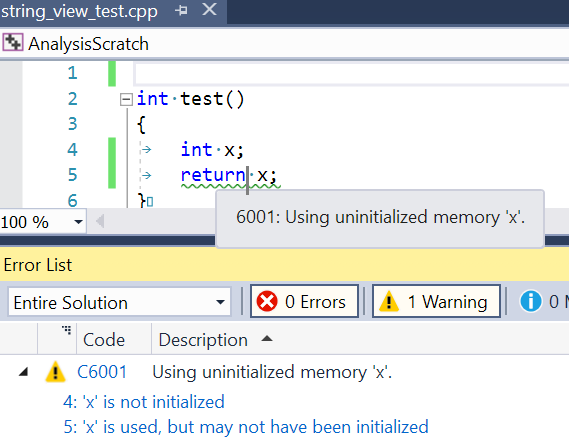
Code Analysis: We are continuously working to refresh our code analysis experience. You can now enable the new, in-progress features under Tools > Options > Text Editor > C++ > Experimental > Code Analysis. Code analysis can run in the background when files are opened or saved, and results will be displayed in the error list and as green squiggles in the editor.
CMake: Adding configurations to CMakeSettings.json is now as simple as selecting a template.
C++ Standards: A new, experimental, token-based preprocessor that conforms to C++11 standards (including C99 preprocessor features), enabled with /experimental:preprocessor switch. This will be controlled with macro _MSVC_TRADITIONAL, which will be defined to 1 when using the traditional preprocessor and 0 when using the new experimental standards conformant preprocessor.
Spectre mitigations: The Visual Studio Developer Command Prompt now supports enabling the Visual C++ Spectre variant 1 mitigated runtimes (via the -vcvars_spectre_libs=spectre switch). More information about Spectre mitigations is available on the Visual C++ Team Blog.
Visual Basic Development
Integer manipulation: Visual Basic normally uses functions in the System.Math library when converting non-integer types to integers. This is generally beneficial as the conversion provides a rounded result. However, there is a performance penalty when rounding is not needed. Since Visual Basic programmers indicate truncation with Fix(), a new optimization will be applied to the pattern CInt(Fix(number)) which will improve performance is scenarios such as graphics manipulation.
Azure Development
Azure Functions: You can now configure continuous delivery for solutions with Azure Function Projects directly from Visual Studio 2017. Right click on the solution and click “Configure Continuous Delivery to Azure…”, to launch the dialog. Select “Azure Function” as a target host type and click OK. Visual Studio will automatically create a new Azure Function, a build definition and a release definition targeting that host to automatically deploy your azure function every time you update your code.”
Azure Key Vault: We have continued to build on the secret management experience by adding the ability to configure an Azure Key Vault with your published application. The Azure Key Vault provides a secure location to safeguard keys and other secrets used by applications so that they do not get shared unintentionally. You can attach a Key Vault already connected with your local project to the published application through the publish summary page. Otherwise, setting a Key Vault up through the publish summary page will attach a Key Vault to both the published and local application.
Publishing Apps to Azure : When creating a new App Service, Visual Studio now offers the ability to configure Application Insights for your site as part of the initial creation process. Application Insights provides diagnostic, analytics, and performance data for your site. If Application Insights is available in the region of your site, it will automatically be enabled as indicated by the Application Insights dropdown being set to the same location as your App Service. If Application Insights is not currently available in the region as your site it will default to “None”, but you can still enable it by selecting a supported region to run Application Insights in for your site.
Web Development
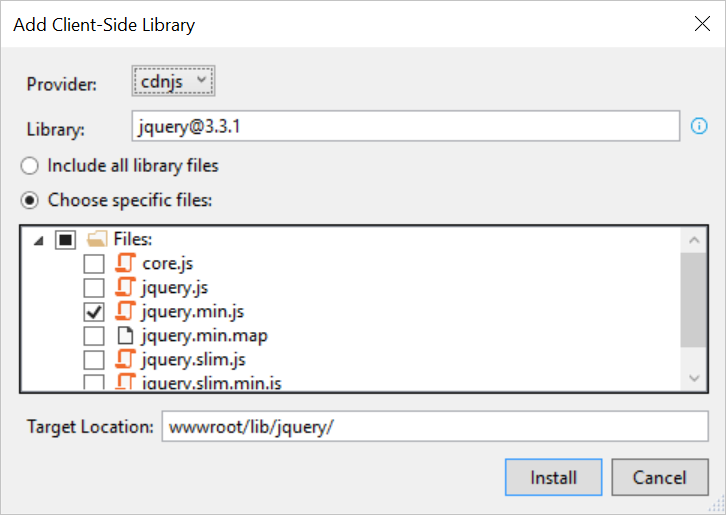
A couple of months ago, we introduced a new Library Manager (LibMan), a lightweight effective solution for web developers to easily manage common client-side library files. Features of the Library Manager include support for common operations like restore and clean, as well as productivity aides like IntelliSense. In this Preview, the Library Manager added UI tooling to find and select library files in order to add them to your project. Additionally, LibMan now recognizes another provider, UnPkg, which provides access to all files available on the npm repository.
Mobile Development
Android Incremental Build Improvements: Xamarin.Android leverages files generated in the intermediate output directory to achieve incremental builds that are faster than full builds. Previously, if you changed your project’s target framework it would invalidate the files and result in a full build on the next run. In this release we now preserve the files in per-framework folders so you can switch between different target frameworks and still benefit from incremental builds. Cleaning the project will allow you to reclaim the disk space used by the preserved files.
Xamarin.Essentials APIs: Our Xamarin templates in Visual Studio 2017 have been updated to include Xamarin.Essentials, a core set of cross-platform APIs to help developers build native apps. Xamarin.Essentials gives developers access to over 30 platform-specific APIs that can be accessed from their shared code, including geolocation, secure storage, sensors, device information, and many more. Best of all, it can be used in any iOS, Android, UWP, or Xamarin.Forms app, regardless of how you create the user interface.
Try out the Preview today!
If you’re not familiar with Visual Studio Previews, take a moment to read the Visual Studio 2017 Release Rhythm. Remember that Visual Studio 2017 Previews can be installed side-by-side with other versions of Visual Studio and other installs of Visual Studio 2017 without adversely affecting either your machine or your productivity. Previews provide an opportunity for you to receive fixes faster and try out upcoming functionality before they become mainstream. Similarly, the Previews enable the Visual Studio engineering team to validate usage, incorporate suggestions, and detect flaws earlier in the development process. We are highly responsive to feedback coming in through the Previews and look forward to hearing from you.
Please get the Visual Studio Preview today, exercise your favorite workloads, and tell us what you think. If you have an Azure subscription, you can provision a virtual machine of this preview. You can report issues to us via the Report a Problem tool in Visual Studio or you can share a suggestion on UserVoice. You’ll be able to track your issues in the Visual Studio Developer Community where you can ask questions and find answers. You can also engage with us and other Visual Studio developers through our Visual Studio conversation in the Gitter community (requires GitHub account). Thank you for using the Visual Studio Previews.





0 comments